1.- In your own words, what is fundamental analysis? Do you think it is important for a trader? Justify the answer.
Fundamental analysis
This is also regarded as macroeconomic analysis. It involves the study of financial news and information on the media platforms that can move the direction of the market through inequalities or equilibria between supply and demand in a cryptocurrency asset. Examples of such events are political news from world powers against or for an asset, economic news from leaders of big financial institutions like world banks, trade unions, etc.
Fundamental analysis also involves checking out some necessary information of the asset that you are buying as an investor like the owner of the asset(his Twitter account, LinkedIn profile, Instagram, and Facebook if possible), Check for the assets website, community(telegram, discord, and Twitter), the current number of holders of the coin, use case of the crypto asset, the average total daily volume, the market capitalization, the total supply and circulating supply and finally the number of Centralised and decentralized exchanges it's listed on.
Fundamental analysis is very important to a trader because if not done properly can lead to total loss of funds. Single negative news against an asset can cause a great crash in the price and if the trader is not aware of that, then he should be ready to lose his funds. For example in 2020 a lawsuit was filed again the asset Ripple(XRP) and there was a rumor that they lost the case this caused a massive crash in the price of then because investors were afraid and all had to sell off their bags. I believe that with this illustration it's obvious that fundamental analysis is very important and essential and will give a better result in union with sentimental and technical analysis.
2.- Explain what you understand by technical analysis and show the differences with fundamental analysis.
Technical analysis
This involves the Studying of charts, candlesticks, and indicators to predict the future price movement of the market drawing reference to the historic and past moves of the price of assets. Technical analysis helps in measuring the strength and weakness of the market structure and cycle at a given time.
It requires knowing the uses of different types of candlestick patterns which are all synonymous with important insights in the movement of the market. The trader is required to study and gain mastery of the working ethics of different indicators present in the market because they all have specific functions and features that are used to understand the movement of the market better. One of the beauties of the technical analysis is that it gives a clear feature of proper risk management as they give room for attaching Take profit and stop very important loss. The trader will also need to study the uses of all the tools and icons in the Tradeview platform which is very useful for technical analysis.
Difference between Technical Analysis and Fundamental Analysis
- Technical Analysis uses charts, candlesticks, and indicators to make trade decisions while Fundamental Analysis makes use of News(Economic and Political) and information about the asset to make trade decisions.
- Technical Analysis allows proper risk management by providing good Take profit and stops loss point while Fundamental Analysis does not give a good risk management opportunity as they always tell you to take profit when your greed levels reach.
- You must look at the chart for entries in technical analysis while you don't need to look at the chart in fundamental analysis rather you enter once you confirm the news.
3.- In a demo account, execute a sell order in the cryptocurrency market, placing the support and resistance lines in time frames of 1 hour and 30 minutes. Screenshots are required.
4.- In a demo account, execute a buy order in the cryptocurrency market, placing the support and resistance lines in time frames of 1 day and 4 hours.
5.- Explain the “Hanging Man” and “Shooting Star” candlestick patterns. Show both candlestick patterns on a cryptocurrency market chart. A screenshot is required.
Hanging man candlestick
This is a type of downtrend reversal candlestick pattern, made up of just a single candle, found in a bullish trend of price charts of the cryptocurrency market. It has a long wick below and a brief body at the top with very little or no wick above. For a candlestick to be a verified hanging man pattern, the lower wick must be double the size of the body portion of the candle, and the body of the candlestick must be above in the candle. It's one of the important technical analysis tools for identifying trend reversal from bullish to bearish.
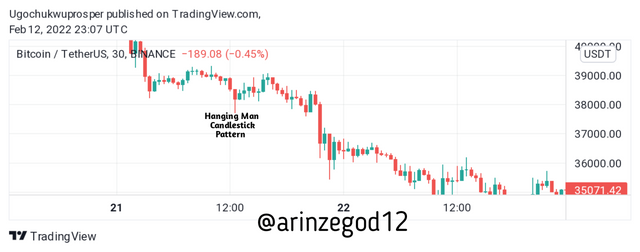
Source: Tradingview
Shooting Star Candlestick
This is a type of trend reversal pattern signifying a falling price. The Shooting Star looks similar to the Inverted hammer candlestick, but instead of being located in a bearish market, it is found in a bearish market and therefore has varied significance. it is made up of a candle with a small body below with little or no wick attached and a long wick above that is double the size of the lower body. This candlestick pattern signifies a downtrend reversal from the market.
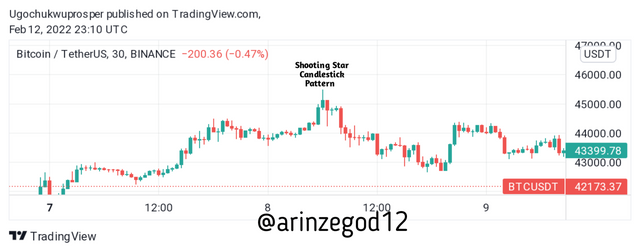
Source: Tradingview
Conclusion
Thanks so much, prof @pelon53 for this interesting and simplified lecture.