Introduction
1-Explain your understanding of the median indicator.
Median Indicator is a technical analysis indicator used to detect and catch trends in the market and also used to show the amount of volatility in the market as well. It is used to show the median value of high and low of a particular length of the price movement in the chart. The Median indicator when applied to the chart shows a moving average like a thick line that shows a purple color in a bearish trend and a green color in a bullish trend. Furthermore, the green bullish band shows as the median line moves above the Exponential Moving Average of the similar length and the purple bearish band shows as the median line moves under the Exponential Moving Average of the same length.
How to apply the Median indicator in your chart
For you to apply the median indicator in your Tradeview platform chart, you click on the indicator button on the top of the chart
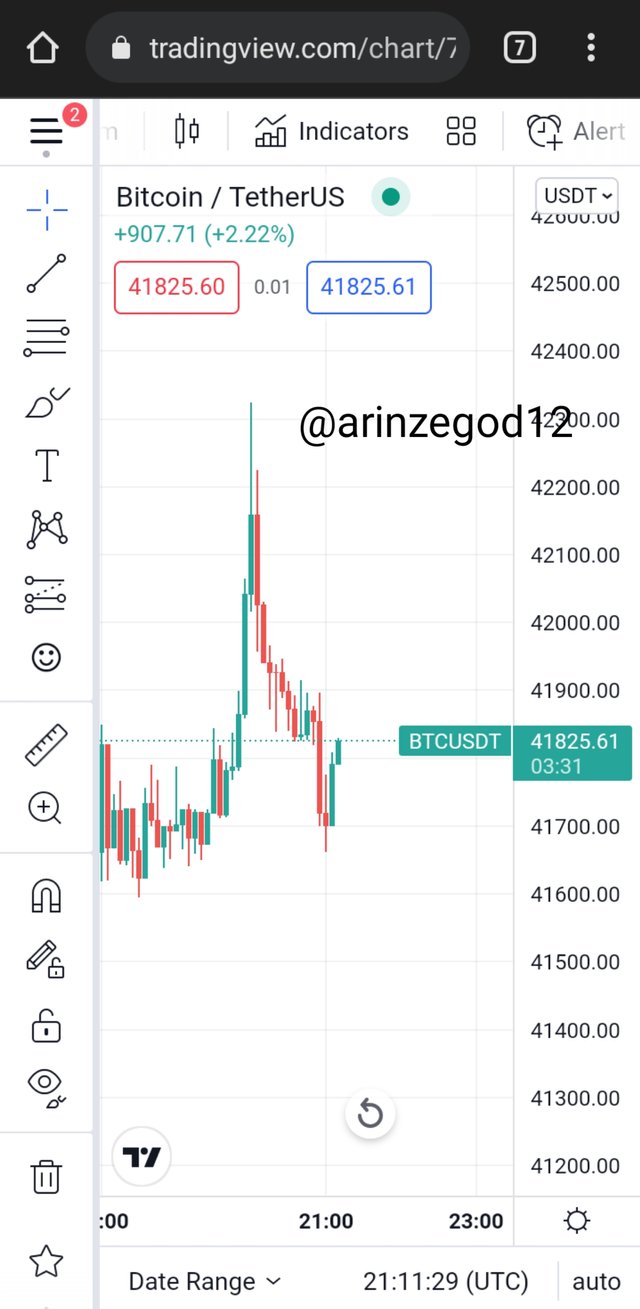
Source: Tradingview
search for the median indicator. Once you see it, you click on it
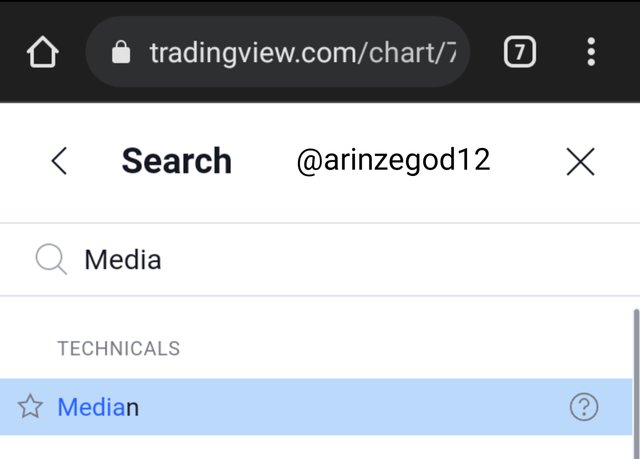
Source: Tradingview
and it appears on the chart immediately.
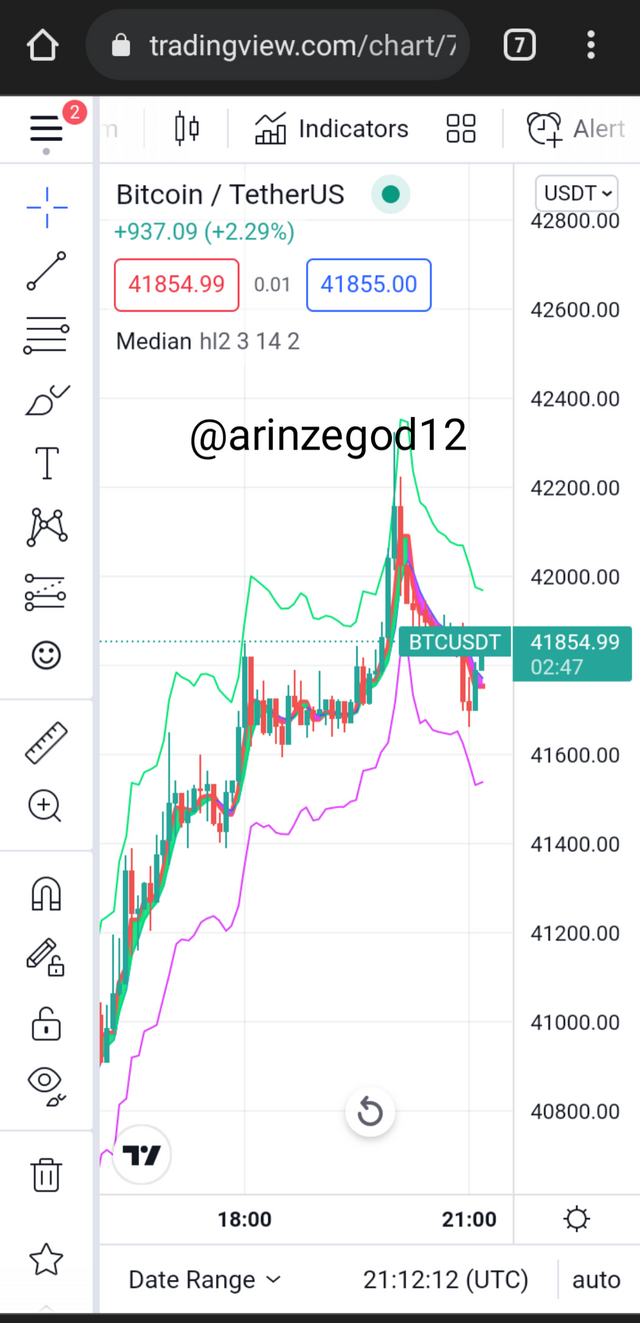
Source: Tradingview
2-Parameters and Calculations of Median Indicators. (Screenshot required)
Indicators are derived from mathematical calculations of price movements in the candlestick of the chart like Lows, highs, opening price, closing price at a given duration.
Emphasizing the Median indicator, it makes use of the Average True Range(ATR) and a Multiplier to create the lower and upper band under and on top of the median line respectively.
The parameters are as follows:
Median length
This is the number of data positions considered when calculating the median. The numerical value by default is 3.
Average True Range Length
This indicates the intervals deliberated when computing the ATR of the median. The numerical value by default is 14.
Average True Range Multiplier
The ATR multiplier happens in the building of the lower and upper bands. The numerical value by default is 2.
The above given are the default values of the indicator in the tradeview platform though this parameter can be modified as well to suit the trading style of the trader. The screenshot is below.
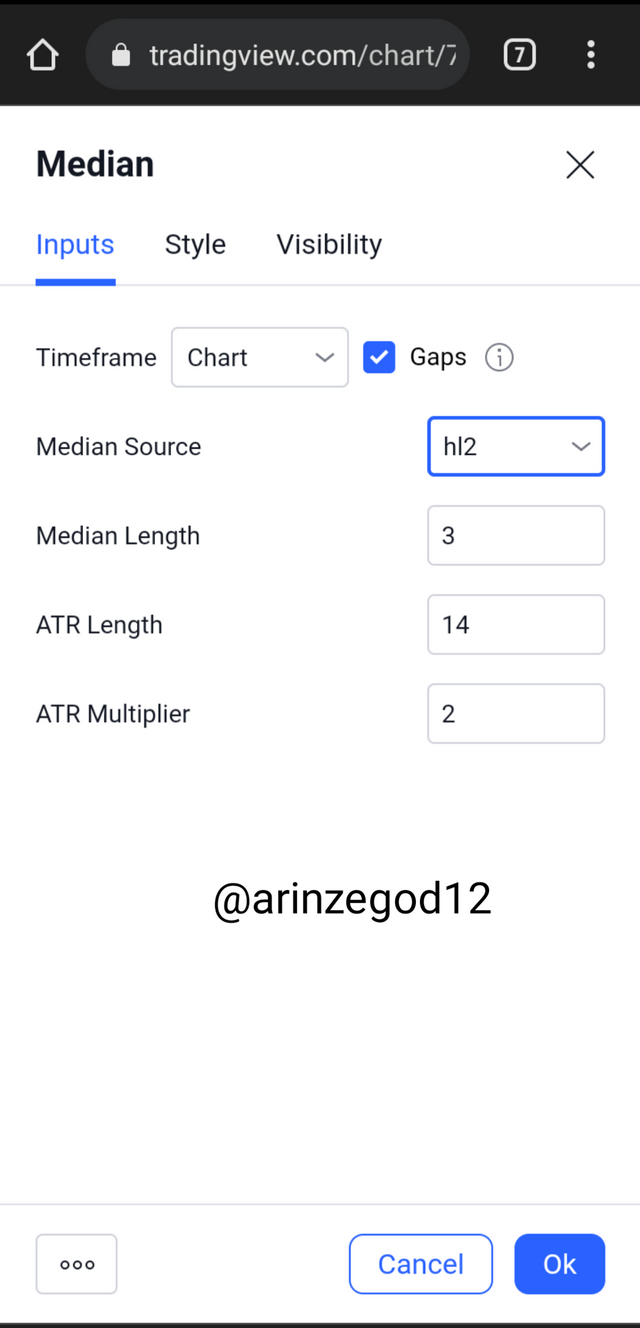
Source: Tradingview
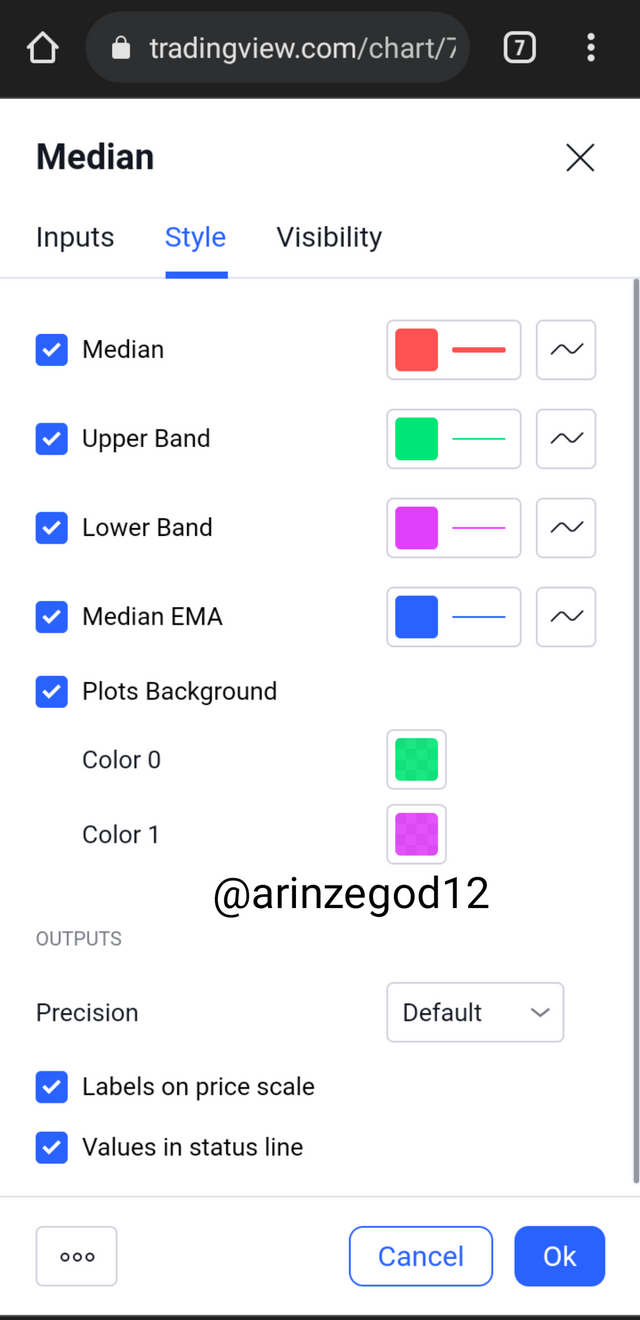
Source: Tradingview
The calculation is as follows:
Lower band = Median length - (2Average True Range)
Upper band = Median length + (2Average True Range)
3-Uptrend from Median indicator (screenshot required)
Median indicator is a trend revealing indicator which helps to show the direction of the movement of the market per time.
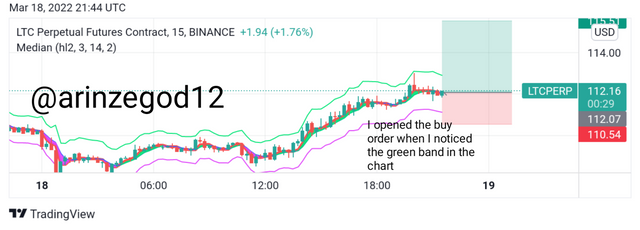
Using the Median indicator in detecting an uptrend, we check out for where the green band formed in the candlesticks and this shows us that it's an indication for an uptrend and this is a very good buy opportunity. So we place our buy order there and place our stop loss below that point to maintain a good risk management strategy and we take our profit at the point upwards where the purple bands show because it's a sign of reversal. The Screenshot is below
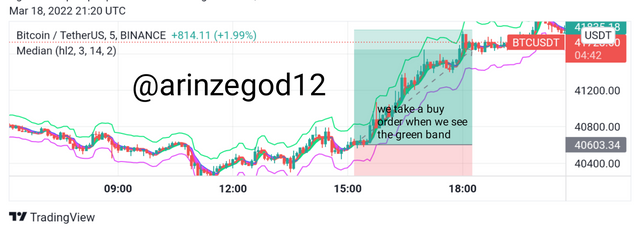
Source: Tradingview
4-Downtrend from Median Indicator (screenshot required)
Using the Median indicator in detecting a downtrend, we check out for where the purple band formed in the candlesticks and this shows us that it's an indication for a downtrend and this is a very good sell opportunity. So we place our sell order there and place our stop loss a little above that point to maintain a good risk management strategy and we take our profit at the point downwards where the green bands show because it's a sign of reversal. The Screenshot is below
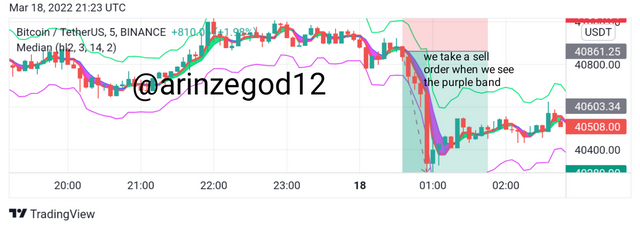
Source: Tradingview
5-Identifying fake Signals with Median indicator(screenshot required)
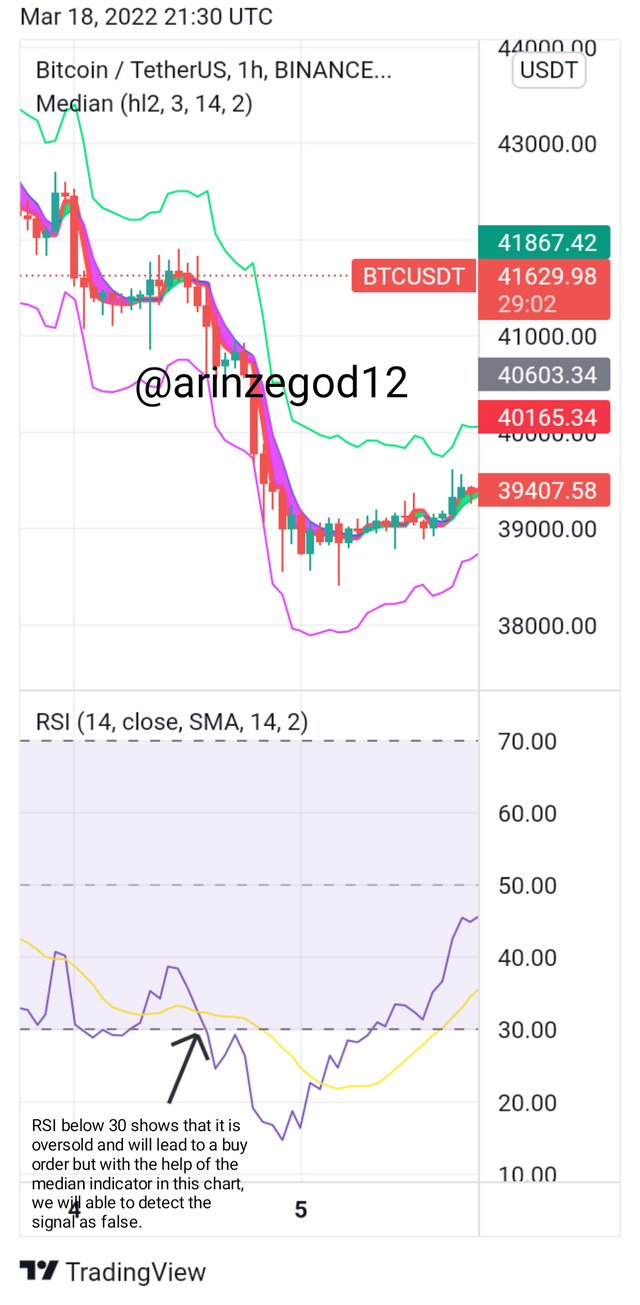
Due to the fact that this indicator is trend based, it can be used to detect fake signals from other indicators which are not trend based like the Relative Strength Index indicator.
RSI below 30 shows that it is oversold and will lead to a buy order but with the help of the median indicator in this chart, we will able to detect the signal as false.
The Screenshot below shows the false signal from RSI.
Source: Tradingview
6-Open two demo trades, long and short, with the help of a median indicator or combination that includes a median indicator (screenshot required)
For demo trade, I analyze LTCUSDT for the long trade using the median indicator. It showed sign for an uptrend in the chart displayed below.
Source: Tradingview
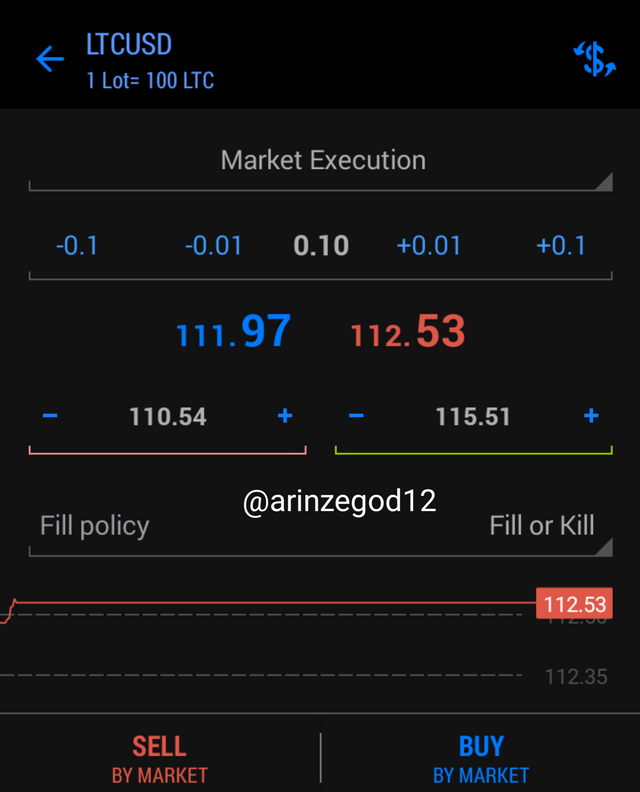
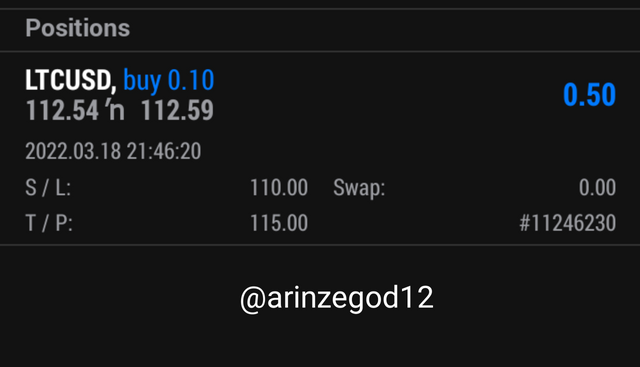
I took the trade in my demo account using meta trader 5 platform as shown below. the trade is in profit already
screenshot from meta trader 5 Application
screenshot from meta trader 5 Application
For the short trade, I analysed BTCUSDT using the median indicator which was showing purple band colour which is an indication for downtrend. The screenshots are as follows...
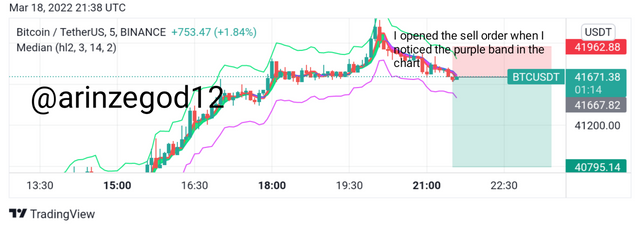
Source: Tradingview
I took the trade in my demo account using meta trader 5 platform as shown below. the trade is in loss.
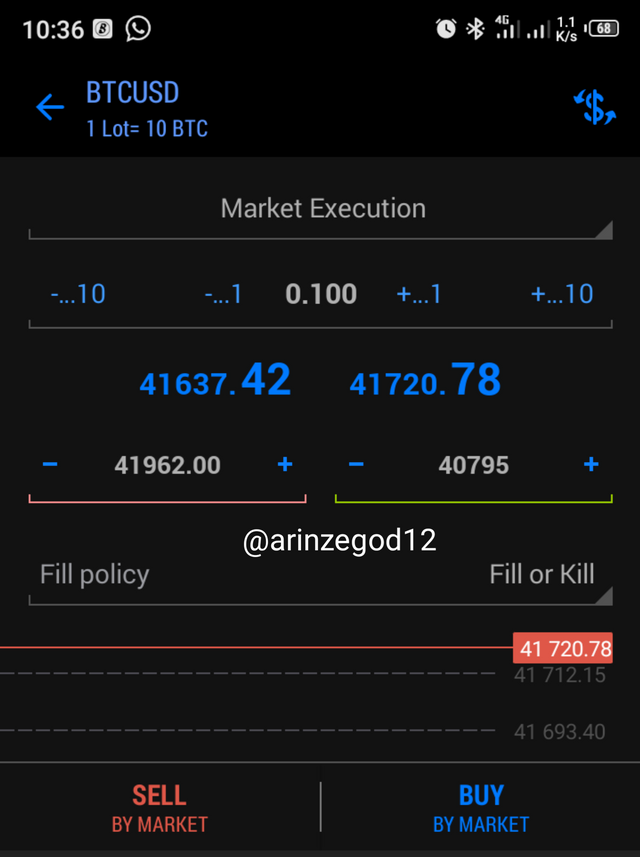
screenshot from meta trader 5 Application
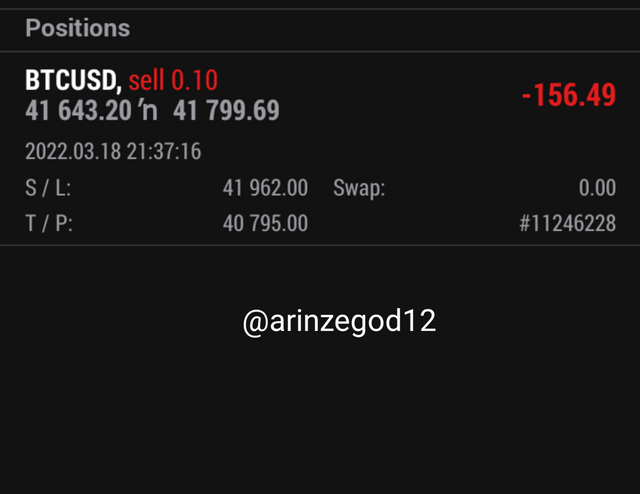
screenshot from meta trader 5 Application
Conclusion
I want to categorically thank prof @abdu.navi03 for these mind-blowing lecturers. I truly learned a lot and hope to put them into practice in the next Crypto Academy trading competition. I anticipate another great lecture next time.