Introduction
I want to welcome everyone to season six and week 2 of the Steemit Crypto Academy. Haven studied the topic, I wish to give my answers to the assignment given for the week. Have a nice read as you go through it.

1. Explain Your Understanding of Moving Average.
Moving Average is a type of Technical indicator used in making analyses in the Crypto Market. Moving Average is used to confirm the current trend and price movement in the market. It is one of the most widely used indicators in Crypto trading recognized by almost all trading platforms/applications and analysis platforms as well. Aside from being one of the most used, it has proven to be effective by thousands to millions of users across the globe. It helps traders to clear their biases and fear in confirmation of the direction of the price movement which gives them an edge on the right time to enter the market and when to exit as the need may be.
It helps to calculate the average price of a specified candlestick in the chart. Moving Average indicator also helps to emphasize the current trend of the market, helps to identify possible trend reversal, and helps to generate signals for either buying or selling in the Crypto market. It helps us to get an overview of the happenings in the market like the supply and demand between the whales and the Retailers in the market thereby helping in making the right financial decisions.
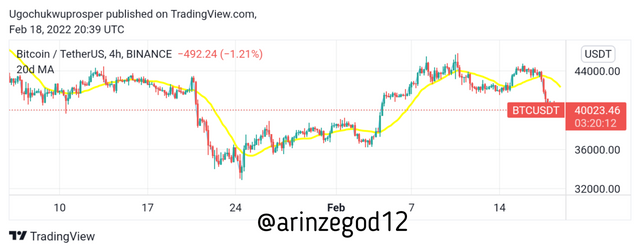
For example, if we use 20 days Moving Average, it calculates the average of the 20days and shows it in a single straight line as can be seen in the chart below. It's shows a BTCUSDT chart on a 4hrs time frame on a 20 ma indicator.
Source: Tradingview

2. What Are The Different Types of Moving Average? Differentiate Between Them.
The 3 most useful Moving averages based on their means of calculations are Simple Moving averages (SMA), Exponential Moving averages (EMA), and Weighted Moving averages (WMA).
SIMPLE MOVING AVERAGE:
This type of Moving Average helps to calculate the average of all the data in a unique line and helps the traders and investors to identify the real average price because of its equivalency in the price deliberation. Consequently, the Simple moving average indicator shifts ahead whenever a new candlestick is formed SMA can be used for long-term traders or holders in the crypto market. The Formula for calculating SMA is shown below:

Source: google
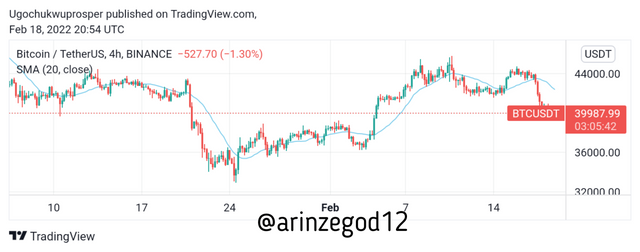
The picture below shows the representation of SMA in a chart
Source: Tradingview
EXPONENTIAL MOVING AVERAGE:
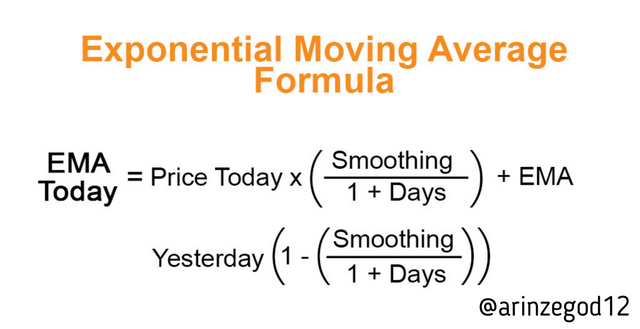
This type of moving average gives a more detailed forecast in price & trend reversals and quick price variations. It has a great similarity with the simple moving average because they both track the trend direction aside that EMA using a more sophisticated calculation. EMA is most important for short-term traders in the market. It's always ideal to combine both SMA and EMA to get a more profitable result.
The Formula for calculating EMA is shown below:
Source: google
The picture below shows the EMA in a chart
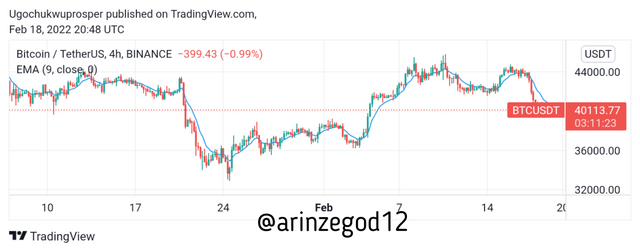
Source: Tradingview
WEIGHTED MOVING AVERAGE:
This type of moving average statistically gives bigger weight to the recent data while it gives smaller weight to a previous price point. The Weighted Moving Average times the price of each candle by a weighting component to focus on the most current price. Eventually, the total of the weights will equal 1 or 100%.
The Formula for calculating WMA is shown below:
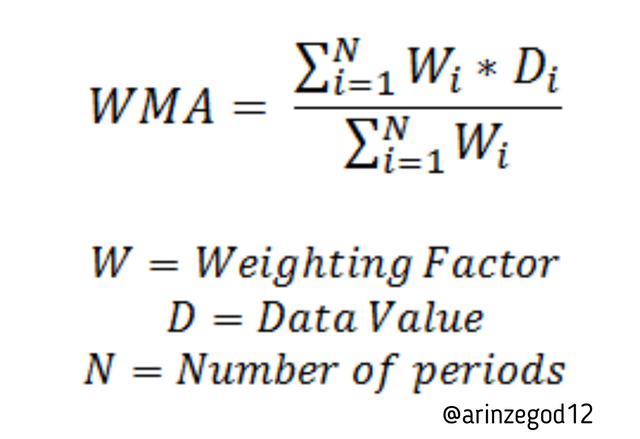
Source: google
Below is a picture representation of WMA in a chart
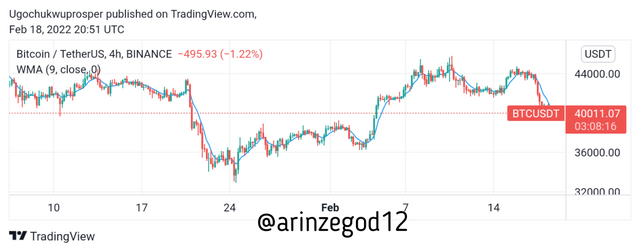
Source: Tradingview
Differences between SMA, EMA & WMA
SMA is used for long term trade while EMA is used for short term trade while WMA is used for trading more recent data
SMA is more valid when higher values are used while EMA is more valid when lower values are used while WMA is more valid for both higher and lower values.
SMA shows the average price over a long period while EMA shows the average over a recent price while WMA shows preference over a reduced recent price.
SMA reacts slowly with price movement while EMA reacts faster with price movement while WMA is the fastest no matter the small price movement.

3. Identify Entry and Exit Points Using Moving Average. (Demonstrate with Screenshots)
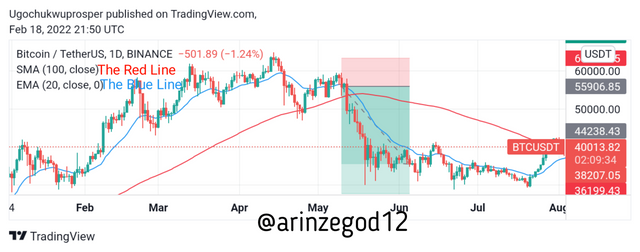
The Moving average is an indicator that helps the trader in identifying a nice entry and exit point in the market due to it's ability to reveal the support and resistance level of a crypto chart. We open an entry into the market when the price draws closer to the moving average in a crypto chart.
To illustrate this, we are going to be using both the SMA which gives the market direction and EMA which gives the entry and exit point to identify the entry and exit point in a buy and sell order in the market.
Bullish Entry and Exit point
I applied the 100days SMA against the 20days EMA. In the chart we can clearly see the 100 SMA giving the trend direction which was a bullish trend while the 20 EMA gave us our entry point into the trade which ended in profits.
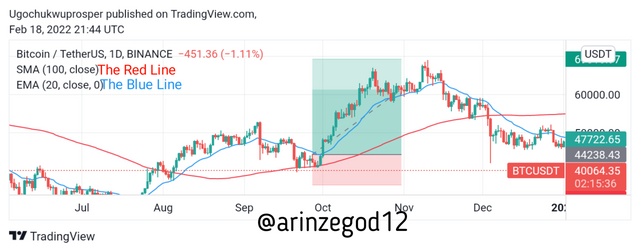
Source: Tradingview
Bearish Entry and Exit Point
I applied the 100days SMA against the 20days EMA. In the chart we can clearly see the 100 SMA giving the trend direction which was a bearish trend while the 20 EMA gave us our entry point into the trade which ended in profits.
Source: Tradingview

4. What do you understand by Crossover? Explain in Your Own Words.
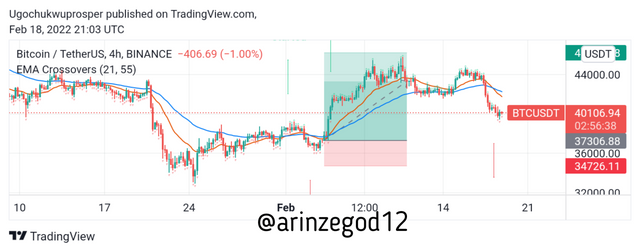
The Moving Average Crossover is a system that combines two moving averages when making a financial decision in trading. For example, you can incorporate a 20days exponential moving average with a 50days exponential moving average. The smaller moving average (in this case, 21 days) can be called the faster-moving average because it moves more rapidly. The higher moving average (in this case 55 day moving average) can be called the slower moving average. Because the smaller moving average employs a lesser amount of data points to calculate the average, it manages to be more closely linked to the recent market price and, as a result, responds to shifts in price more rapidly. A higher moving average needs bigger data points to evaluate and it tends to be distant away from the current market price. As a result, the responses are more modest. We can see all this in the BTCUSDT chart below.
Rules guiding moving average crossover
1.Take a buy order when the short-term moving average is greater than the long-term moving average.
2.Exit the buy position when the short-term moving average fits less than the long-term moving average.
To demonstrate the MA crossover system, we will be using the BTCUSDT price chart with the 21days EMA and 55days EMA as the moving average which is a mid term trade that can last for few weeks as the case may be.
Source: Tradingview

5. Explain The Limitations of Moving averages.
As it is always said that every good thing always has a bad side attached to it. Haven talked about the benefits and importance of moving average in making trade decisions, I bring to you the limitations which I have noticed from the indicator.
Moving average does not work in a ranging or sideways market thereby causing a trader to lose out on making some profits out of the market
Moving average can not be reliable at some point because it only calculates the range of which it is applied thereby leaving out the previous data.
Moving average is a sluggish indicator therefore traders can lose out on trading opportunities.
Signals from the moving average indicator can be wrong if it's not adjusted as the price continues moving.

Conclusion
Thanks, prof @shemul21 for these wonderful lectures. Haven went through the class and learned about the advantage and disadvantages of the moving average, I believe that my trading skill will be greatly upgraded to be the best. I anticipate your next lecture, Sir.
@shemul21 please I will like this assignment to be reviewed properly for clarity sake and a detailed analysis of what went wrong because I have gone through other assignments that were marked and some were poor yet they graded them beautifully. So @shemul21 please review my assignment yourself since it was given by you
Downvoting a post can decrease pending rewards and make it less visible. Common reasons:
Submit