1. Explain your understanding of price action.
Crypto Trading is the act of buying and selling Crypto assets in the Crypto market and it is controlled by the continuous price movement of the asset in the chart. So for you to be a successful trader, it means that you have a proper understanding of the various movements made by the price through understanding the price action, candlestick pattern, fundamental analysis, technical analysis, and multi-timeframe analysis. A good combination of all these principles leads to profitable trading and good risk management skill for the trader.
So to explain more on price action, it means a trading strategy that involves the utilization of chart patterns, the trading volume of the asset, some technical analysis indicators, the concept of support and resistance level, and market structure/cycle in making the right and profitable trading decision. So a price action trader believes that everything he needs to make the right trading decision is available for him on the price chart pattern which is always believed to consist of the emotions and psychology of the traders in the market. The trader believes that he can through the historic data of the price chart predict the future price because it is believed that everything that occurred previously will certainly happen again for example when the trader identifies a double bottom pattern, it means that the price will certainly make a bullish trend upwards which have always been there previously. The price action trading strategy is very good because it reveals to us a good entry point and exit point thereby ensuring a good risk management strategy for protecting our trading capital.
Furthermore, price action should also depend on fundamental analysis as the price of an asset can be moved rigorously by high-impact news. So it is beneficial for the trader to study his chart pattern in conjunction with looking out for fundamental news to back it up or against his finding to make a profitable trading decision.
A good example of a trading decision with price action is seen in the chart below. There is a clear double top identified in the chart which probably shows that there is going to be a clear downtrend in the BTCUSDT daily time frame which played out in our chart. Our stop loss is above our entry point at the double top resistance level in the chart.

2. What is the importance of price action? Will, you chose any other form of technical analysis apart from price action? Give reasons for your answer.
Price action trading pattern is a very important technical analysis tool and I prefer it above other tools used in analyzing the chart because of the below reasons which also serve as their importance in the Crypto market.
1. Price Action helps in a proper understanding of the Crypto market structure :
Though it is very difficult to predict the future price of the market, price action brings it to a simplified form for the trader. With price action you can identify the current trend of the market, that is whether the market is in an uptrend or a downtrend or the market is in a ranging or sideways market. With price action, you can also identify and forecast trend reversal after you must have known the current trend. Price action also helps the trader to know the support and resistance level which are also the spot for supply and demand which reveals the state of the market and the anticipated price direction and the highest limit it can move to that direction. This is of great importance to the Crypto trader.
2. Price action helps to reduce false signals and noise in the market :
Being that the price in the market can be manipulated by the whales(market movers) against the intended trend, price action helps a trader to avoid things like this. Some indicators also used by the traders in the market have proved ineffective due to some being sluggish in action while some moving faster than the intended price and this can lead to the generation of false signals which can lead to loss of funds in the market. Price action strategy helps to avoid these false signals by giving the accurate price movement and direction in the market without having any lagging or leading involved in them. Also during the ranging market, the price action helps to filter noise in the market by using the multi-timeframe analysis which means analyzing the market of an asset using different time frames for proper understanding of the movement in the market.
3. Price action reflects a traders emotion and psychology :
Price action helps in showing the psychology and emotions of different traders in the market and this is seen by the pattern in which the price forms in the market. This will help us in predicting the next movement of the price in the chart thereby giving us an insight on the direction to place our trade to maximize enough profit out of the market.

3. Explain the Japanese candlestick chart and its importance in technical analysis. Would you prefer any other technical chart apart from the candlestick chart?
Japanese Candlestick chart is a chart pattern used in analyzing before making trading decisions. It is a more refined visual representation of the price of crypto assets using candlesticks which are of differing types. The candlestick chart consists of green and red candles or black and white candles depending on the setting of the platform you are using as a trader. The green candlestick always symbolizes the uptrend or buy while the red candlestick indicates the downtrend or sell. The candlestick chart is mostly used by skilled and experienced traders because it shows both the high, low, Open, and close price of the asset. When we have a bullish candlestick, it means that the price closed above the price when it opened in beginning of that day and having a bearish candlestick is the opposite.
The pictorial representation of a Japanese candlestick can be seen below.
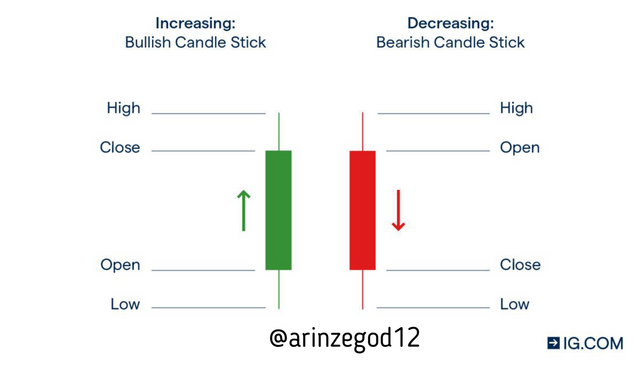
Source: google
It is truly a comprehensive chart pattern because every available candlestick reveals and characterizes something unique about the movement of the price and it can as well show reversal from the current direction of the market. Putting Take profit and stop loss orders is easier and more precise in candlestick pattern as the candles represent prices at different levels.
Candlestick chart pattern is a very important tool used in the price action strategy especially when they show the level of support and resistance.
For example, the hanging man candlestick pattern forming in the resistance level signifies a trend reversal from a bullish trend to a bearish trend which is a downtrend. So studying and understanding candlestick pattern gives the price action trader an edge over the market in making trading decisions.
Importance of Japanese candlestick in Technical analysis.
- Japanese candlestick brings an accurate representation of the Psychological mood of the traders in the market.
- Japanese candlestick helps to reveal the force of supply and demand in the market thereby showing the support and resistance levels in the chart.
- Japanese candlestick chart helps in applying proper risk management in the market

4. What do you understand by multi-timeframe analysis? State the importance of multi-timeframe analysis.
Multi time frame analysis is a very important price action trading strategy. It involves making analysis on a particular Crypto asset on different time frames in order to filter off the noise and to properly understand the direction of the market and to know when to enter the market and when to exit as well.
In multi time frame analysis, higher time frame are used to identify the current direction of the market while the lower time frames are used to get a good entry and exit point in the chart. For the multi time frame analysis, a swing trader uses the monthly, weekly and daily time frame to make his trade set up and he uses his 4hrs, 2hrs and 1hr chart to make trade decisions like entry and exit while a scalper uses 1hr, 30mins and 15mins for his set ups and uses 5mins, 3mins and 1mins for trade execution process.
Importance of Multi time Frame Analysis
- It helps to filter off the noise in the market by giving us a glimpse of the current market trend and direction which helps us in making further decisions in the market.
- It helps the trader to apply a good risk management strategy by helping us get a good entry, tight stop loss and gainful take profit in the market.
- It helps in building confidence and trust in the trader thereby giving him the right trading psychology.
Graphical representation of this importance will be showed in question no. 5

5. With the aid of a crypto chart, explain how we can get a better entry position and tight stop loss using multi-timeframe analysis. You can use any timeframe of your choice.
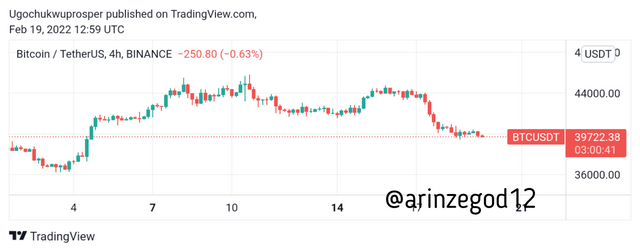
Firstly we have to start by cancelling out the noise in the chart and getting the current market direction before we start making our trades.
Source: Tradingview
If we look at the 4hr Time frame chart of BTCUSDT, we will notice that there is no clear pattern showing us whether there is an uptrend or downtrend and for us to cancel out the noise we have to go to a higher time frame to give us a better understanding of the current trend.
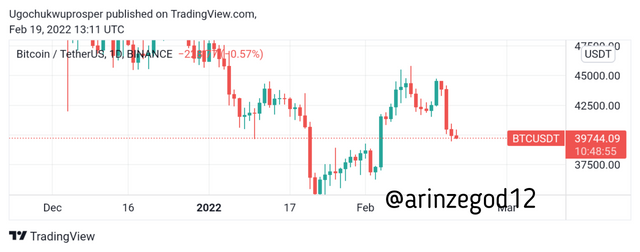
So we move to a daily time frame.
Source: Tradingview
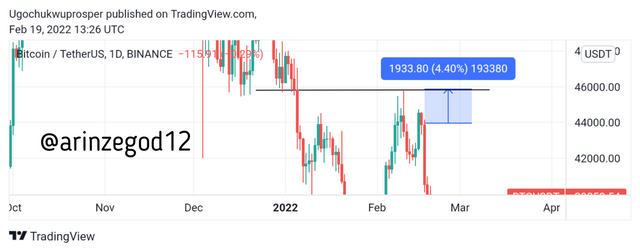
So in the daily time frame, the price becomes very clear as it gives us a direction of the price. We can clearly see a double top pattern which indicates a bearish trend reversal after the bearish hanging man candlestick formed in the chart. With this noise cancelling in the chart, we then have to move to getting our entry and exit point in the chart.
Source: Tradingview
So if we take the sell order from the daily time frame, after the hanging man bearish candle, our stop loss will be 193 point which is quite large and not tight, so we have to move down to 1hr time frame to get a better entry and exit point.
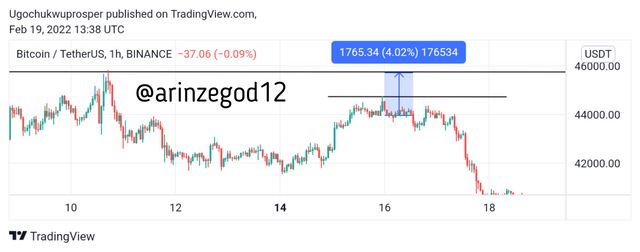
Source: Tradingview
So if we move down to 1hr time frame, we will see the stop loss reduced to 61point, therefore we will have to move down to 15mins time frame to get a tighter stop loss.
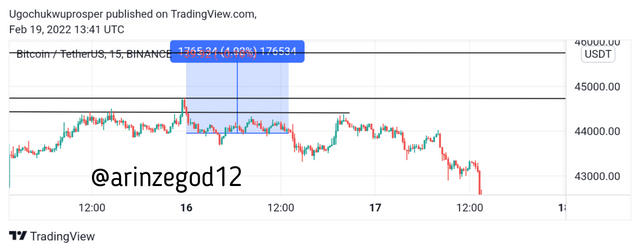
Source: Tradingview
Then As we moved down to the 15mins timeframe we found out that we had a tighter stop-loss of 10point.
So we can see practically that in multitime frame analysis we the entry and exit point are refined better as we move down to lower time frames.

6. Carry out a multi-timeframe analysis on any crypto pair identifying support and resistance levels. Execute a buy or sell order using any demo account. (Explain your entry and exit strategies. Also, show proof of transaction).
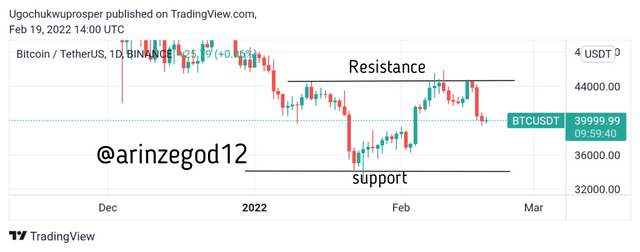
I will be analyzing the BTCUSDT chart.
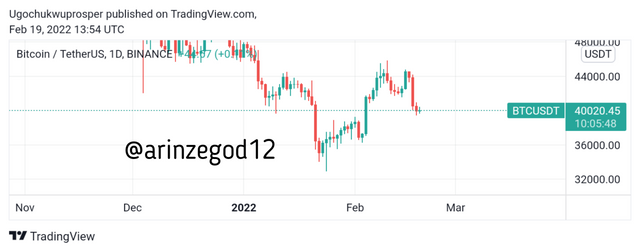
In the Daily time frame chart I noticed a double top pattern in the chart and this indicates a bearish trend which has already began already but the price has to get to the nearest support as the final take profit before it bounces upward.
Source: Tradingview
So I will get to lower time frame in order to get my entry and exit point before placing my trade in my demo account. I will be using the 15mins timeframe.
Source: Tradingview
I placed my trade immediately after the inverted hammer candlestick pattern formed which indicates a bearish trend. My stop loss is on the resistance level formed by the head of the wick of the inverted hammer candlestick while the take profit is on the nearest support formed on the candlestick on the 15mins time frame.
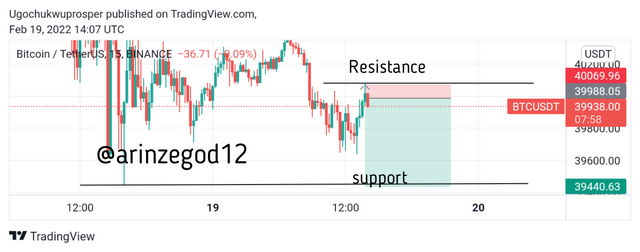
Source: Tradingview
I have taken the trade in my demo account in metatrader 5 trading app and below is the screenshot of the trade execution and current position where I am currently in a loss.
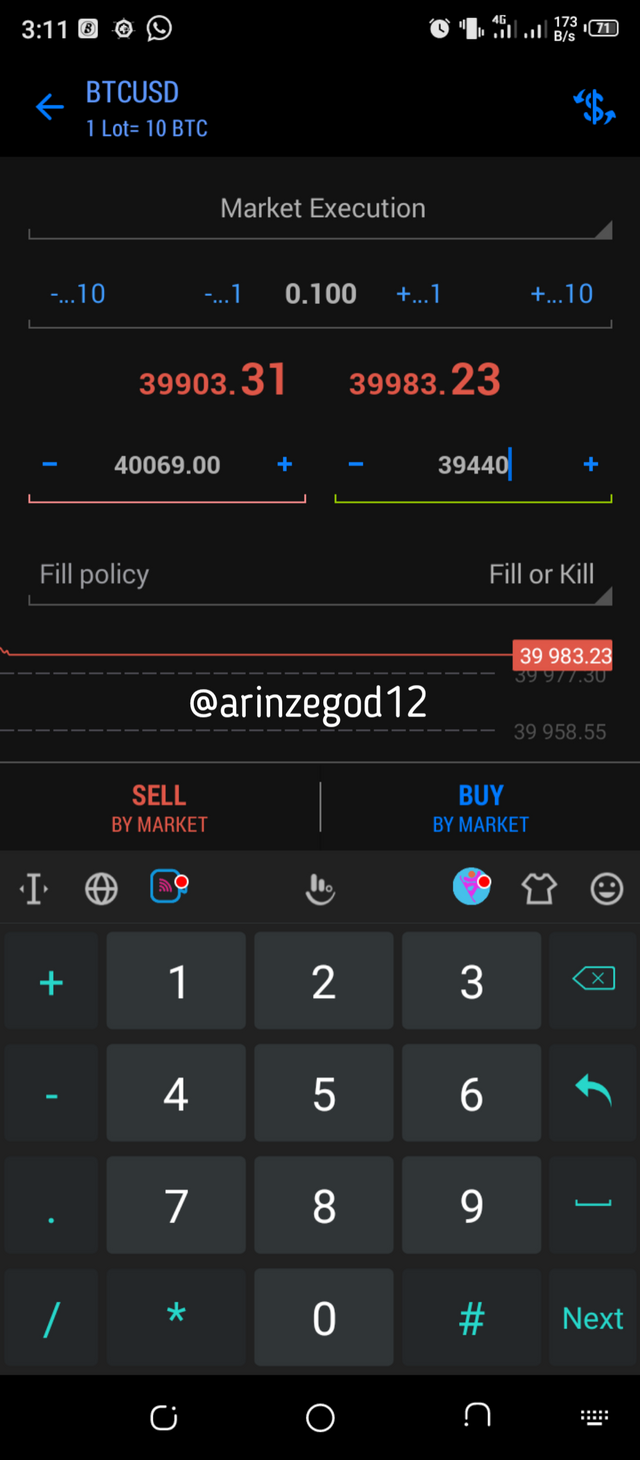
The source of this screenshot is mt5 trading application
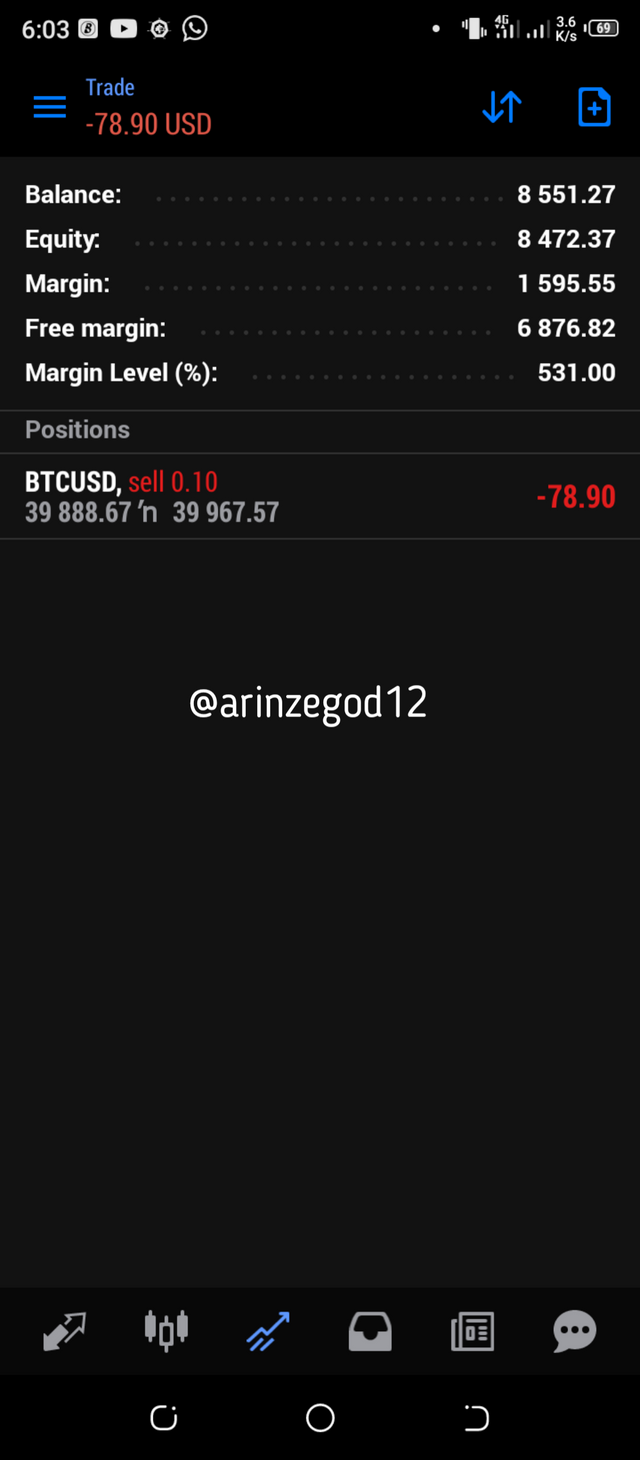
The source of this screenshot is mt5 trading application

Conclusion
Thanks so much prof @reminiscence01 for this wonderful lecture on price action. I must say that I have been imparted from the banks of your knowledge in no small way. I believe that my trading game will improve greatly with this newly acquired skill in trading.