Introduction
Introduction
It's being indeed a great time of break at the Steemit Crypto Academy. Am so glad that we are back to begin the new season 6. I hope to improve my trading skill from the lessons that will be taught in this season.
1. Define Line charts in your own words and Identify the uses of Line charts.
Line Charts are simplified representation of the interaction between price movement and time in the Crypto market using lines.
This is a very important tool used for trading and maximizing profit in the Crypto market. Most beginners in the trading games always prefers using the line Chart because of it's simplicity in identifying an assets closing price in relation to time. It's well known for filtering the noise in the market which is always seen in candlestick pattern which needs a lot of complications and properties. The line Chart helps traders to identify and monitor market trends and trend reversal so that they can know the appropriate time to place there buy and sell orders.
Now am going to give a clear and detailed illustration on how to change from candlestick to line Chart on tradingview using BTC/USDT pair.
Open the default page of your Tradeview, then it will always come with candlestick as the default
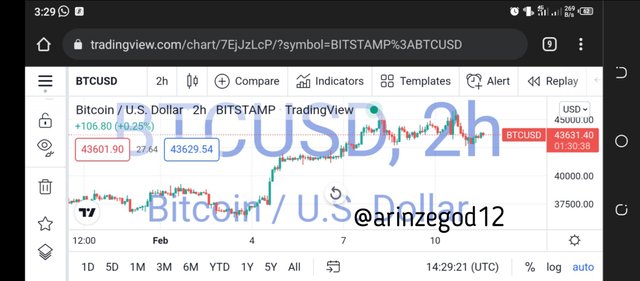
Source: Tradingview
Then click on the candle button on the top right corner and change it to Line
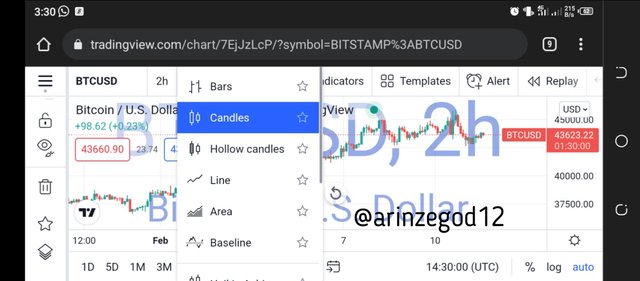
Source: Tradingview
The line Chart appears as shown below
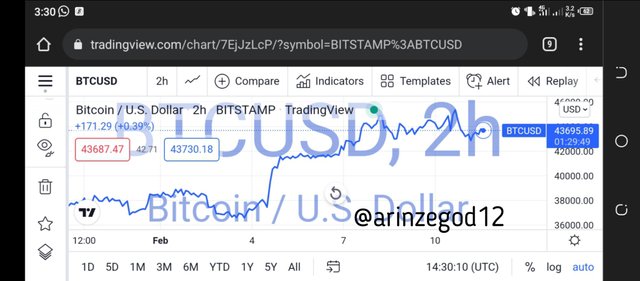
Source: Tradingview
Uses of Line Chart
It helps Traders to identify the current trend of the market.
It gives a simplified view of the market to beginners and help to filter unnecessary distractions in the market.
It helps traders to maximize profit and minimize loss from the market after proper understanding.
It helps traders to predict the possible move in the market and to know when to place there buy and sell order.
2. How to Identify Support and Resistance levels using Line Charts (Demonstrate with screenshots)
Support and Resistance are the building block of Technical analysis. Being a successful traders is hedged on your understanding of the support and resistance in the chart because they give you basis for market structure and entry.
Support Level:
This is the level where the purchasing strength or demand is too intense that the price of the coin stops selling. It occurs when buyers suddenly decide to take advantage of the low price of an asset.
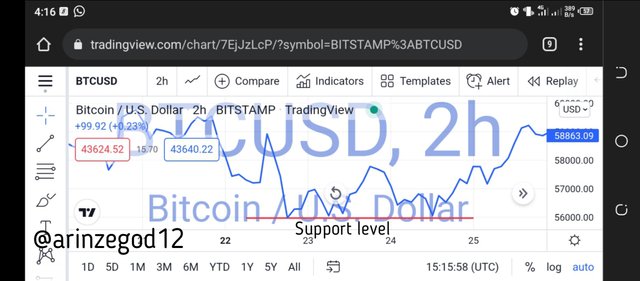
Source: Tradingview
Resistance Level:
This is the level where the Selling strength or Supply become too intense that the price of the coin stops buying. It occurs when seller suddenly decide to take advantage of the high price of an asset and therefore take profit from the market.
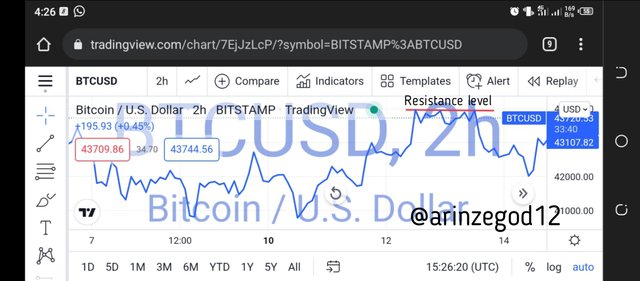
Source: Tradingview
3. Differentiate between line charts and Candlestick charts.( Demonstrate with screenshots)
Line Chart
This is a simple and Concise representation of price in Crypto market using lines. It is used by beginners in the market to filter distractions and noise from the market and it always shows the closing price of the asset. More about it has been explained in number 1 question.
Picture Screenshot is below.

Source: Tradingview
Candlestick chart
This is a more sophisticated graphical representation of the price on an assets using candlesticks which are of varying types. The candlestick chart is made up of green and red candles or black and white candles depending on the setting of the tool. The green always signifies the uptrend or buy while the red signifies the downtrend or sell. The candlestick chart is mostly used by professional traders because it shows both open, close, high and low. It is truly a complicated pattern as every single candle has what it signifies and represents in the movement of the price and it can as well utter the direction of the market. Ascertaining Take profit and stop loss is easier and more precise in candlestick pattern as the candles represents prices.
The Pictoral representation can be seen below.

Source: Tradingview
Differences between line charts and candlestick chart
Line Chart only show asset closing price while candlestick chart shows both opening and closing price.
Line charts is mostly used by beginners and amateurs while candlestick chart is used by professional and Veterans
Line Chart is a simple type of Chart while candlestick chart is a bogus and complex type of Chart
Line Chart does not estimate the level of volatility while candlestick chart estimates the level of volatility.
Line chart is best for higher time frame analysis only while candlestick chart is good for both lower and higher time frame analysis.
4. Explain the other Suitable indicators that can be used with Line charts.(Demonstrate with screenshots)
I will be talking about the Moving Average indicator.
In trading, we combine our chart with indicators in order to confirm our analysis further before placing a trade. Moving Average is an indicator that helps us to confirm the direction of the market movement. It provides support during an uptrend and resistance during a downtrend. It's also indicates the strength of the current trend.
So in activating the Moving Average in the Line chart, you check out for the proximity of the price to the Average which indicates weakness of the current trend and there's going to be a break in the trend.
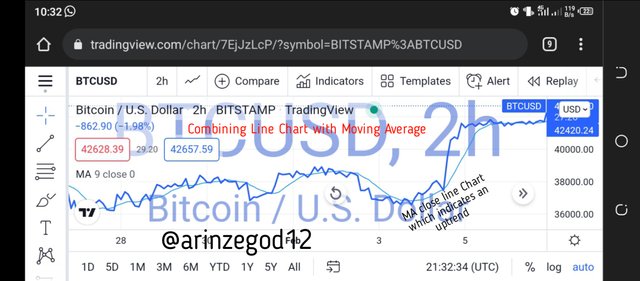
Source: Tradingview
5. Prove your Understanding of Bullish and Bearish Trading opportunities using Line charts. (Demonstrate with screenshots)
Bearish Trading
This is a type of trading that involves a downtrend in the price of an asset in the Crypto market. A wise and profitable trader should have made his analysis and will sell the asset at the higher price before it falls downwards. So for the course of the line Chart, we will be trading uptrend using the strategy of the descending triangle. The descending triangle involves the formation of Support line and lower highs in the line Chart which leads to a break out from the support to the downward direction signify the bearish trading.
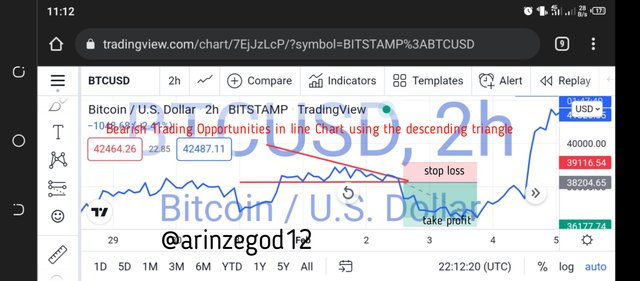
Source: Tradingview
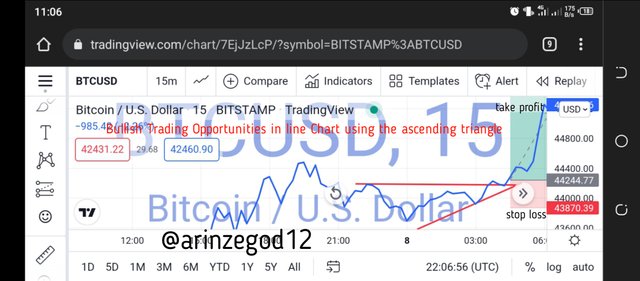
Bullish Trading
This is a type of trading that involves an uptrend in the price of an asset in the Crypto market. A wise and profitable trader should have made his analysis and will buy the asset at the lower price before it shoots upwards. So for the course of the line Chart, we will be trading downtrend using the strategy of the ascending triangle. The ascending triangle involves the formation of resistance line and higher low in the line Chart which leads to a break out from the support to the upward direction signify the bullish trading.
Source: Tradingview
6. Investigate the Advantages and Disadvantages of Line charts according to your Knowledge.
Advantage of Line Chart
It helps beginners to predict price movement easily
It helps to easily identify support and resistance which is a prerequisite for profitable Crypto trading
It helps in filtering the noise in the market thereby making the trader focused on making profit from the market.
Disadvantage of Line Chart
It does not give full details concerning the price movement and therefore can lead to loss of fund
It does not allow for proper fixing and calculation of Stop loss and Take Profit which will limit proper risk management.
Professional traders does not use it because it does not show all the required information concerning the price.
Conclusion
Conclusion
The concept of line Chart trading is indeed a good one which every trader should master as it can be combined with candlestick chart to provide a more accurate and reliable information concerning the Crypto currency market. I really learnt a lot and I hope to put them into practice in my next trade.
Thanks prof @dilchamo for the wonderful lecture.