
1.- Explain in your own words what you mean by Fibonacci retracement. Show an example with a screenshot.
Fibonacci Retracement is a technical analysis tool used to detect the extent of price pullback or retractement when it's moving in a current market trend. It can either be in an uptrend or a downtrend. This is a very important tool for maximizing profit in the Crypto market since it gives you an idea of when to enter or re-enter the trade if it missed out in the initial move. Fibonacci Retracement is made up of horizontal lines which represent support and resistance at different levels in the chart.
This trading analyst tool makes use of some specific percentages based on the study carried out by the developers and they include 23.6%, 38.2% & 61.8% as the major & famous ones while 50% & 78.6% are also initiated as well.
How to Apply Fibonacci Retracement on the Chart
I will be using tradingview platform to show this on the BTCUSDT Chart. It's worthy of note that the most important needs in this technical analysis tool are the point of the beginning of the trend and the end of the trend.
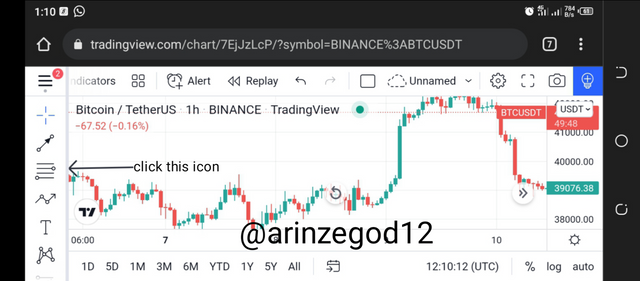
Click on the point where the arrow is pointing in the below screenshot.
Source: Tradingview
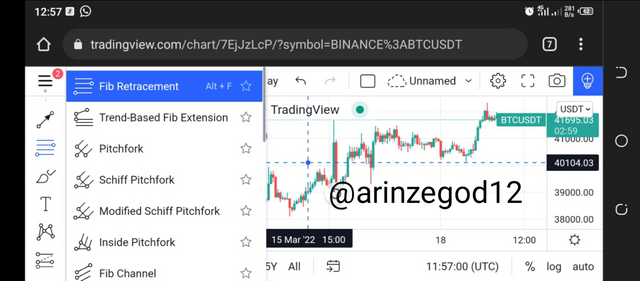
Then click on the pop-up button which shows 'Fib Retractment'
Source: Tradingview
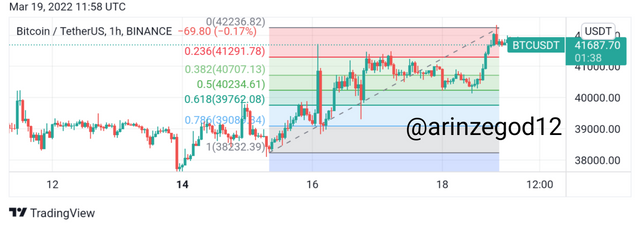
Then if you are analyzing an uptrend, you drag the Fibonacci from the beginning of the uptrend to the end of the uptrend and you dragged the other side of it to any desired point you wish.
Source: Tradingview
2.- Explain in your own words what you mean by the Fibonacci extension. Show an example with a screenshot.
Fibonacci Extension is a technical analysis tool used to detect the extent to which the current trend in a market can move after a pullback or retracement occurs in the market. It applies to both uptrend and downtrend. This is a very important tool for maximizing profit in the Crypto market since it gives you an idea of when to enter or re-enter the trade if it missed out in the initial move. Fibonacci Extension is made up of horizontal lines which represent support and resistance at different levels in the chart.
This trading analyst tool makes use of some specific percentages based on the study carried out by the developers and they include 23.6%, 38.2% & 61.8% as the major & famous ones while 50% & 78.6% are also initiated as well.
How to Apply Fibonacci Retracement on the Chart
I will be using tradingview platform to show this on the BTCUSDT Chart. It's worthy of note that the most important needs in this technical analysis tool are the point of the beginning of the trend, the end of the trend, and the end of the pullback or retracement.
Click on the point where the arrow is pointing in the below screenshot.

Source: Tradingview
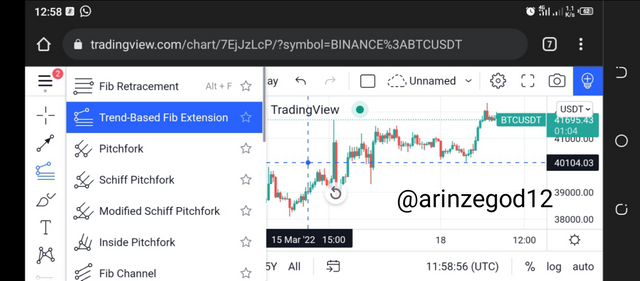
Then click on the pop-up button which shows 'Trend Based Fib Extension'
Source: Tradingview
Then if you are analyzing an uptrend, you drag the Fibonacci from the end of the uptrend to the end of the retracement and you dragged the other side of it to any desired point you wish.
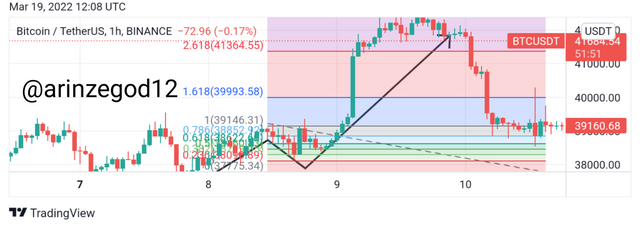
Source: Tradingview
3.- Perform the calculation of the Fibonacci retracement, for the levels of: 0.618 and 0.236. Pick a crypto pair of your choice. Show a screenshot and explain the calculation you made.
The Formula used for this calculation is
R1 = C + [(1 - % Retrace1/100) * (D - C)]
C = First cost of the price where the Fib Retracement starts.
D = Last value of the price where the Fib Retracement stops.
% Retrace 1 = 23.6%
% Retrace 2 = 38.2%
% Retrace 3 = 50%
% Retrace 4 = 61.8%
% Retrace 5 = 78.6%
So I used FTMUSDT Crypto pair.
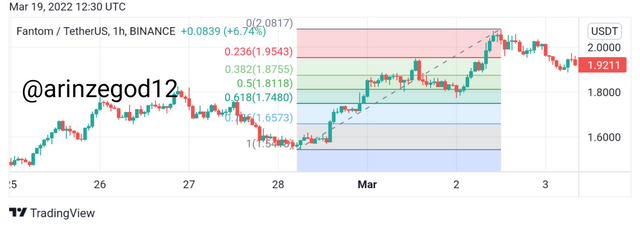
Source: Tradingview
So in using the formula above.
C = 1.5418
D = 2.0817
R1 = C + [(1 - 0.236) * (D – C)]
So R1 = 1.5418 + [(1 - 0.236) * (2.0817-1.5418)]
R1 = 1.5418 + [(0.764) * (0.5399)]
R1 = 1.5418 + 0.4124836
R1 = 1.9542836 USDT
R4 = C + [(1 - 0.618) * (D – C)]
So R4 = 1.5418 + [(1 - 0.618) * (2.0817-1.5418)]
R4 = 1.5418 + [(0.382) * (0.5399)]
R4 = 1.5418 + 0.2062418
R4 = 1.7480418 USDT
4.- On a Live account, trade using the Fibonacci retracement, screenshots are required.
I used Fibonacci Retractment to analyze the Crypto pair FTMUSDT and I executed the trade in my Bybit Exchange. The screenshot of every process is shown below.
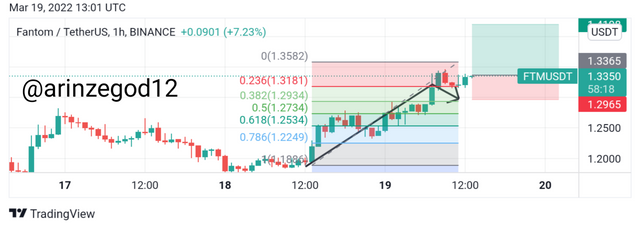
Source: Tradingview
I took the buy trade in my bybit Exchange and it's currently in a small loss.
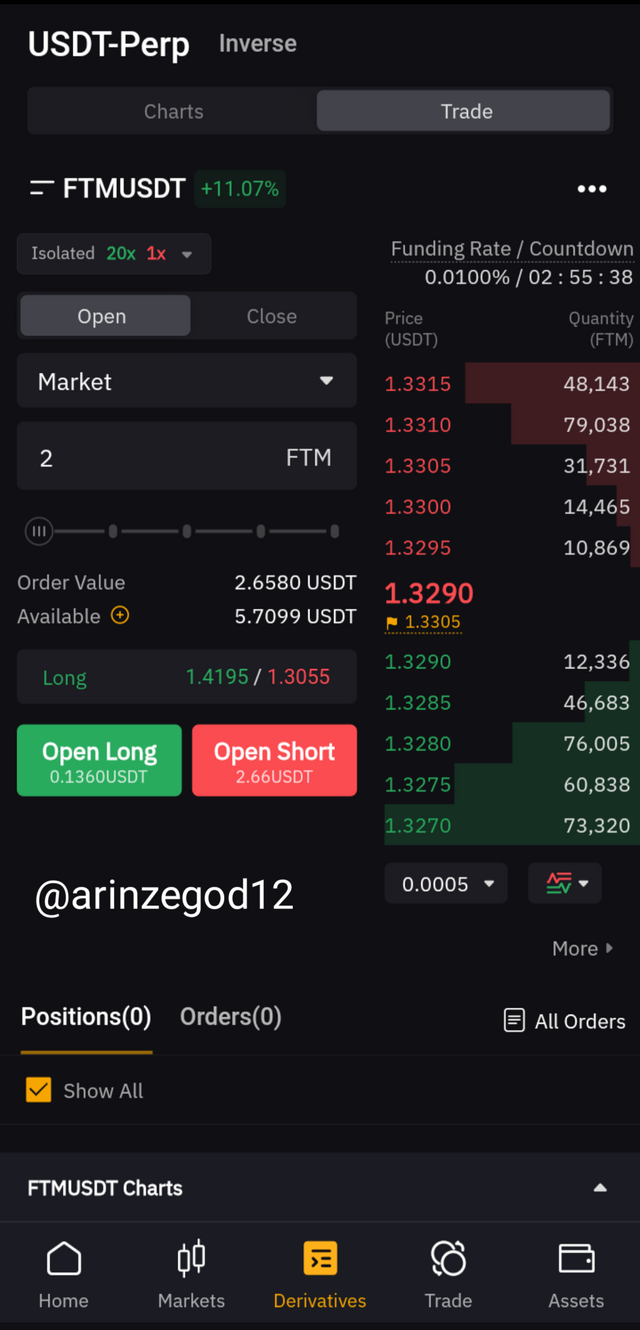
Source: Bybit
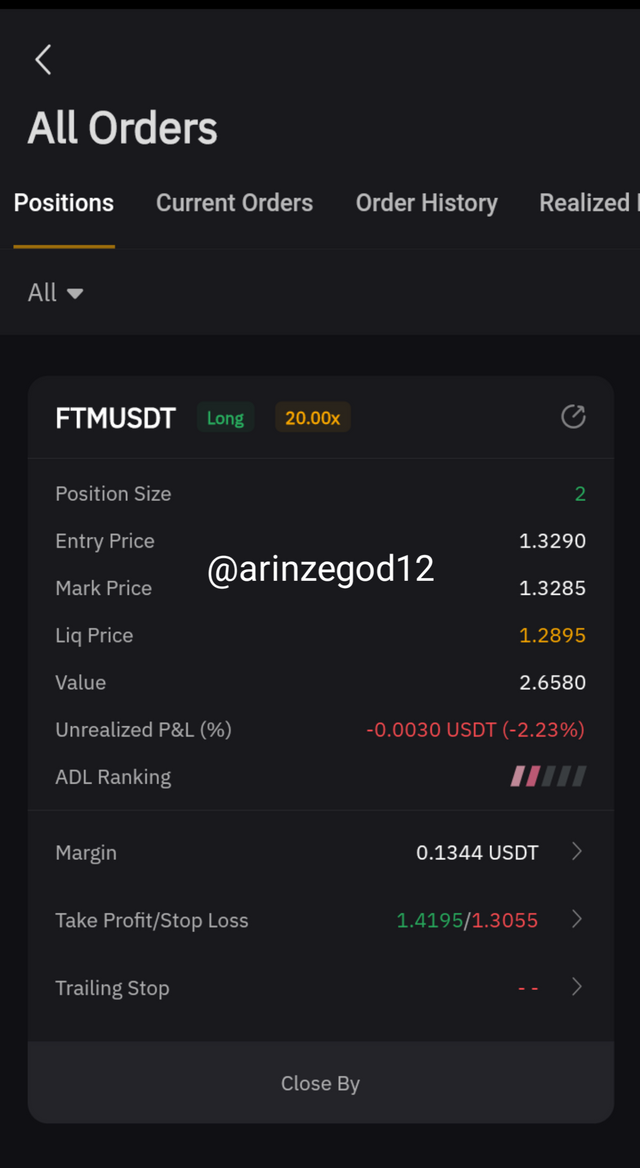
Source: Bybit
5.- On a Demo account, make a trade operation using the Fibonacci extension. Screenshots are required.
I used Fibonacci Extension to analyze the Crypto pair MATICUSDT and I executed my demo trade in my Meta trader 5 application. The screenshot is shown below.
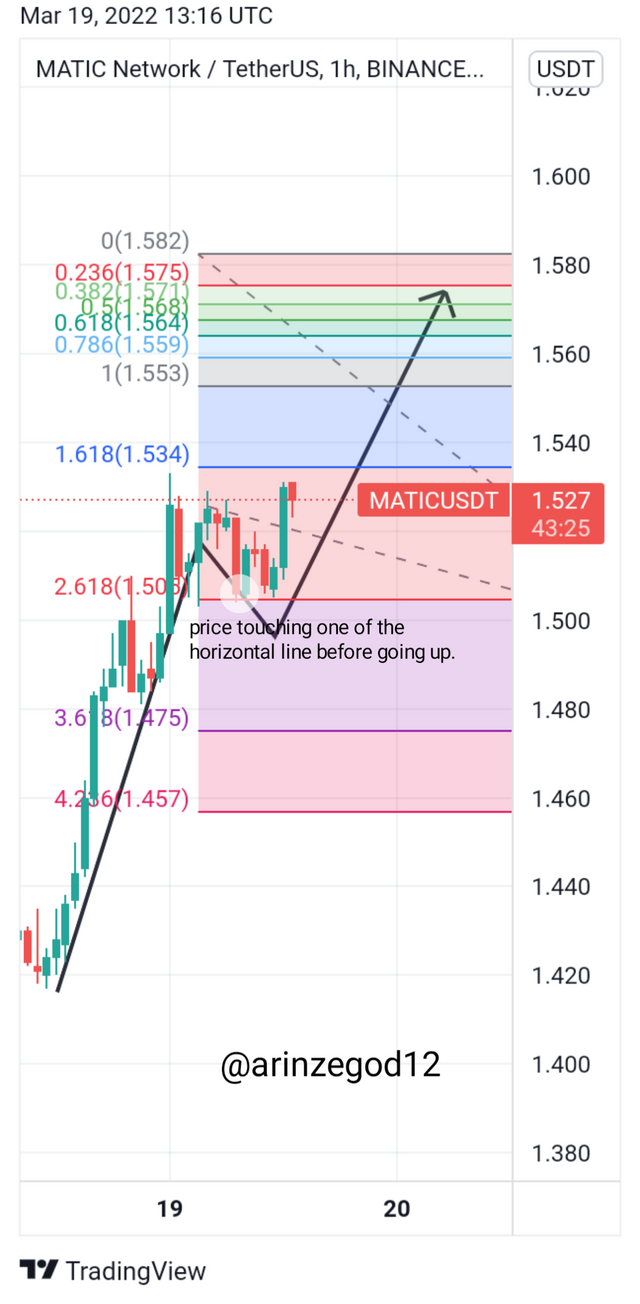
Source: Tradingview
I executed the trade in my mt5 Application and it's currently in a loss
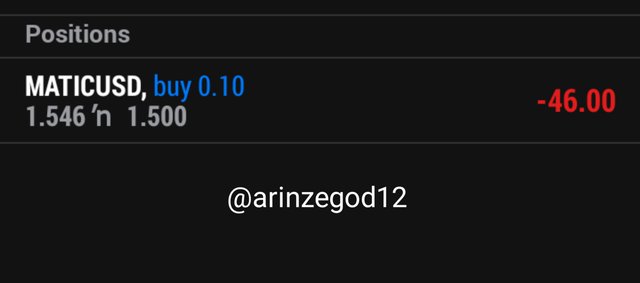
Screenshot from meta trader 5 Application
Conclusion
I want to especially thank prof @pelon53 for this wonderful lecture. I have learned a lot about this Fibonacci tool and I will love to put my knowledge to practice in the next trading competition.