1. Explain your Understanding of the Dow Jones Theory. Do you think Dow Jones Theory is Important in technical analysis?
Dow Jones Theory is a theory of trends postulated by Charles H. Dow in 1897. It states that the price movement in the market is made up of the accumulation and distribution phase which gives rise to either the bearish, bullish, or sideways market in the chart. DOW believes that every information needed in the market can be easily gotten through analysis and understanding the current market phase and trend as well. He also believed that there is a great relationship between volume and price in determining the direction of the movement of the market.
I think that the DOW theory is very important in technical analysis because the first and most important thing to do in the chart is to find the current trend and phase in which the market is going and this is the basis of DOW theory. So you can't be talking about technical analysis without DOW theory. I will say that they walk hand in hand to ensure proper and adequate understanding of the market by the trader to maximize enough profit from the market.
2. In your own words, explain the psychology behind the Accumulation and Distribution phases of the market. (Screenshots required).
The Psychology behind the Accumulation phase of the Market
The accumulation phase of the market is the phase is the appropriate time to buy in the market as the price is ranging and it leads to an uptrend once it breaks out of the accumulation phase. The Psychology behind this phase is that the whales in the market buy up the market leading to an uptrend due to too much demand and this will cause retail traders to FOMO into the market and it will get to a phase called the reaccumulation phase where the whales take partial profit and leave the retail traders to sell in the loss. The retail traders immediately rush to sell the market thinking that it's a trend reversal not knowing that it's a good opportunity to buy for those that missed the initial entry. Once price breaks out of the reaccumulation phase it continues and completes the uptrend movement it is doing.
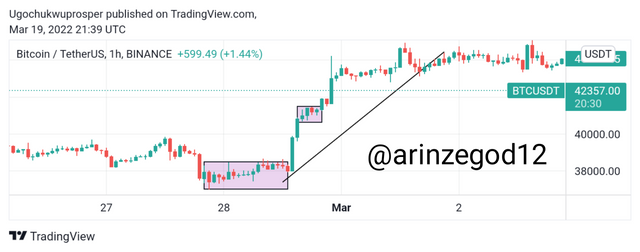
Source: Tradingview
Though the price can break out in the downward direction as well which leads to an automatic trend reversal.
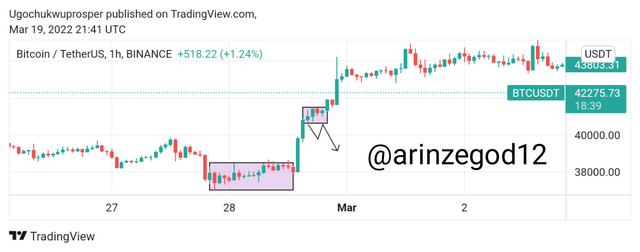
Source: Tradingview
The Psychology behind the Distribution Phase of the Market
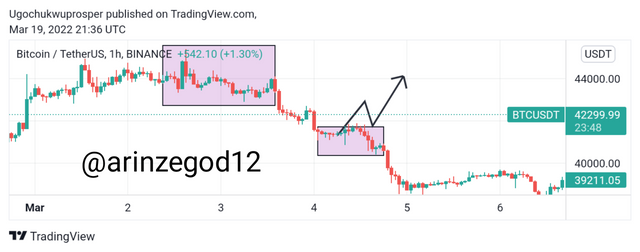
The distribution phase of the market is the phase is the appropriate time to sell in the market as the price is ranging and it leads to a downtrend once it breaks out of the phase.
The Psychology behind this phase is that the whales in the market begin to take profit after the accumulation phase leading to a great dump in the price since they trade a large volume of money in the market and this will cause retail traders to FOMO into the market and it will get to a phase called redistribution phase where the whales take partial profit and the price retraces to a lower high leaving the retail traders to sell in the loss. The retail traders immediately rush to buy the market thinking that it's a trend reversal not knowing that it's a good opportunity to continue selling for those that missed the initial entry. Once price breaks out of the redistribution phase it continues and completes the downtrend movement it is doing.
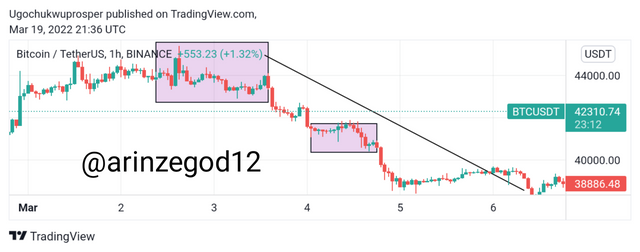
Source: Tradingview
Though the price can break out in the upward direction as well which leads to an automatic trend reversal.
Source: Tradingview
3. Explain the 3 phases of the market and how they can be identified on the chart./h1>
The 3 phases of the market include:
Bullish Market, Bearish Market, and Sideways Market.
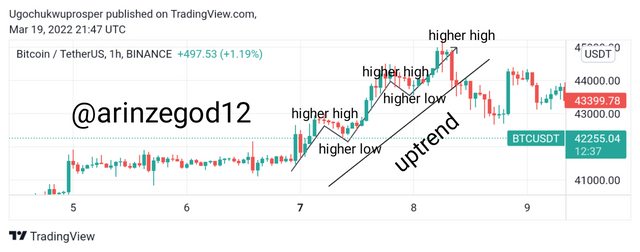
Bullish Phase of the Market :
This is a phase in the market cycle that shows when the market is in an uptrend. This can be confirmed when the market shows the pattern of higher highs and higher lows. When the market is bullish, it shows that the demand in the price of the asset is greater than the supply thereby leading to an upward shoot of the price. In this phase, the major controller of the price is the buyers since they are willing to buy at any price the market is giving them. The Screenshot below shows how a bullish phase of the market can be identified.
Source: Tradingview
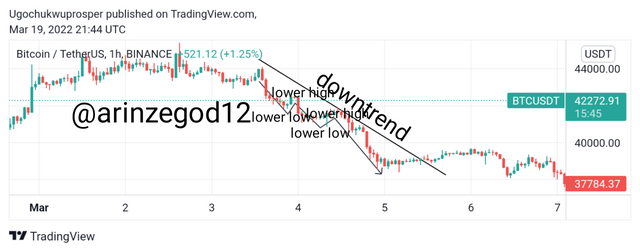
Bearish Phase of the Market :
This is a phase in the market cycle that shows when the market is in a downtrend. This can be confirmed when the market shows the pattern of lower lows and lower highs. When the market is bearish, it shows that the supply in the price of the asset is greater than the demand thereby leading to a downward shoot of the price. In this phase, the major controller of the price is the sellers since they are willing to sell at any price the buyers are giving them. The Screenshot below shows how a bullish phase of the market can be identified.
Source: Tradingview
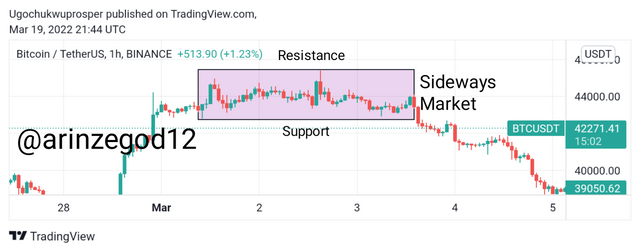
Sideways Phase of the Market :
This is a phase in the market cycle that shows when the market is in an equilibrium between a bullish and bearish phase. This can be confirmed when the market shows the pattern of sideways touching a range of the support and resistance line drawn. When the market is in sideways, it shows that there is a balance between supply and demand.
The Screenshot below shows how a bullish phase of the market can be identified.
Source: Tradingview
4. Explain the importance of the Volume indicator. How does volume confirm a trend? Do this for the 3 phases of the market (Screenshots required).
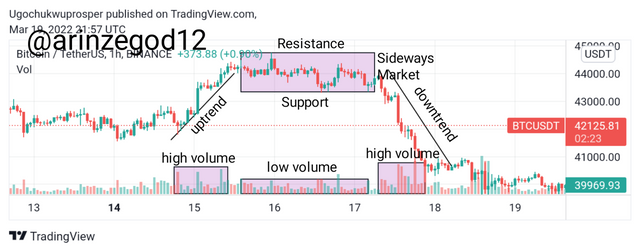
Volume Indicator is a technical analysis tool that shows the amount of money currently in the market.
The importance of the volume indicator is that the higher the volume, the higher the volatility in the market which can be a clue to maximizing greater profit in the market. Also, the volume indicator can be used to confirm our findings from research on trend signals.
Volume can be used to confirm the 3 phases of the market by showing the level of volatility in each phase. It always shows high volatility for a bullish and bearish phase while there is low volatility in the sideway phase of the market.
The screenshot below shows the representation:
Source: Tradingview
5. Explain the trade criteria for the three phases of the market. (show screenshots)
Bullish Trend :
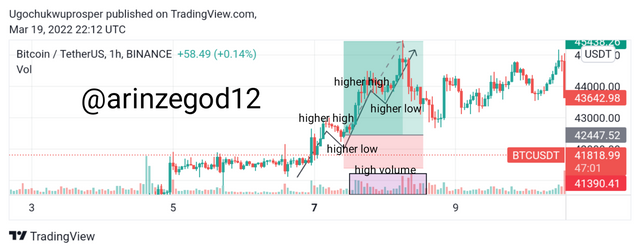
a. Make sure that the price is forming higher highs and higher lows in the chart fully sustained by a high ascending volume as well
b. Place your buy order after there is a retracement which formed the higher low showing a bullish engulfing candlestick pattern.
c. Make use of the risk to reward ratio of at least 1:1.5 or 1:2. Your stop loss should be below the higher low point.
This is illustrated in the chart below
Source: Tradingview
Bearish Trend :
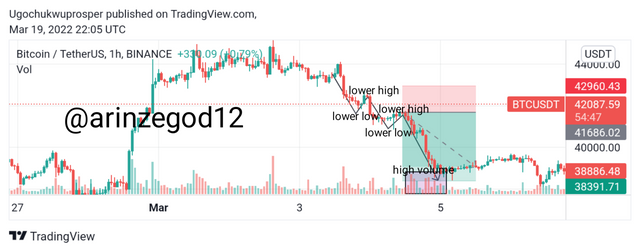
a. Make sure that the price is forming lower lows and lower highs in the chart fully sustained by high ascending volume as well
b. Place your buy order after there is a retracement that formed the lower high showing a bearish engulfing candlestick pattern.
c. Make use of the risk to reward ratio of at least 1:1.5 or 1:2. Your stop loss should be above the lower high point.
This is illustrated in the chart below
Source: Tradingview
Side Way Phase :
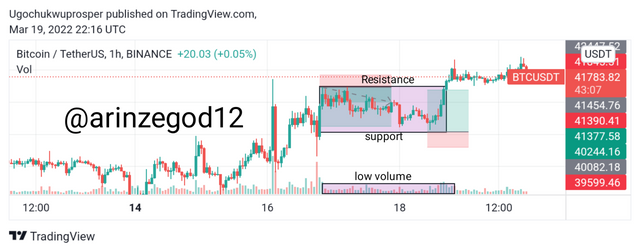
Trading in this market condition is very fearful and risky thereby traders are advised to avoid trading during this phase. But if you must trade it, then you have to use a very tight risk management strategy to avoid losses.
a. Place a sell order at the resistance level with your stoploss inputted above the resistance level. Your Take Profit should be put at the support level.
b. Place a buy order at the support level with stoploss inputted below the support level. Your Take profit should be put at the resistance level.
Source: Tradingview
6. With the Trade criteria discussed in the previous question, open a demo trade for both Buy/ Sell positions.
I analysed the chart of BTCUSDT and DOGEUSDT with what we discuss in this lecture. The screenshot of everything is below
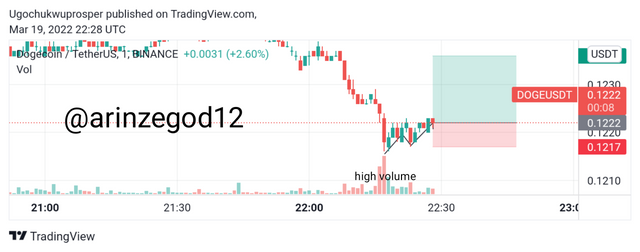
Source: Tradingview
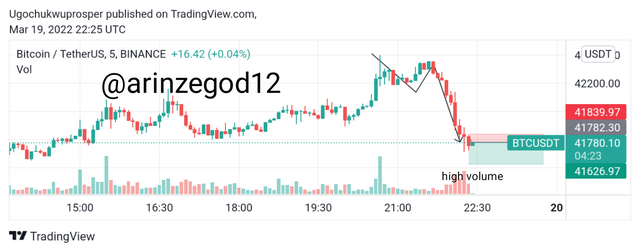
Source: Tradingview
Trade Execution
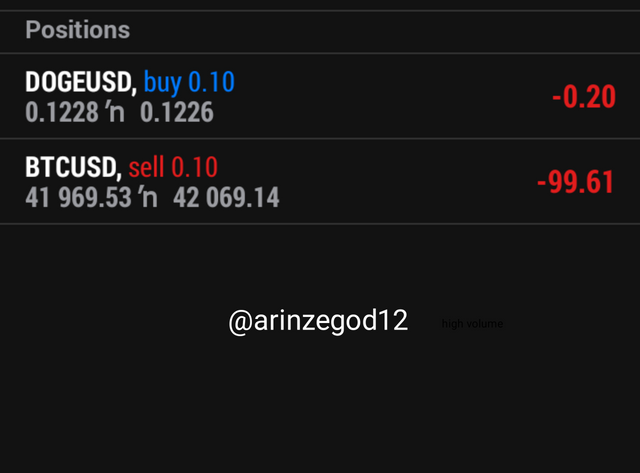
Screenshot from meta trader 5 Application
This is the end result of the Trade
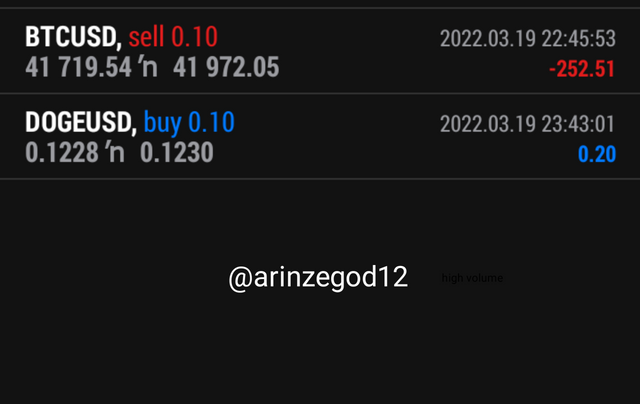
Screenshot from meta trader 5 Application
Conclusion
I want to especially thank prof @reminiscence01 for the beautiful lectures which he taught. This will help me in making more profit in the upcoming trading competition. I await greater lectures from you, Sir.