Question 1. What is your understanding about Triangles in Trading. Explain all forms of triangles in your own words. (Screenshot required)
Triangle is one of the chart patterns used by trader mostly the begginers in analyzing the market to detect trend and to ride along with it. It is a chart pattern known mostly as the continuation pattern because price tend to continue in the previous direction of movement before the pattern was formed. The triangle chart pattern can be easily seen when you draw support and resistance convergent trendline on the chart. They help in detecting of the bullish and bearish trend.
There are about three major forms of triangle chart pattern used in trading namely: symmetrical triangle (neutral version), ascending triangle (bullish version) and descending triangle (bearish version).
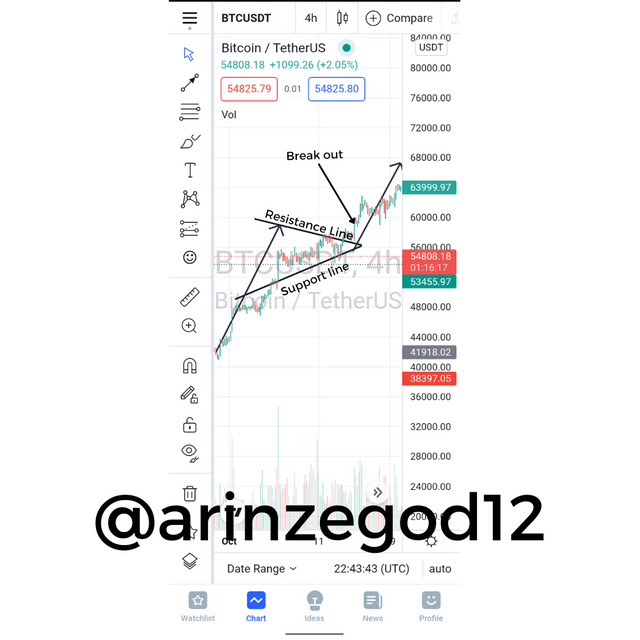
THE SYMMETRICAL TRIANGLE
The Symmetrical triangle is one of the triangle trading patterns. It is composed of two converging trendlines drawn on a chart. As the price moves toward the apex of the trendline, it will unavoidably break the upper trendline for a breakout and cause a bullish trend or break the lower trendline forming a breakdown and bearish trend with falling prices. This form of triangle is seen a neutral pattern as it only moves with the direction of the breakout in the converging trendline.
Source: Tradingview
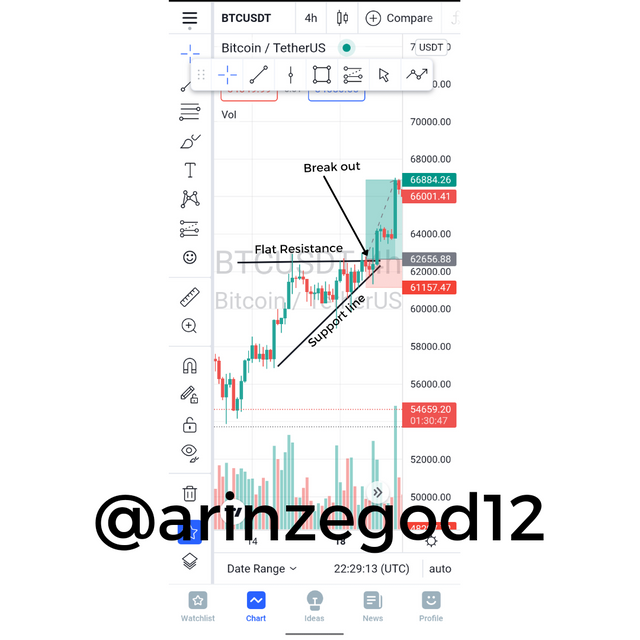
THE ASCENDING TRIANGLE
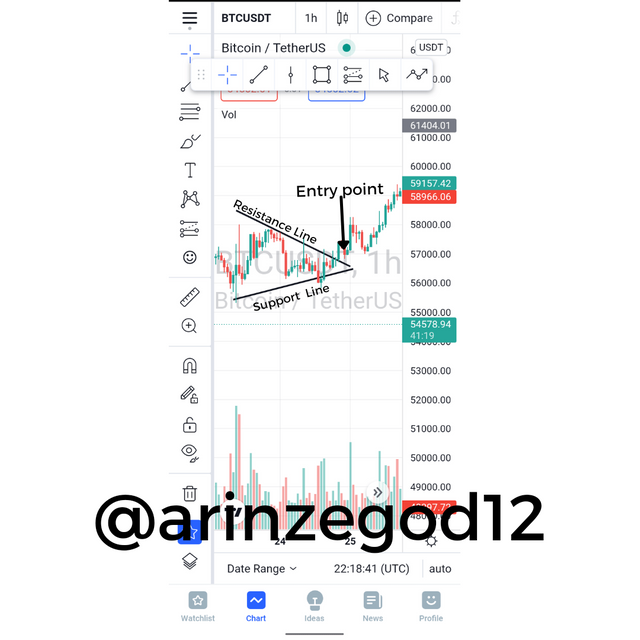
The Ascending Triangle is a form of triangle chart pattern where the upper resistance trendline is flat and the lower support trendline is ascending. This pattern shows that the buyers are stronger than the sellers as price continues to make higher lows. Price reaches the flat upper resistance trendline and with more instances of stronger buyers, the more likely it is to eventually break through to the upside leading to a bullish trend. The traders entry point is usually the point of the breakout in the flat upper resistance trendline or slightly above it.
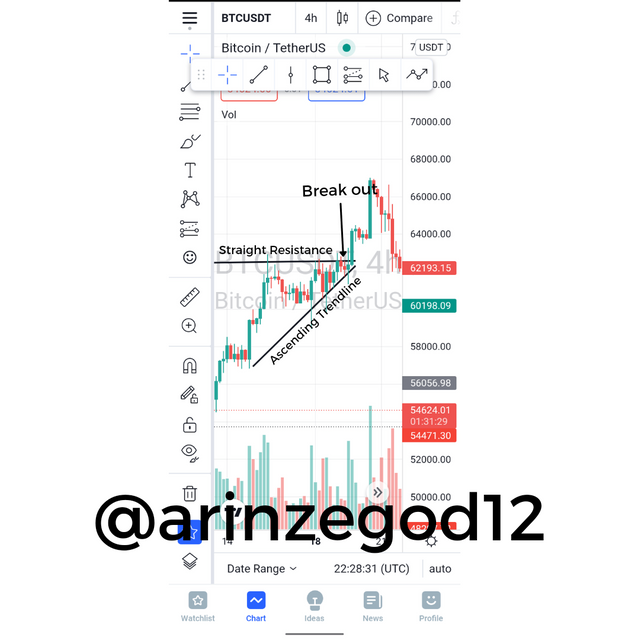
Source: Tradingview
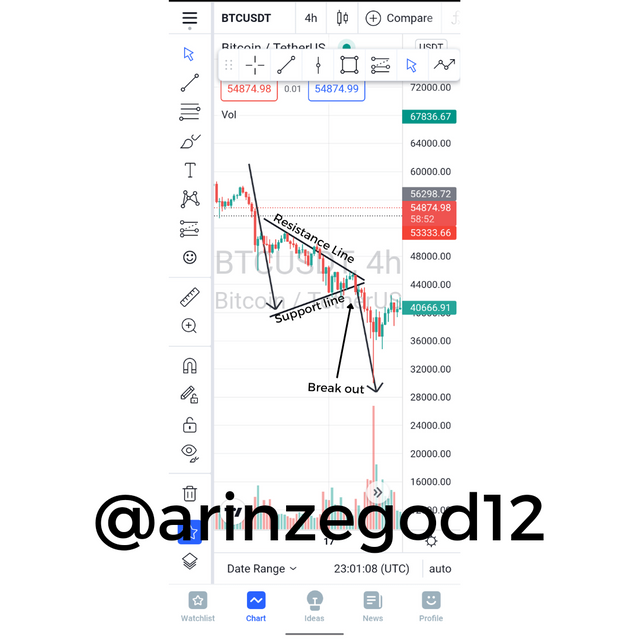
THE DESCENDING TRIANGLE
The Descending Triangle is a form of triangle chart pattern characterized by a descending upper resistance trendline and a flat lower support trendline. This pattern shows that sellers are stronger than buyers as price continues to make lower highs. Price gets to the flat lower support trendline and breaks out to the downside suggesting a bearish trend. The entry point here is the point of the breakout in the flat lower support trendline or slightly below it.
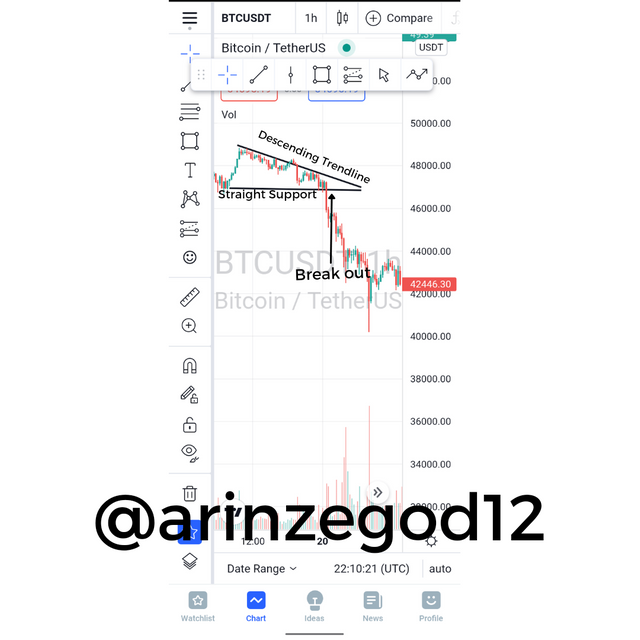
Source: Tradingview
Question 2. Can we also use some Indicators along with it Triangle Patterns? Explain with Screenshots.
Yes we can use some other indicators with triangle patter. In the chat below, I used Relative Strength Indicator(RSI) with the triangle pattern.
Source: Tradingview
Question 3. Explain Flags in Trading in your own words and provide screenshots of both Bull Flag and Bear Flag.
Flag in trading is a price action Continuous pattern that occurs after a large movement in price. It is a continuous in the sense that price will most likely continue to move in the same direction at the end of the pattern. It helps traders to detect the direction of the market and maximize adequate profit. The flag pattern is divided into the bullish flag and bearish flag.
BULLISH FLAG
Bullish flags are flag patterns that occur when the angle of the course uniting highs and lows of large movement of prices after a significant uptrend is parallel and descending. The trend before the flag must be an uptrend.
Source: Tradingview
BEARISH FLAG
Bearish flags are flag patterns that occur when the angle of the course uniting highs and lows of large movement of prices after a significant downtrend is parallel and ascending. The trend before the flag must be a downtrend.
Source: Tradingview
Question 4. Show a full trade setup using these Patterns on any Cryptocurrency chart. (Ascending Triangle, Symmetrical Triangle, Bear Flag)
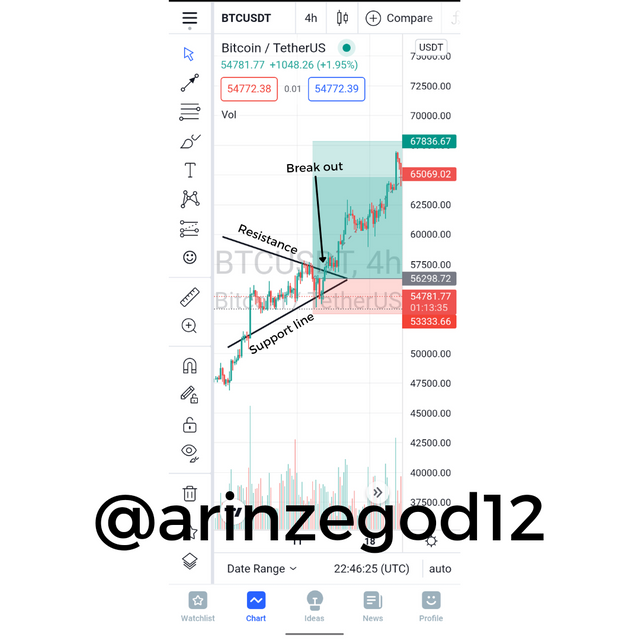
A. Full trade setup using Ascending triangle with BTC/USDT
Source: Tradingview
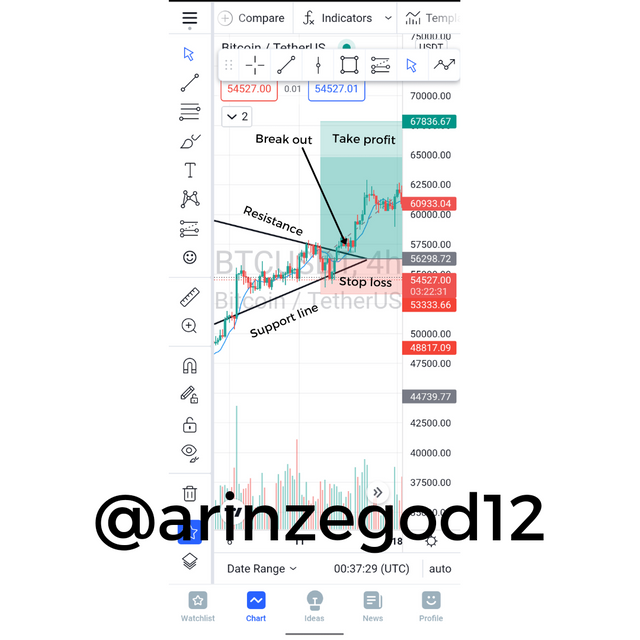
B. Full trade setup using Symmetrical Triangle with BTC/USDT
Source: Tradingview
C. Full trade setup using Bear flag with BTC/USDT
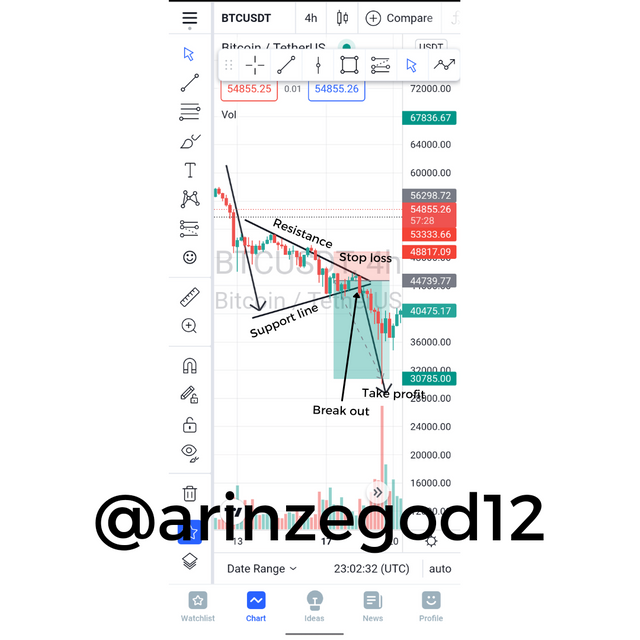
Source: Tradingview
Conclusion
The triangle and Flag trade pattern is indeed a great tool that can ensure maximum profit making in cryptocurrency trading. It can enhance ones trading skill and can be used as a trading strategy to conquer the financial market. I want to thank prof@sachin08 for this useful and interesting lesson for this week. I hope a great one by our next lesson. Thanks.
Here is a screenshot of the marked assignment that was not curated and the link to the assignment
Downvoting a post can decrease pending rewards and make it less visible. Common reasons:
Submit
@steemcurator02
Downvoting a post can decrease pending rewards and make it less visible. Common reasons:
Submit
@steemcurator02
Downvoting a post can decrease pending rewards and make it less visible. Common reasons:
Submit
My reposted post is yet to be curated @steemcurator02
Downvoting a post can decrease pending rewards and make it less visible. Common reasons:
Submit