Here is my submission Prof @reminiscence01. I enjoyed the lecture.
Question 1
In your own words explain the psychology behind the formation of the following candlestick pattern.

Bullish Engulfing Candlestick Pattern

The Bullish Engulfing Candlestick is a bullish reversal pattern usually occuring at the bottom of a downtrend. It triggers a reversal trend as many buyers enter into the market to push prices higher. The pattern formed involves two candles, here the Second Candle completely engulfs the body of the previous Red Candle. To spot a Bullish Engulfing Candlestick Pattern, there must be a Strong Green Candle that covers the previous Red Candle.
It normally occurs at the bottom of a downward trend. A Bullish Engulfing Candlestick signifies the reversal of price in the opposite direction. It has a close above the open of the previous candle. When this candle is spotted traders should place a buy order.

Doji Candlestick Pattern

In Japanese Doji means blunder or mistake. It refers to rare situations of having the open and close price be exactly the same. It represents indecision in the market. This means that neither the buyers not the sellers are in control. We have the Dragon Fly Doji which signals a reversal in price when it occurs in a downtrend. It is a bullish reversal pattern. Most traders will verify the possibility of an uptrend by waiting for confirmation the following day.
Gravestone Doji is a bearish pattern that suggests a reversal then a downtrend in the price action. It can be a sign to take profits on a bullish position or enter a bearish trade.

Hammer Candlestick

It is formed at the bottom of a downtrend or above an uptrend and signals a reversal of price in the market. The hammer is very important especially whenever it is spotted at the support and resistance level. The Candlestick has a long wick. It means that buyers came in and took control of price after sellers pushed price downwards at the beginning.
We have the inverted hammer which is a bearish pattern of the hammer. It signifies a bullish reversal. The handle has a long extended upper wick, a small real body with little or no lower wick. When the candle appears in an uptrend, it usually signals a reversal to the downside. When this occurs buyers were in control of the price at the opening and pushed price up before sellers came in to take control and push price downwards forming a long Candle Wick. Traders can use this to take profits or look for a sell position.

The Morning Star Candlestick Pattern

When it forms at a downtrend the Morning Star is a bullish reversal pattern. It signals a reversal but this should be confirmed with additional indicators. To recognize the formation of Morning Stars, there must be a downtrend since the morning star is a bullish reversal pattern. The First Candle would be a strong bearish candle showing that sellers are in control.The Second Candle shows weakness and that sellers are unable to push price down further. It's a small Doji Candle. The Third Candle should be a powerful bullish Candle, implying that the reversal is almost complete. This Candle shows that buyers have taken control of the market to push price upwards.
The Morning Star signifies that sellers were in control of price until buyers came in and took over.

The Evening Star

It's the opposite of the Morning Star, a strong bearish pattern made up of three candles. The First Candle is a Bullish Candle which shows that at the opening buyers were in control of price. The Second Candle showing that the buyers were not able to push price further up. The Third Candle is an engulfing long bearish candle. It shows that sellers have taken over control of the price from the buyers to push the price downwards.
The Evening Star indicates that buyers were in control of price until sellers took over from the buyers.

Question 2
Identify these candlestick patterns listed in question one on any cryptocurrency pair chart and explain how price react ed after the formation.
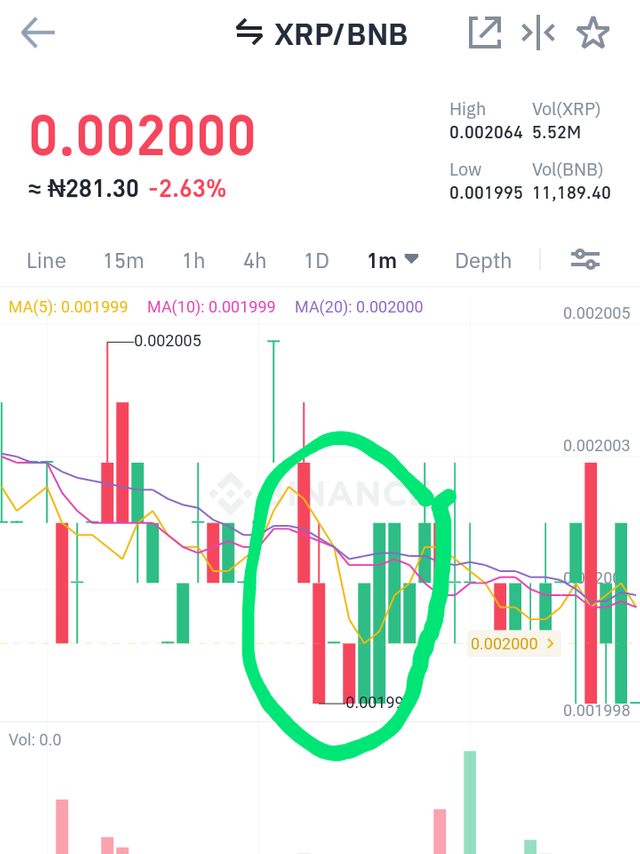
Bullish Engulfing Candlestick
In this chart we can see a reversal bullish trend after the Red Candle was engulfed by a strong Green Candle. A Bullish Engulfing Candlestick Pattern occurs at the bottom of a downward trend.
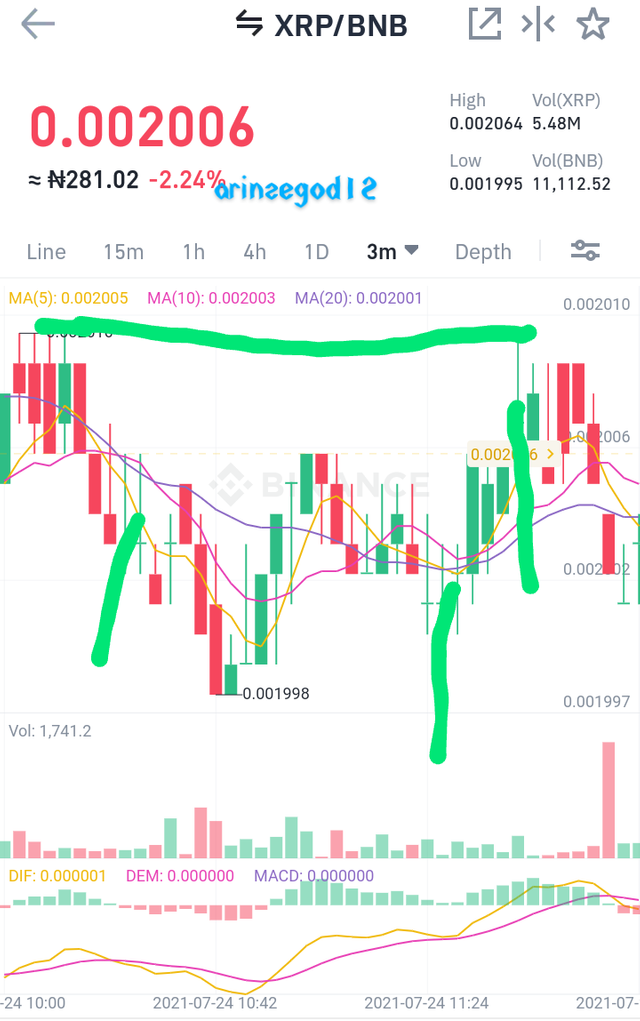
Doji Candlestick
In this chart we will see that the buyers and sellers are indecisive with the opening and closing price both at 0.002010
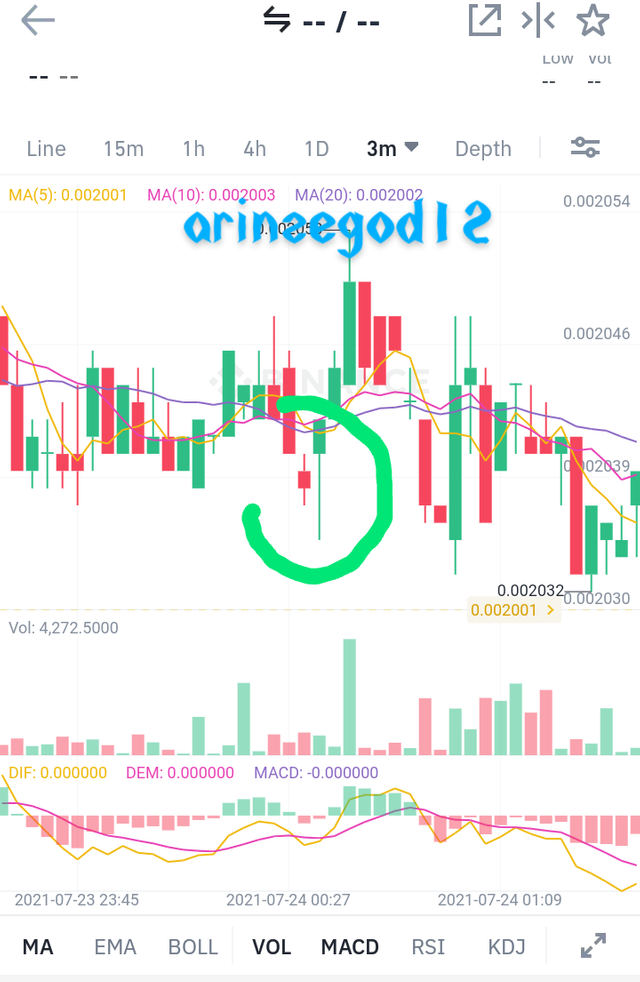
Hammer Candlestick
In this chart we can see the hammer candlestick at the bottom of the downtrend. When this occurred we noticed a reversal and an uptrend indicating that the buyers have taken control of the price from the seller's at that moment. This Candlestick has a long wick showing that the buyers strongly rejected the sellers price.
Morning Star
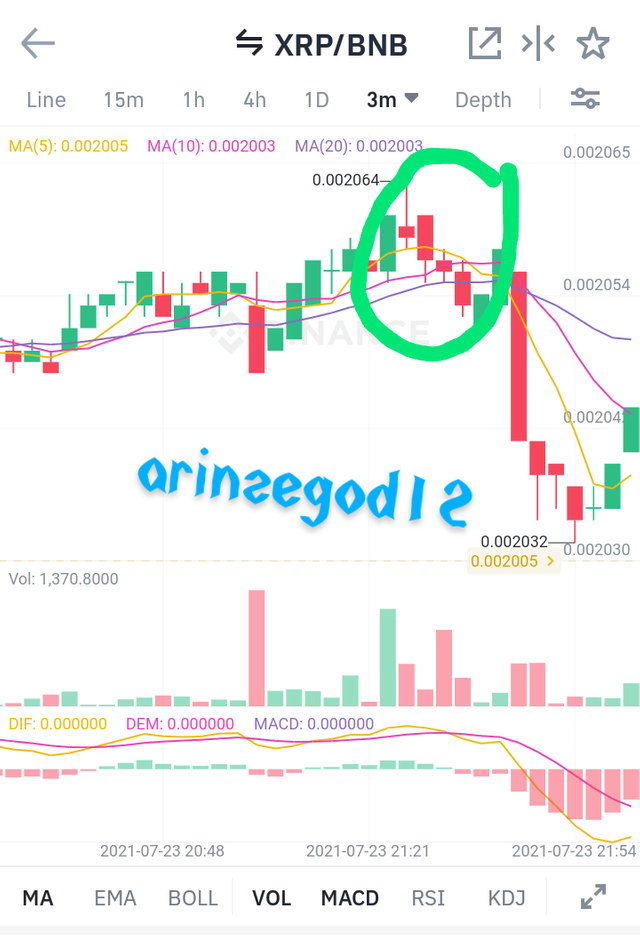
In this chart we can see that the sellers were in control of the price until the buyers came in and took over. This was indicated by A bearish candle that was formed followed by a Doji Candlestick indicating that sellers were unable to push price downwards further then a long green engulfing Candle.
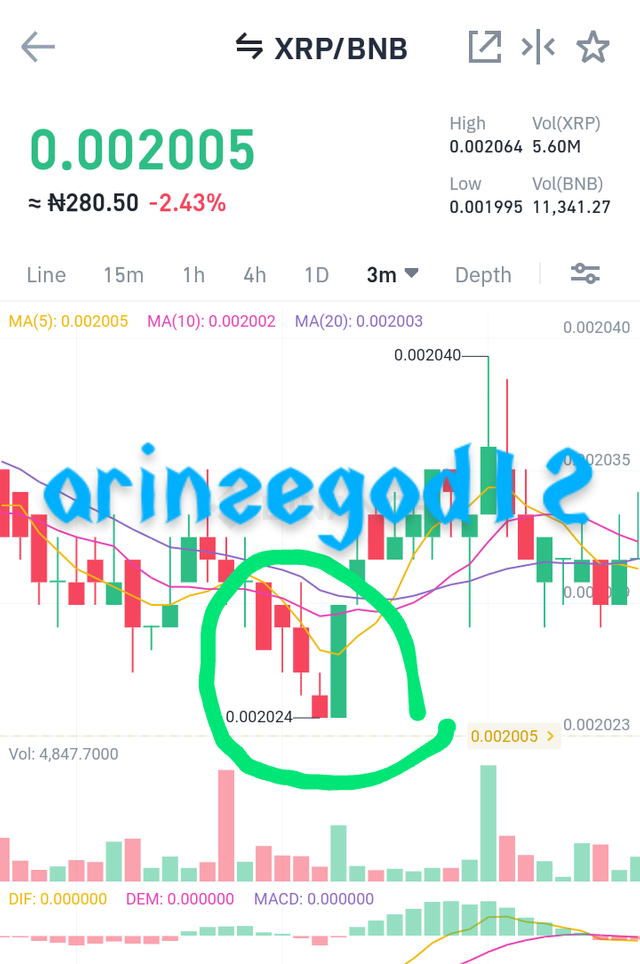
Evening Star
In this chart buyers were in control of the price as indicated by the green Candle then a small Doji Candlestick was formed showing the inability of buyers to push the price up further then a Red Engulfing Candlestick signifying the point sellers took control of the price.

Question 3
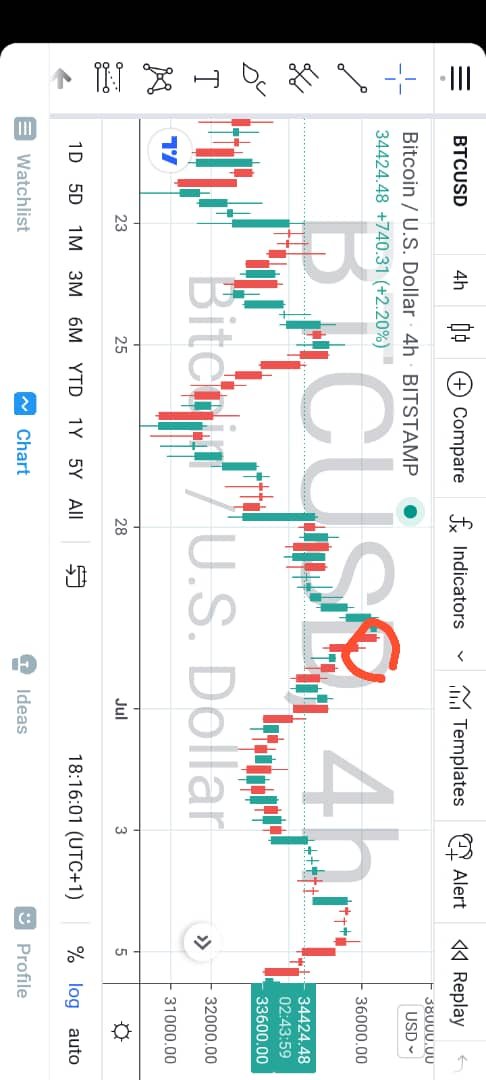
Using a demo account open a trade using any of the Candlestick Pattern on any cryptocurrency pairs.

Conclusion

The significance of candlestick and what they mean is a must know for every trader. They serve as a guide as to when to place a buy or sell order. When a pattern forms it is an indication to traders that a change in price may occur. So to minimize losses when trading, a good understanding of candlesticks is very important.
