1-Put your understanding into words about the RSI+ichimoku strategy
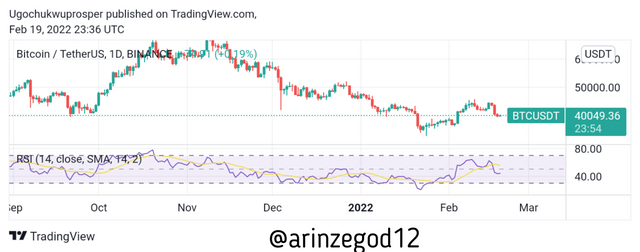
RSI means Relative Strength Index which is one of the technical analysis indicators used for trading the Cryptocurrency market. It is used to identify whether the control of the market is either in the hands of the buyers or the hands of the sellers. These indicators help us to identify whether the strength is dependent on the bears or the bulls because knowing gives us a guide in making trade decisions as the price movement is controlled by the forces of demand and supply which are the traders in the market. This indicator when applied gives a single line that winds around a 100-0 point where it points out the strength dependency in the market. According to the rules of the Relative Strength Index, the line being above 80 shows that the price is a point of being overbought and therefore will bring about a bearish trend while the line being below 30 shows that the price is at an oversold point and it will reverse upwards to a bullish trend. This is indeed a good indicator by it has some shortcomings which will be discussed in question 2
The chart below is a clear representation of the Relative Strength Index in a BTCUSDT chart.
Source: Tradingview
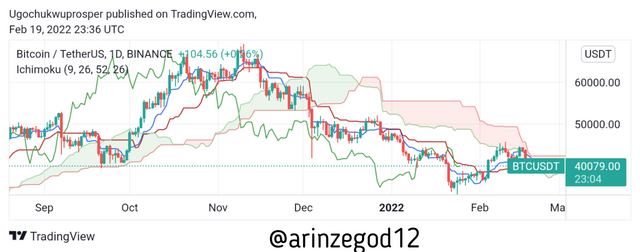
Ichimoku cloud is an indicator that was formed by Goichi Hasoda. It is an excellent indicator that gives better data points than other normal candlesticks do. This indicator is calculated by combining 5 different moving averages which produce a cloud-like layout that forecasts the support level, resistance level, the current market trend, and momentum. This indicator has so many benefits and shortcomings which will be discussed in question 2.
The chart below is a clear representation of the Ichimoku cloud in the BTCUSDT chart.
Source: Tradingview
So we combine these 2 indicators to form the RSI+ichimoku strategy. In using them together, we can formulate a strategy that can help us to learn the direction of the market trends and informs us even before the trend starts so that we will not be lagging behind in trade opportunities. This strategy also helps long-term traders in guiding them to know the direction of the market on the long run. This Strategy helps you as a trader to know the right time to enter a trade before the trend leaves you and also to know your exit point and to also know when to have patience and observe movements in the market.
2-Explain the flaws of RSI and Ichimoku cloud when worked individually
Flaws of RSI when used individually
1.The Relative strength index does not work when the market is already in a trend therefore entering a trade with a signal from the indicator is at the detriment of the trend which is always false. For example if the price is already in an overbought position above 70 in the RSI some traders tend to open a short position which is right but the trend can continue moving in its direction which will lead to liquidation of the short traders.
2.Another flaw of the RSI is that it does not take into consideration the trading volume of the asset which should be considered importantly when making a good financial decision.
Flaws of Ichimoku cloud when used individually
Ichimoku Cloud have the limitations of the moving average which it's a combination of. It is known as a lagging indicator because it does not detect price movement and trend direction on time thereby making the trader to miss out of important trade set up due to its limitation.
This indicator does not give accurate signals and trade setup during sideways or ranging market despite forming support and resistance in the chart and this makes it ineffective for making financial advices at that point.
3-Explain trend identification by using this strategy (screenshots are required)
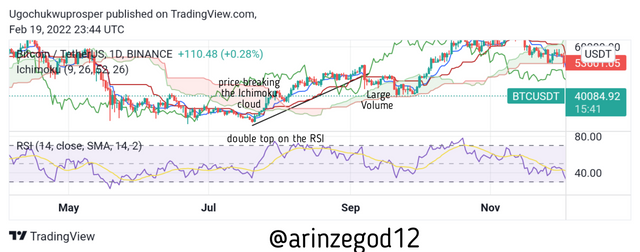
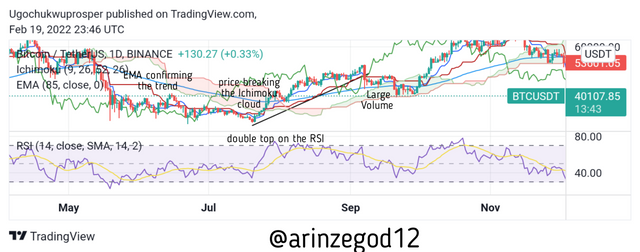
Trend Identification with this strategy makes use of both indicators. You firstly observe the Relative Strength Index Line. RSI line above 80 signifies an overbought price or a strong buying pressure from the buyer. So when this occurs, we watch out for double top pattern on the RSI which shows a slight retest from the price after reaching the overbought region before going back to the overbought region and this signifies an bullish trend. To further confirm this, we have to apply our Ichimoku cloud to verify and then the check the volume of the market as well. If the price breaks above the cloud of the Ichimoku cloud then a clear uptrend is identified. Then the size of the cloud determines the volume in the market. So with this strategy no side is left out unverified.
Source: Tradingview
If you look at the image above, you will notice a clear uptrend as chart obeyed everything explained in my answer to the question
4-Explain the usage of MA with this strategy and what lengths can be good regarding this strategy (screenshots required)
Haven understood the usage of this strategy in no. 3 question, then addition of moving average is a greater help and confirmation to it. Because some traders complain of the sophisticated nature of the Ichimoku cloud therefore it is advised that they can make use of the moving average. The importance of adding the moving average to the strategy is to confirm the trend direction before taking your signals.
I will give an example with the screenshot below to buttress my point more.
It is also important to make use of longer length for the moving average because shorter lengths have been inputted into the Ichimoku cloud already to avoid collision. It also helps to prevent any possible cause of generating a false signal. I used an EMA with the length of 85 in my chart below.
Source: Tradingview
5-Explain support and resistance with this strategy (screenshots required)
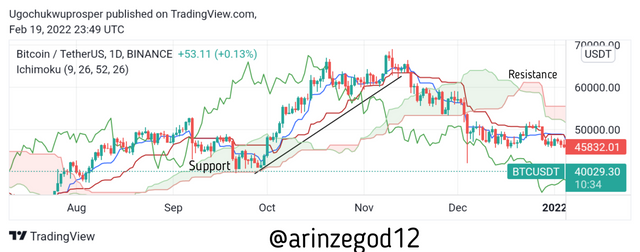
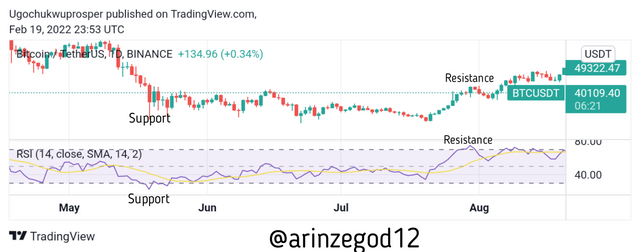
Support is the level in the market when the price ceases to continue going down and reverses or bounces to the upside. On the other hand resistance is the level in the market when the price ceases to continue going up and reverses or moves to the downside. In order to understand support and resistance using this strategy, we will note that they are identified differently in a market with clear trend and in a sideways market. So to Identify support and resistance in a trend you make use of the Ichimoku cloud while you use RSI overbought and oversold in a sideways market.
So for the market in a trend, we use Ichimoku cloud. The mechanism being used is that if they are green then it's a support but if they are red then it's a resistance. When ever there is a break in either the support or resistance then the trend is over. It's also worthy of note that the determinant for the strength of the trend is distance between the cloud and the price. The more the distance the stronger the trend and vice versa.
The screenshot is below
 )
)Source: Tradingview
![20220220_020259.png]
So for the side way market, we use the RSI. Here the overbought area of the RSI is the resistance while the oversold area of the RSI is the support. It is also advised to reduce your trading zone to 60-40 in order to get more accurate outcome.
The screen shot is shown below.
Source: Tradingview
6-In your opinion, can this strategy be a good strategy for intraday traders?
In my own opinion I think that this strategy is not a good strategy for intraday trading rather it's a strategy for long term traders and investors because most analysis here are made on a higher time frames and therefore this does not allow for day traders you use smaller time frames.
Also this strategy requires a lot of patience from the trader in order for the market to come to there entry price therefore chances of it passing a day is always very high which makes it not a good strategy for intraday trading.
7-Open two demo trades, one of buying and another one of selling, by using this strategy
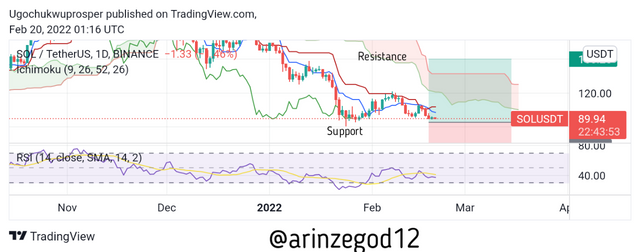
I applied the skill I got from this lecture and I opened a buy order on SOLUSDT. My entry is on the support level as signified by the RSI through the oversold point and my take profit is on the resistance as indicated by the Ichimoku cloud. My stop loss is below the support level
Source: Tradingview
I did a sell trade setup on BTCUSDT using the RSI-Ichimoku strategy. My entry point is the resistance zone as indicated by the Ichimoku cloud while my take profit is 5he support zone as revealed by the RSI which is the oversold point.
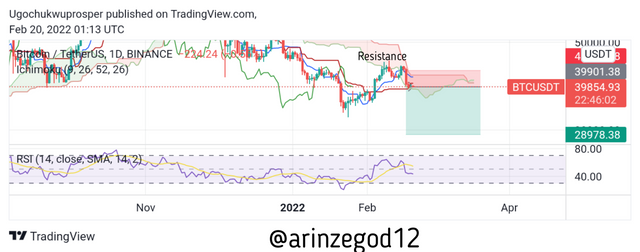
Source: Tradingview
Here is the current outcome of my trade. They are currently in loss but I know they will both enter and end in profit soon.
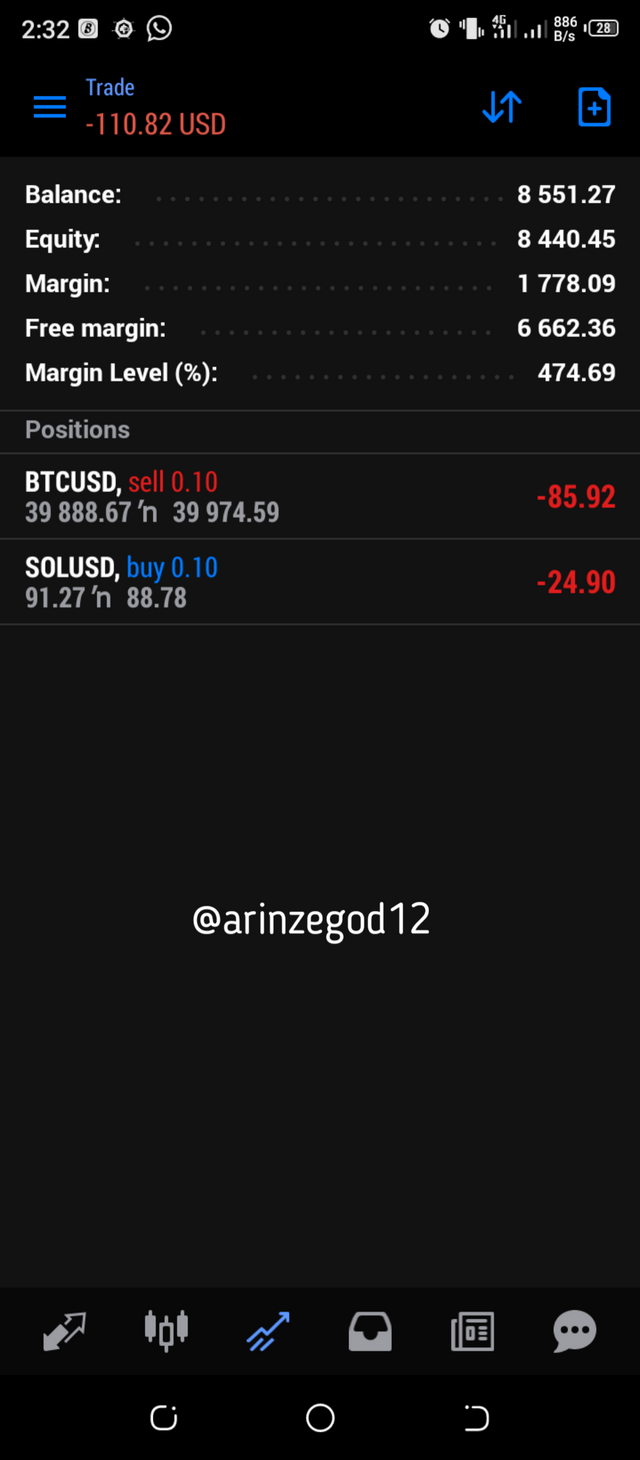
This screenshot was taken from mt5 trading application.
Conclusion
I want to thank prof @abdu.navi03 for this awesome lecture. I hope to learn more next time.