1. Explain and define in your own words what the “VWAP” indicator is and how it is calculated (Nothing taken from the internet)?
Indicators are tools that help in trading the Crypto currency market profitably showing you the right time to buy or to sell in the market. There are many indicators used to trade the market like 200 MA, EMA, Fibonacci, VWAP but we will be talking more about the VWAP in this task.
VWAP stands for Volume Weighed Average Price. VWAP is a very valuable tool used my many veteran traders to take maximum profit out of the market. It is been noted to be one of the best indicator in the market because of it's unique way of revealing the amount of money been traded in a trading session of the crypto market. It is defined as an indicator that help traders maximize profit by adding the volume and the amount of money traded divided by the number of candlesticks. This indicator is also advantageous as it gives us the same price no matter the time frame which are checking from eg in 1hr time frame steem/usdt is 0.5$, if you check in 30mins or 15mins time frame it will still give you the same 0.5$.
In calculating for the Volume Weighted Average Price, you make use of three parameters which are
a)Price
b)Volume of money traded
c)Number of daily candles
You calculate it by applying:
Price + Volume of money traded / Number of daily candles.
2. Explain in your own words how the “Strategy with the VWAP indicator should be applied correctly (Show at least 2 examples of possible inputs with the indicator, only own charts)?
VWAP indicator strategy is a great technical analysis tool for making the most profit out of the crypto market.There are steps to take inorder to apply this strategy correctly and effectively. After being taught how to add up the volume weighted average price in our trading view in the beautiful lectures by prof, you will follow the steps in order to add it before commencing with the steps below.
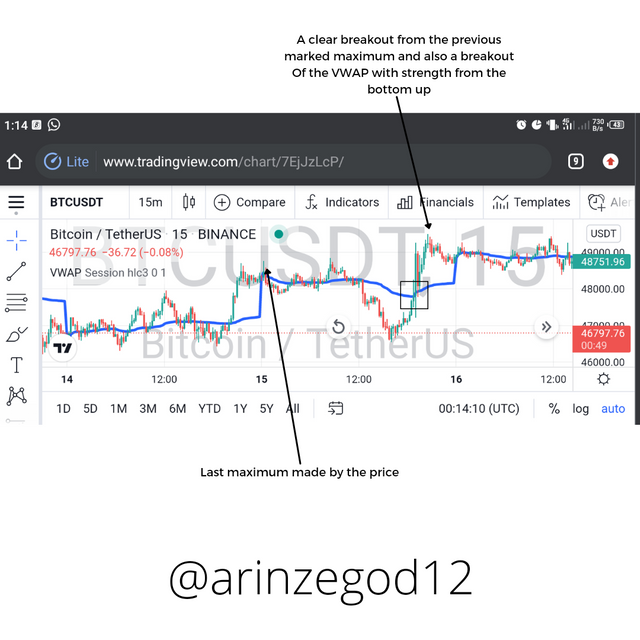
a)Breakdown of the market structure from bullish to bearish and vice versa:
You have to firstly make sure that there is a clear break in the current market structure whether bearish or bullish and further the price has to breakout of the volume weighted average price indicator apparently in order to validate this strategy. If this criteria is not certain, then you will have pause and wait for another opportunity to continue your trading. And this is just the first step therefore you have to wait for other criteria are correct before you take your trade as well.
Source: Tradingview
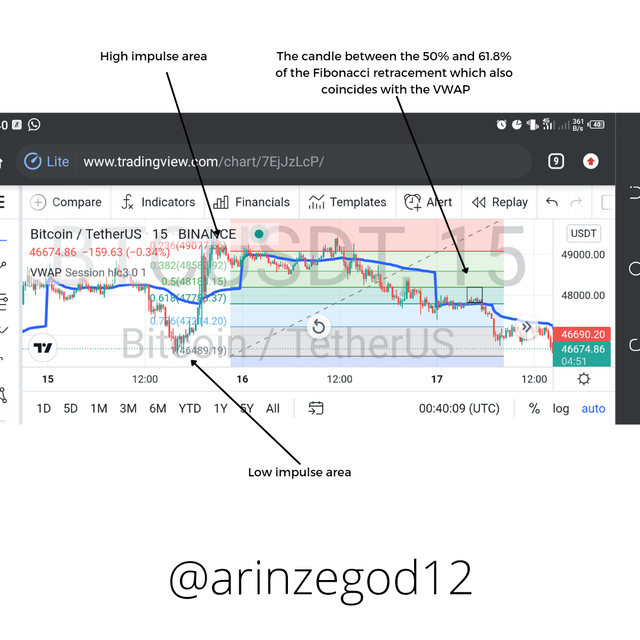
b)Retracement to the Volume Weighted Average Price(use of Fibonacci):
The next step is for us to look out for the retracement of the price in the opposite direction of the initial move either bullish or bearish market structure. When this is noticed we turn on our Fibonacci technical analysis tool called Fibonacci Retracement and measure the price from the bottom to up. You check out from the range of 50% to 61.8% which is the adequate entry point so far as price touches the VWAP.
Source: Tradingview
c)Correct Risk Management:
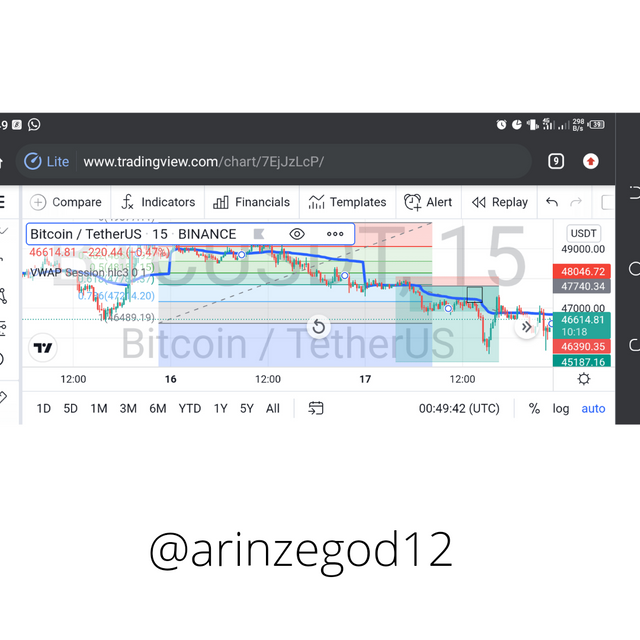
if the price falls within the range of 50% and 61.8% which is our target, the stop loss lies between the 50% and 61.8% Fibonacci retracement line and the take profit should be 1.5 times more than the stop loss and it will give us a risk to reward ratio of 1:1.5 or 1:2 at most.
3. Explain in detail the trade entry and exit criteria to take into account to correctly apply the strategy with the VWAP indicator?
a)The first criteria to take into account is the breaking of the current market cycle either bullish or bearish. You must watch out to ensure an adequate breakout of the current market trend before considering using this trading strategy. The breakout must be clearly seen and validated as well. If this criteria is not confirmed, then you can consider looking out for another opportunity in the market.
b)The second criteria to consider after you have validated the breakout is to ensure that price continues retracing as it breaks out either bullish or bearish as the case should be. When this is taking place, you activate the Fibonacci retracement and wait for the price in convergence with the VWAP to get to the range of 50% to 61.8% and that is where you take your entry point from. If this does not happen this way, then you might consider living it out to check for another opportunity.
c)To properly manage our risk, the stop loss should fall below the level of 50% to 61.8% which the right zone for this strategy.
d)Our take profit should be 1.5 times the stop loss making our risk to reward ratio at 1:1.5 or 1:2 maximum.
4. Practice (Remember to use your own images and put your username). Make 2 entries (One bullish and one bearish), using the strategy with the “VWAP” indicator. These entries must be made in a demo account, keep in mind that it is not enough just to place the images of the entry, you must place additional images to observe their development in order to be correctly evaluated.
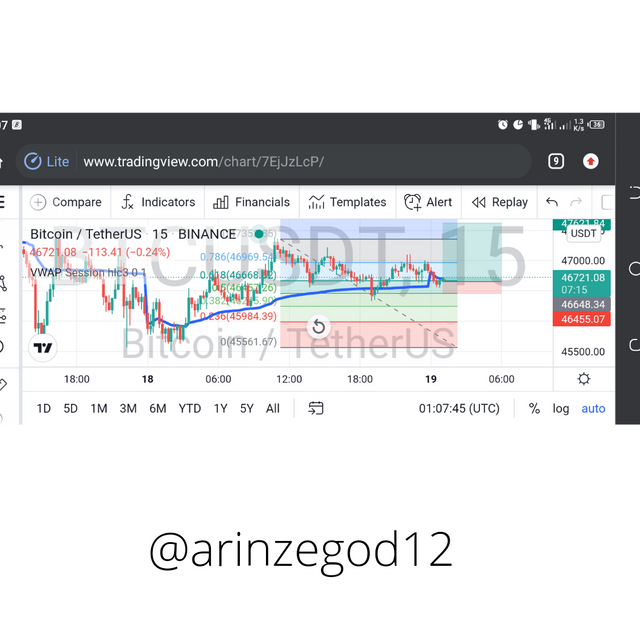
I applied the strategy on the BTC/USDT chart and it shows a bullish market structure. The screenshots are below:
Source: Tradingview
I ensured that all the criterias for the VWAP were put in place and strictly adhered to.
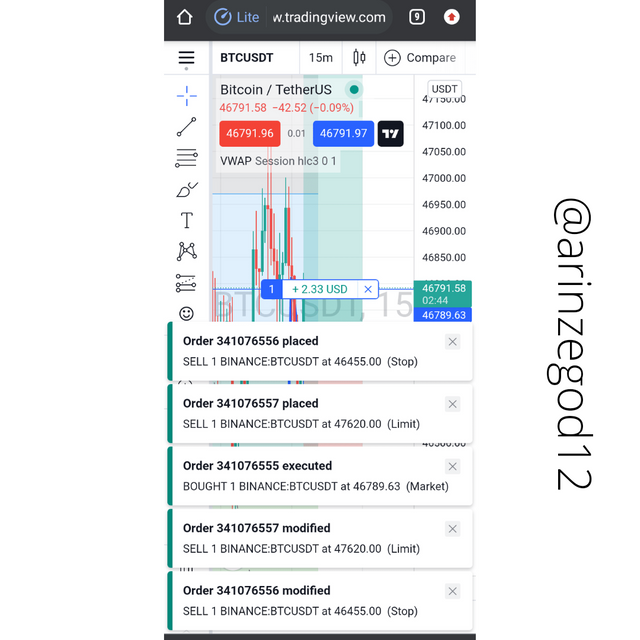
Source: Tradingview
I placed my trade successfully indicating the entry price, take profit and the stop loss.
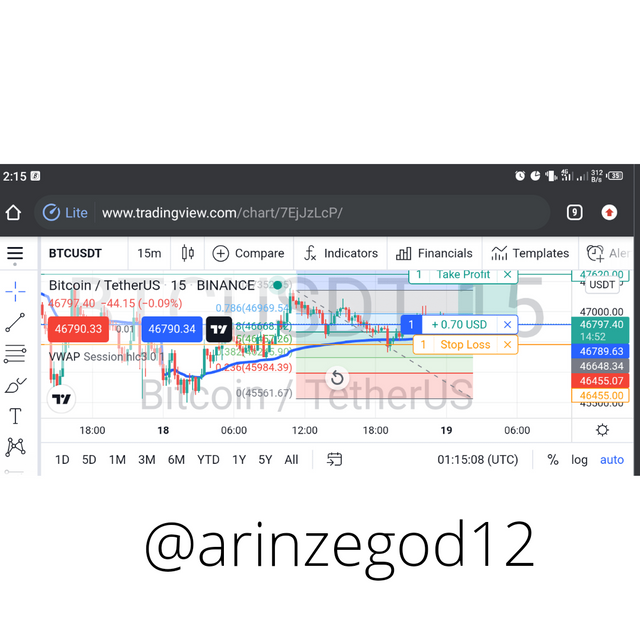
Source: Tradingview
This shows the progress of my trade which is in profit already as seen in the screenshot.
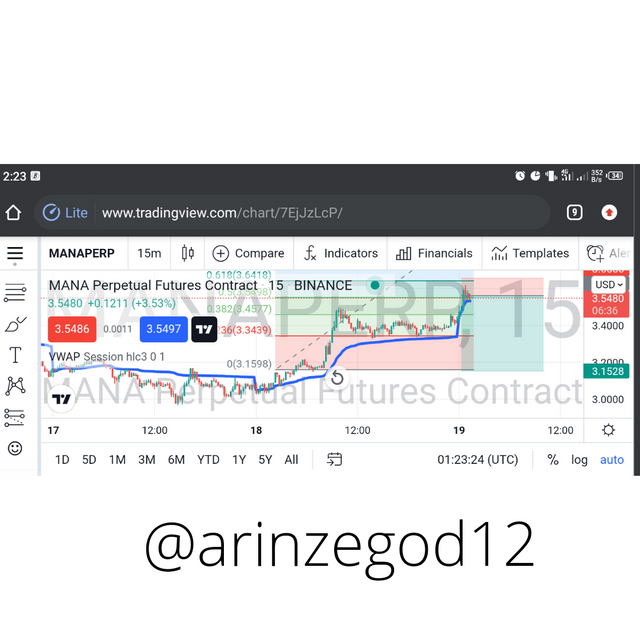
I applied this strategy in MANA/USDT chart which is shows a bearish market structure as seen below.
Source: Tradingview
With all the criterias fully valid, the market is bullish for this pair.
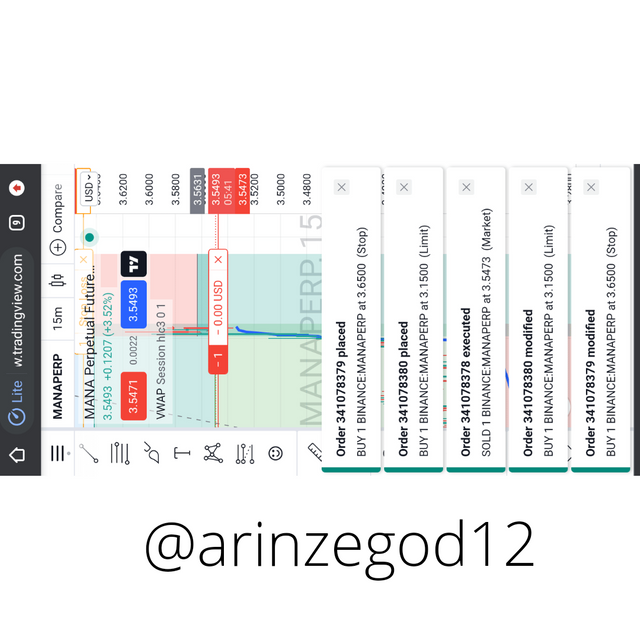
Source: Tradingview
The Entry point, take profit and stop loss of the trade fully represented.
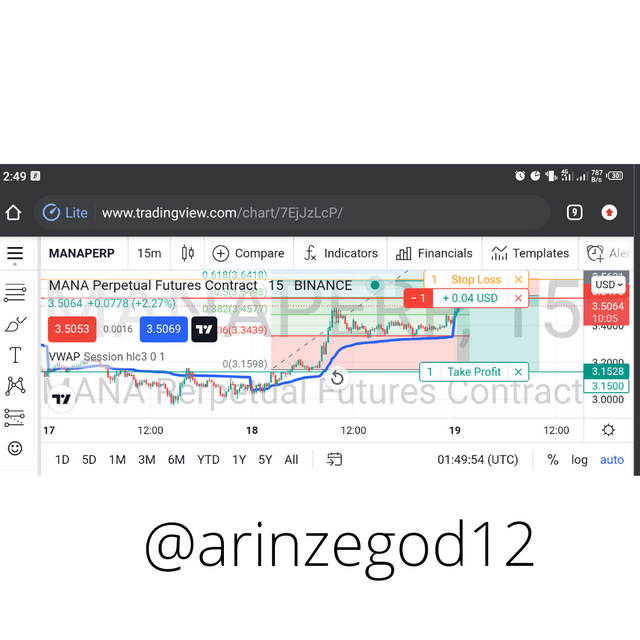
Source: Tradingview
The developmental stage of the trade showing small profit already.
Conclusion
I appreciate prof lenonmc21 for teaching us this impactful lecture which will help us to maximize enough profit in trading the crypto market. I look forward to another interesting edition next time. Thanks in Anticipation