

Understanding Fibonacci Retracement

Generally, due to the volatile nature of cryptocurrency, price doesn't move in only one direction or a straight line but move zigzag. There is serious competition between the buyers and sellers, as such, we can observe a dip in the shape of retracements before the price can proceed in its original direction.
Thus, this makes technical analysis complex because during the retracement a trader gets confused not knowing the distance the price can retrace, as such, find it difficult to place entry and their take profit. However, there is a technical tool that can provide such a solution and it's called Fibonacci retracement.
A Fibonacci retracement is an important tool in technical analysis trader uses for determining key support and resistance levels as it is built by taking two radical points on a crypto chart and halving the vertical distance by important Fibonacci ratios where 0% is assumed to be the start of the retracement, whereas 100% is a complete reversal to the original price before the long move.
That's it's ratios give price levels to which markets tend to make retracement move before the trend continues in the actual direction.
Nevertheless, the Fibonacci retracement is composed of horizontal lines drawn in the crypto chart which serve as support and resistance level for price levels and reversals. Thus, the ordinary levels in Fibonacci retracement are 23.6%, 38.2%, 50%, 61.8% and 78.6%. Though the 50% is used by traders but not officially a Fibonacci ratio.
Assume the market price of an asset drops to $1.5 and then rises to $2.36, in that case, it has retraced 23.6%, which is a Fibonacci number. As such, these numbers also have relevance in crypto markets. The Fibonacci is mathematically related using the Fibonacci Numbers. For better understanding let's check out the illustration below.
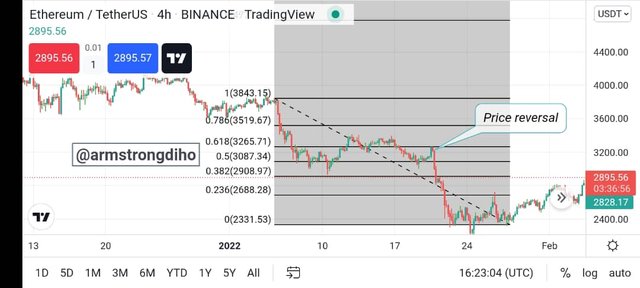
From the crypto chart above, we can see how I used the Fibonacci retracement tool to observe a reversal point after retracement during a downtrend. The horizontal line of the Fibs tool was drawn from the original high price to the new low price. At the point of reversal, we can see the price establish resistance at the 0.618 levels.
Furthermore, in the market structure, Fibs plot the uptrend by measuring the retracement from the low point to the high point while downtrend from the high point to the low point.
The Fibonacci retracement levels were titled after the Italian mathematician called Leonardo Pisano Bigollo. Though he was well-known as Leonardo Fibonacci. And, currently, traders use this tool to spot key support and resistance levels.

Fibonacci Extension

The Fibonacci Extension level is an important tool in trading whereby the levels obtained from it are calculated from the Fibonacci sequence ratios which are very beneficial to traders as they used it to
define the possible forecast levels that price movement can attain after a retracement or pull-back.
The Fibonacci extension level occurs around support and resistance zones and is related to the continuation of a trend movement where price reverses back to the original trend.
And the unique aspect of the Fibonacci Extension is that after a trader might have pointed out the reversal point on the Fibonacci retracement level, the Fibonacci extension tool is then used to define the possible forecast levels that price movement can attain after a retracement or pull-back. Hence, traders use the Fibonacci extension tool to make entry and exit positions.
Let's check out the crypto chart below for a better understanding.
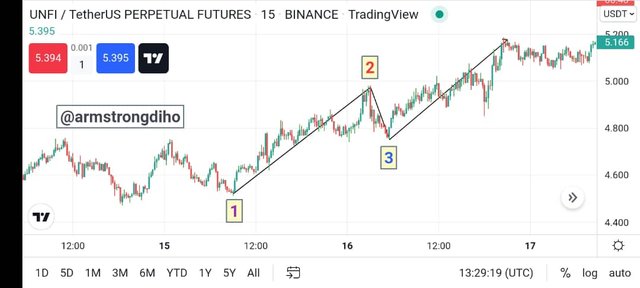
Technically, the image is in an uptrend. However, from the image above, zone 1 is the low point, zone 2 is the high point and zone 3 is the retracement low point. This zona entails that we have to identify the point at which the trend begins and from the chart, zone 1 is the beginning of the trend, while 2 is the high point which marks the end of the trend and 3 is the last the end of the retracement.
The next to do is to make use of the Fibonacci extension tool to shows the Fibs levels where the price is probable to attain before a retracement just as shown on the crypto chart below.
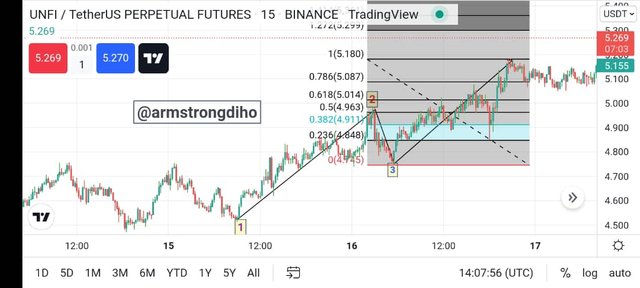
Observing the crypto chart, after the market price has retraced or pulled back at the low point which acts as a support on the Fibs retracement level. After which, the market price overturned back to its actual direction of the bullish trend where the price prolonged on the 1(5.180) Fibonacci extension level.
In the illustrations, we can observe that all the levels on the Fibonacci tools are important as the market price can get at support or resistance levels respectively. So, a trader who understands these levels on the Fibonacci tools can use it to define the distance a trend can attain, as such, can use it as a key to knowing where to place an entry and exit.
For instance, the retracement point might act as an entry point while where the price prolonged such as on the 1(5.180) Fibonacci extension level can act as a profit target for buy position.
How to Calculate Fibonacci Retracement
Basically, the Fibonacci Retracement Calculation is obtained based on the information derived from the new highs and recent low of price movement. However, the Fibonacci retracement tool has a mathematical representation that signifies its calculation, it is shown as below:
R = X + [(1 - % Retrace/100) * (Y – X)]
Where:
X = initial price value of the retracement move.
Y = the top price value attained before the retracement move.
And the retracement values are as follows.
% Retrace 1 = 23.6%
% Retrace 2 = 38.2%
% Retrace 3 = 50%
% Retrace 4 = 61.8%
% Retrace 5 = 78.6%
Here, to calculate the %retrace of 23.6%, the mathematical following representation are as follow.
Note: The level of 0.236 is equal to 23.6%.
R = X + [(1 - % Retrace 1/100) * (Y – X)]
From the crypto chart above, we can see how I have picture and identified point X which is the starting point of where the Fibonacci retracement tool is placed while point Y which is the end of where the Fibonacci retracement tool is placed. Also, the price was having a retracement to the 0.236% level.
Now let us illustrate the following:
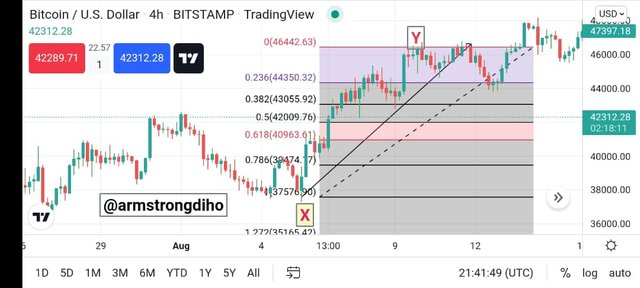
From the chart above,
X = 37576.90
Y = 46442.62
Now that we have these data as shown on the crypto chart above, so we have to proceed with the calculation.
R1 = 37576.90 + [(1 - 0.236) * (46442.63 - 37576.90)
R1 = 37576.90 + (0.764 * 8865.73)
R1 = 37576.90 + 6773.41772
R1 = 44350.31772
We can see that this value correlates perfectly with the displayed graph of BTC/USD
The original point of the Fibonacci retracement tool is identified with the letter X, then the end point of the Fibonacci tool with the letter Y, then we have the retracement of the price that attains the level of 0.618%
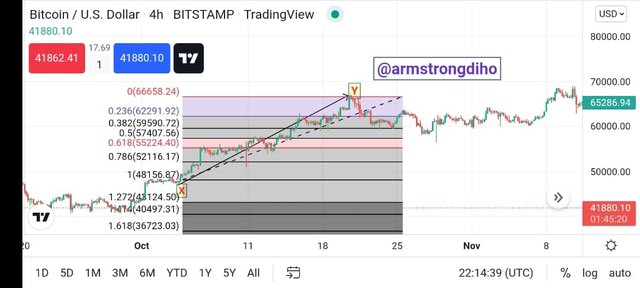
Having this we will illustrate the following:
X = 48156.87
Y = 66658.24
Having these data we will proceed to perform the calculation:
R4 = 48156.87 + [(1 - 0.618) * 66658.24- 48156.87)
R4 = 48156.87 + (0.382 * 18501.37)
R4 = 48156.87 + 7067.52334
R4 = 55224.39334
We can see that this data correlates with the one on the graph of BTC/USD.

Trading Cryptocurrency on a live account using Fibonacci Retracement

Buy trade UNFI/USDT
Here, I will be opening a live trade position from the signal on the Fibonacci extension tool. However, the analysis will be carried out on Tradingview and Tradingview paper trading respectively. while the trade will be executed on Binance exchange.
The below image shows my verified Binance account

From the chart above, we can see the market is in an uptrend and the price found support at the Fibonacci level of 5.254. Also, we can see bullish candles which means the buyers are really in control of the market. I opened a buy position after the formation of the bullish candle with stop loss placed below the support level (5.276 level). Take profit for this position is placed at the 5.489 level.
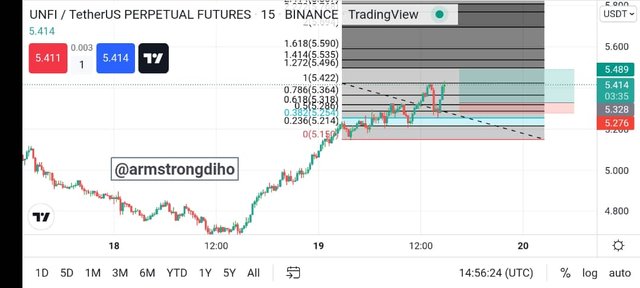
The below image shows the progress of the trade and it can serve as the transaction evidence to show the proof of the trade.
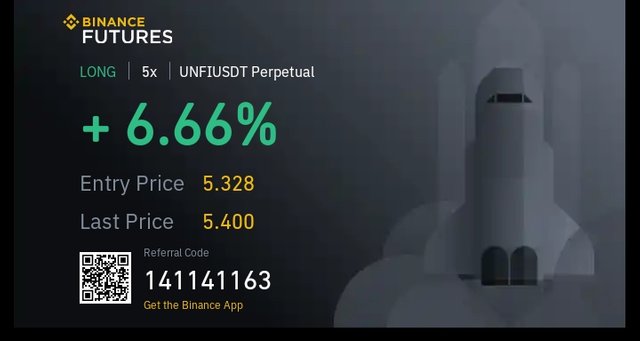
IMG-20220319-WA0020.jpg

Opening a Demo Trade Using Fibonacci Extension Tool

Here, I will be opening a demo trade position from the signal on the Fibonacci extension tool. However, the analysis and the trade will be carried out on Tradingview and Tradingview paper trading respectively.
BUY TRADE SOL/USDT
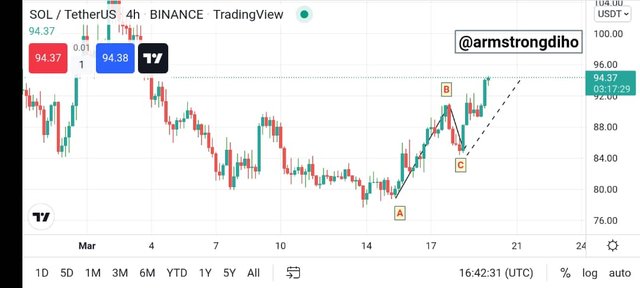
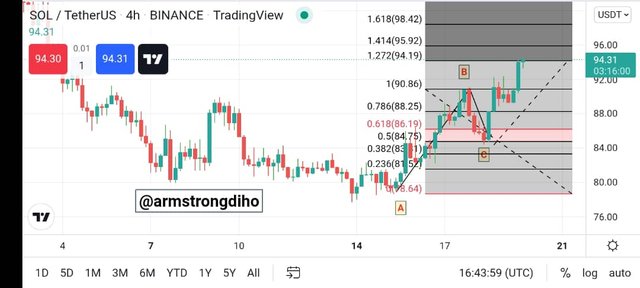
Observing the crypto chart of the On SOL/USDT chart above, I saw the market price was in a bullish trend before creating a high point around $90. After that, the price retraced to $84 before continuing its upward direction. Thus, it was a perfect signal to make an entry.
Then, I used the Fibs tool to draw the Fibonacci extension from point labelled "A" which is the onset of the trend to point labelled "B" which is the stop of the trend while the point labelled "C" is the end of the pullback. To determine the extent price will reach to set my entry and exit, I drew a Fibonacci extension tool as shown below.
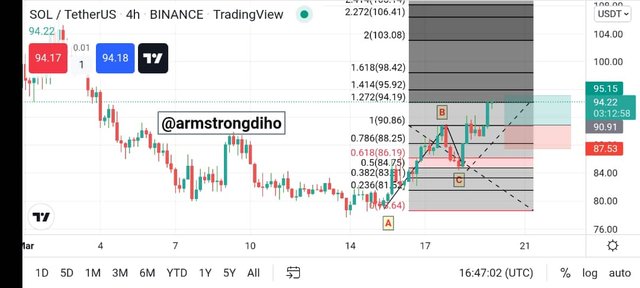
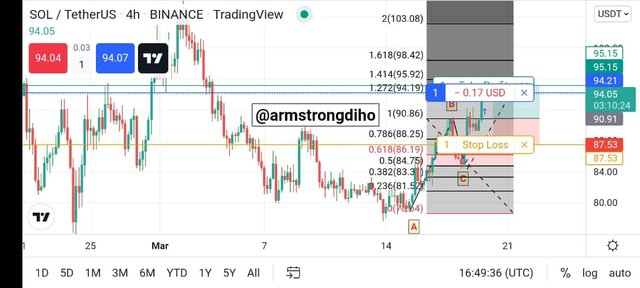
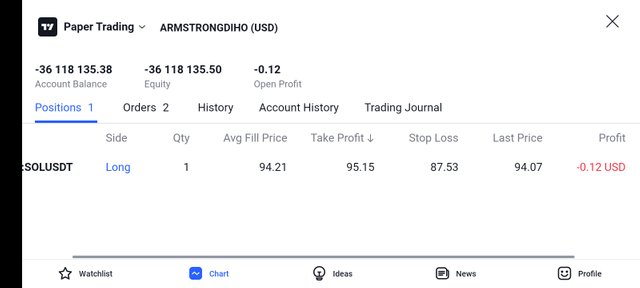
So, I opened a buy position on SOL/USDT as the price overturned back up. I placed my stop loss below the new low point. And, I set my take-profit position below Fibonacci level 1.4( $95.15). However, the price will pass this level before a retracement.

CONCLUSION

The Fibonacci retracement and extension tools as we have seen from the overview is a powerful tools traders used to determine how far the price can attain. Also, the Fibonacci retracement tool is related to trend continuation and occur in the level of support and resistance. As such, traders can use the data derived from the Fibonacci retracement tool to identify key support and resistance levels as well as to find entry and exit points.
Nevertheless, in the affairs of trading, Fibonacci tools modify the trading style and should be recommended as an extra tool of confirmation to trading setup.
THANKS FOR READING THROUGH
Cc: Prof. @pelon53
Downvoting a post can decrease pending rewards and make it less visible. Common reasons:
Submit