
Explain the Japanese candlestick chart? (Original screenshot required).
b) In your own words, explain why the Japanese Candlestick chart is the most used in the financial market.
c) Describe a bullish and a bearish candle. Also, explain its anatomy. (Original screenshot required)

INTRODUCTION

Cryptocurrency investment is one of the trendings and possible means turning people into millionaires but full of risk as a result of the volatile nature of cryptocurrency. However, it is ideal for only savvy investors or at least users who have some necessary knowledge about cryptocurrency and not for beginners. However, to be a savvy investor, it is very important to understand fundamental and technical analysis respectively.
Thus, the candlestick, indicators and other technical tools are used by the investors to determine the price movement of the Cryptocurrency before making any trade decision. Basically, in this task, I will be focusing on Candlesticks which is the primary of technical analysis.
Explain the Japanese candlestick chart? (Original screenshot required).

In the affairs of crypto trading, it is very obvious that the asset price does not move in one trend direction but moves laterally as a result of the volatile nature of cryptocurrency and one of the possible ways of showing information about an assets' price movement known as a technical chart called "Japanese candlestick chart"**.
IMAGE SHOWING THE NATURE OF JAPANESE CANDLESTICK

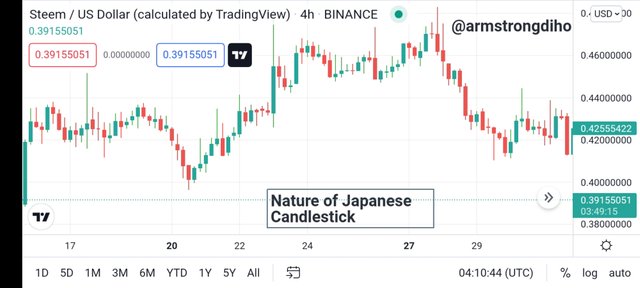
As of the year the 1700s, a rice merchant known as Munehisa Homma (the father of candlestick chart) created the Japanese candlestick chart as a conclusion of the price rotation which then made him to realized the effect of demand and supply.
However, in cryptocurrency investment, the Japanese Candlestick Chart is one of the best technical chart a trader or a technical analyst use in technical analysis to get accurate information about an assets' price movement. Generally, the Japanese candlestick chart shows the price movement and the effect of the demand and supply of crypto assets in a market for a specific timeframe.
Generally, the Japanese candlestick chart provides accurate information about the price movement of assets, shows the interaction between buyers and sellers in the market, and can be used to analyse and spot chart patterns. Thus, a typically Japanese candlestick has the body and the weak (shadow). The body consists of the open and the close while the weak consist of the low and the high. So, using open, low, high, and close makes trading with candlestick useful to the investors.
Basically, looking at a candlestick of a crypto asset, an investor can spot the market open, low, high, and close price for a specific timeframe. This means that the body of the candlestick indicates the range of price for an observed period. The red candle represents bearish, while the green candle represents bullish candle. Note the colour depend on the trader choice of setting but I will be using red and green candlestick for bearish and bullish respectively.
Moreover, in the bullish candlestick, the close is always higher than the open while bearish candlestick the close is lower than the open. The low and high weak remains the same for the bullish and bearish candles.
IMAGE SHOWING THE RED (BEARISH) AND GREEN(BULLISH) CANDLESTICK
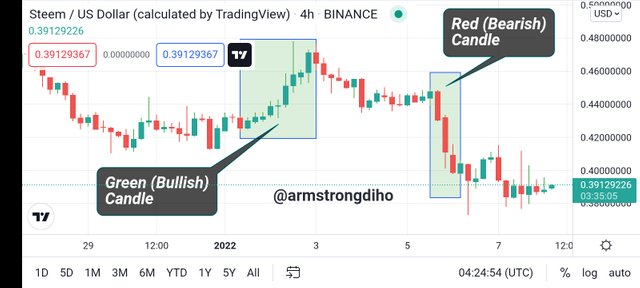
For example, when we observe a series of green candles (bullish) in the market with a consistent rise for a specific timeframe it means the buyers are in control of the market. Conversely, if a series of red candles is formed in the market for an observed period with consistent falls, it means the sellers are in control of the market.
From the example illustrated above, it means the candlestick is very useful to the investors since they make trade decisions and forecast price direction from the information derived from the candlestick. With this effect, we can say the Japanese candlestick charts serve as a cornerstone of technical analysis to the traders and are worth focusing on.

In your own words, explain why the Japanese Candlestick chart is the most used in the financial market.

Certainly, a trader or an investor who doesn't understand and interpret the candlestick is prone to risk as such can lose more cash or make some wrong trade decisions in the affairs of cryptocurrency investment, however, this entails the importance of candlestick. The popular thing to learn is to know the overall concept of candlesticks when it comes to crypto trading or investing.
Let's check out why they are mostly used in the financial market.
Candlesticks have been around for a long time. The Japanese had already been looking at charts long before the Europeans and Americans discovered charts. And so, ordinarily Japanese candlesticks chart have been around the longest. This is one reason why they're the most used.
It Represents Human Emotions
Another thing is that the chart basically represents human emotions. Or better put, the chart is a visual representation of what's going on in the market and the Japanese candlesticks are the best way to fully grasp or understand what's going on in the market. The typical Japanese candlestick shows various information or as I'd like to call it, "data points". It basically shows the open, close, high and low of each trading session (based on timeframe). This gives us an idea of price action.
This is another vital reason why candlesticks chart is used more than any other chart reading method.
The Candlesticks Are Flexible And Easy To Interpret.
Candlesticks provide more valuable information than your regular bar chart or line chart. You can essentially get all the information represented on a bar chart on a candlestick chart and get even more detailed and clear information or signals.
Japanese Candlestick Charts Enable Analyst To Make Good Trade Decision
Though technical analysts or investors have a different trading strategy but candlestick is a must used when it comes to technical analysis. For a technical analyst to decide to trade, they must study and monitor the price movement and a candlestick chart is one of the necessary tools used. This is to say that the candlestick is a very important tool that an analyst can't do without because they provide accurate information about the price of an asset which then enables the make a good trade decision.
Japanese Candlestick Charts Is Very Easy To Understand And Makes Analyst Analyse Price Action At A Glance
The Japanese candlestick is very easy to understand and interpret since the anatomy of the body (OHLC) provide information about the price movement not like the line chart where there is no OHLC. The length (long & short) of the candlestick body and the weak are very significant indicators of price movement.
With this effect, the candlestick is more visual and makes an analyst picture out the market open, high, low and close price which aid to analyse the price action of an asset.
Japanese Candlestick Charts Enable Analyst To Visualise The Force In The Market
This is another reason why the Japanese candlestick is most used in the financial market. Generally, the candlestick show graphically the supply and demand pressure in the market. Volume is a result of the high force of the buyers and the sellers which tend to contribute to each period’s price movement. However, with the help of the candlestick, the analyst can visualize the supply and demand (force) in the market which is behind each period’s price movement.
Track Previous Price Movements
Tracking previous price movements of the market is very simple with the help of candlesticks. As such enable the traders to identify future trends, reversals and continuations at ease since it can be displayed graphically through the candlestick.

Describe a bullish and bearish candle. Also, explain its anatomy. (Original screenshot required)

BULLISH CANDLE
IMAGE SHOWING THE NATURE OF BULLISH CANDLES
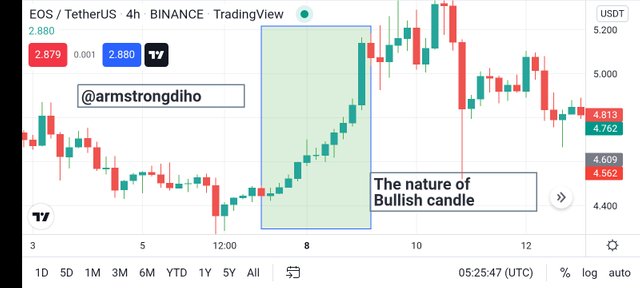
In the crypto ecosystem, generally, the word bullish candle indicates the buying pressure or the buying interest within a specific period. Perhaps, we can observe this in a market when the candle forms series of green candles based on default settings as such creates higher highs as a result of the buying pressure.
Moreover, when bullish candlestick forms, it doesn't favour short (sell) position instead it favours only traders who are in long (buy) position. The bullish candlestick is used by the traders to identify when the market is in an uptrend, however, a well savvy trader can make use of the bullish candle when formed to forecast a trend reversal that's when the market is in the downtrend direction to an uptrend direction.
The bullish candle most especially the long one implicates that the market activity is controlled by the buyers within the timeframe. Let's check out the crypto chart.
IMAGE SHOWING BULLISH CANDLES WITH BUYING OPPORTUNITIES
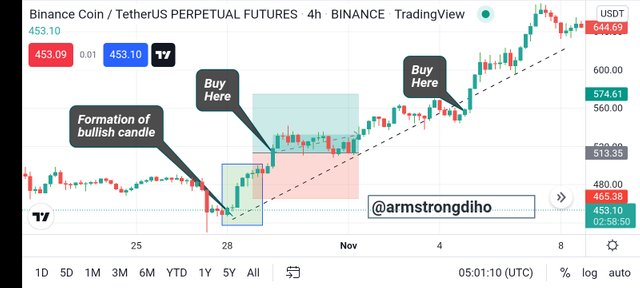
We can see from the chart, that when there is a series of bullish candle forms in most times lead to a bullish trend. However, we can also observe that the bullish candle when formed with consistent upward moves, gives traders gives buying opportunity.

BEARISH CANDLE
IMAGE SHOWING THE NATURE OF BEARISH CANDLES
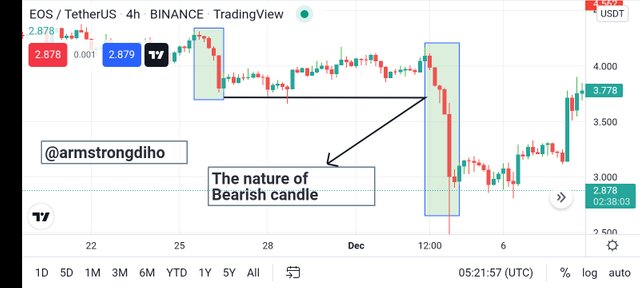
When the candle is not in a bullish nature, it will be in a bearish nature which is the opposite. However, in the affair of crypto, generally, the word bearish candle, demonstrates the selling pressure or the selling interest within a specific time. We can identify the bearish in a market when the candle forms series of red candles based on default settings as such creates lower lows as a result of the selling pressure.
Nevertheless, when the bullish candlestick is formed, it doesn't favour the long (buy) position instead it favours only traders who are in short (sell) position. The bearish candle is used by the technical analysts to identify when the market is in a downtrend, however, a well savvy chartist can make use of this candle when formed to predict a trend reversal that's when the market is in the uptrend direction to a downtrend direction.
The bearish candle most especially the long one entails that the market activity is controlled by the sellers at that timeframe. Let's check out the crypto chart.
IMAGE SHOWING BEARISH CANDLES WITH SELL OPPORTUNITIES
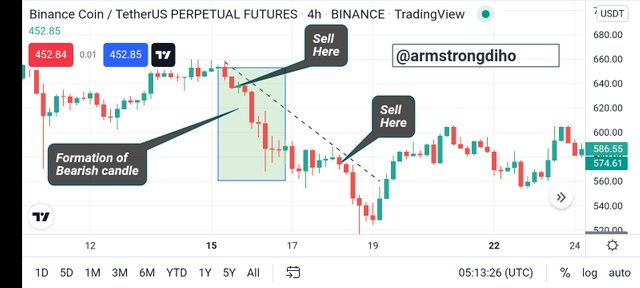
We can see from the chart, that most times when there is a series of the bearish candle formed it lead to a bearish trend (downtrend). However, we can also observe that the bearish candle when formed with consistent downward movement, provide a selling opportunity to the traders.
However, to understand the bullish and bearish candles better let's check out their anatomy which will simplify it better.

ANATOMY OF BULLISH AND BEARISH CANDLE

Having explained the bullish and bearish candles, I will demonstrate their anatomy with the illustration. Generally, a typical candle either bullish or bearish possesses the body and the weak (shadow). The body consists of the open, and close price while the weak consist of the low and high price. The weak remain the same for both the bullish and bearish instead only the body (open and close) position differentiate both.
Now, we have understood the body and the weak so let's check out the bullish and bearish candle respectively.

BULLISH CANDLE ANATOMY
IMAGE SHOWING THE ANATOMY OF BULLISH CANDLES
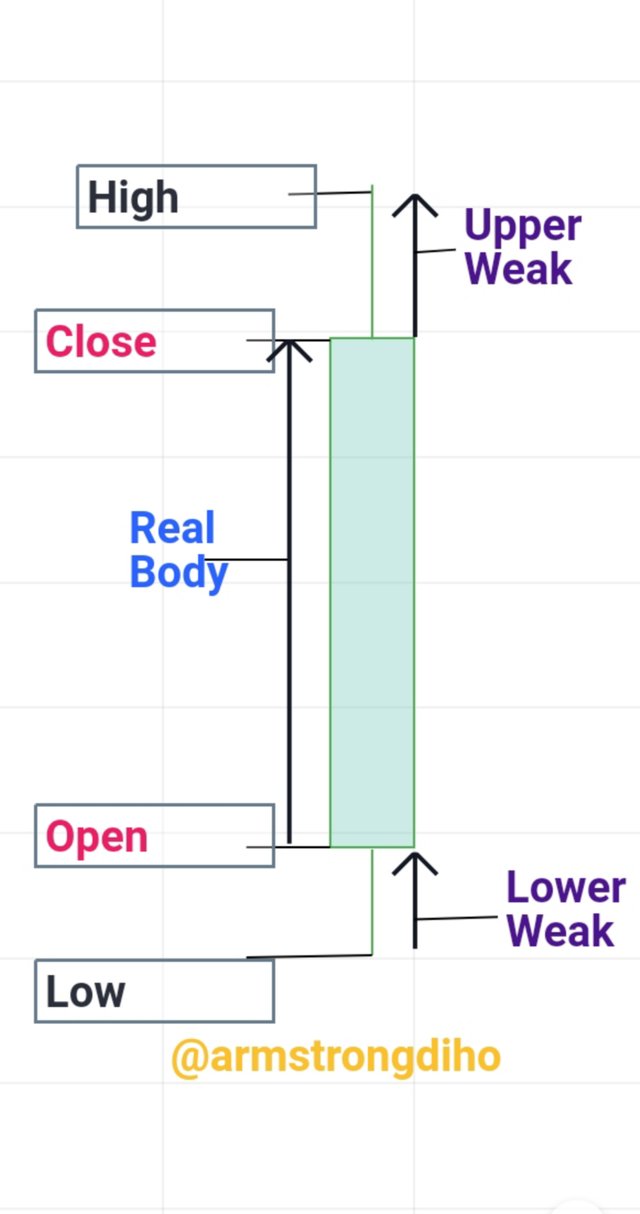
The bullish candle possesses the open, low, high, and close. Just as I explained that the weak position doesn't change, however, the opening of the bullish candle is below the close indicating that the buyers lifted the asset price upward within a given timeframe. Also, note continuous bullish candles result in an uptrend which provides buying opportunities to traders.
Open & Close Price: The open price of the asset within a timeframe is always below the closing price.
Low weak: Here, shows the asset's lowest price within a specific timeframe.
High weak: It shows the asset's highest price within the timeframe.
Let's check out the following illustration for a clear understanding.
IMAGE SHOWING THE REACTION OF BULLISH CANDLES
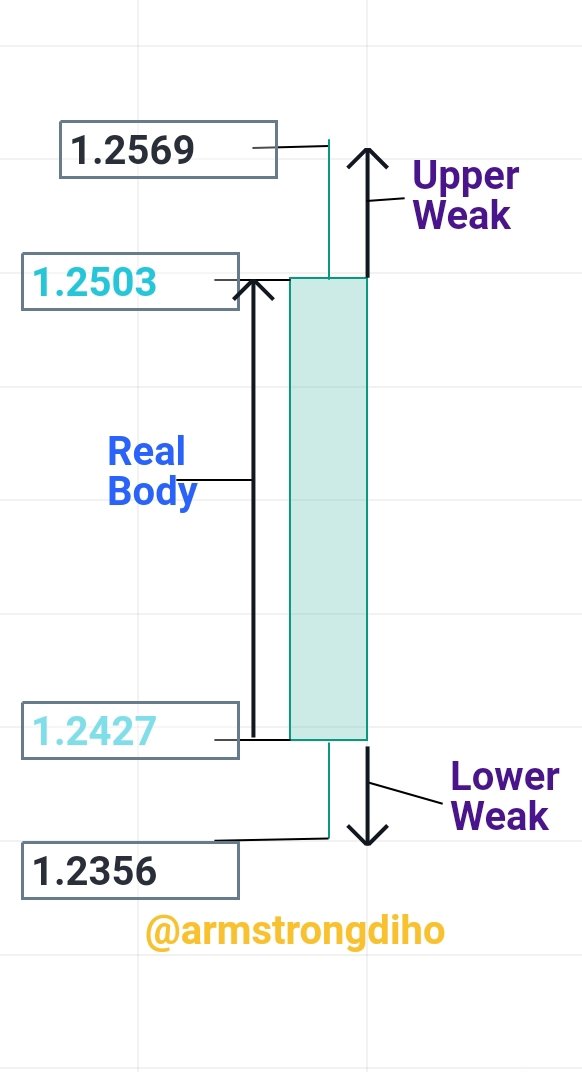
The image shows that the price of Tomochain (TOMO/USDT) was opened at the ranged of $1.2427 and the buyers later pushed the price high at the rate of $1.2569 within a given timeframe(4h). The sellers never relented instead they pulled the price at the rate of $1.2356 low, immediately the buyers never accepted that instead of closing the price at the rate of $1.2503 which means they dominated the market within this timeframe, however, there was a price rejection as well in the contest but in all the buyers won.

BEARISH CANDLE ANATOMY
The bearish candle is the opposite of the bullish candle. Hence, it possesses the open, low, high, and close just as the bullish. The weak position doesn't change, however, the close of the candle is below the open indicating that the sellers lifted the asset price downward within a given timeframe. Also, note continuous bearish candles result in a downtrend which provides a selling opportunity to the trader.
IMAGE SHOWING ANATOMY OF BEARISH CANDLES
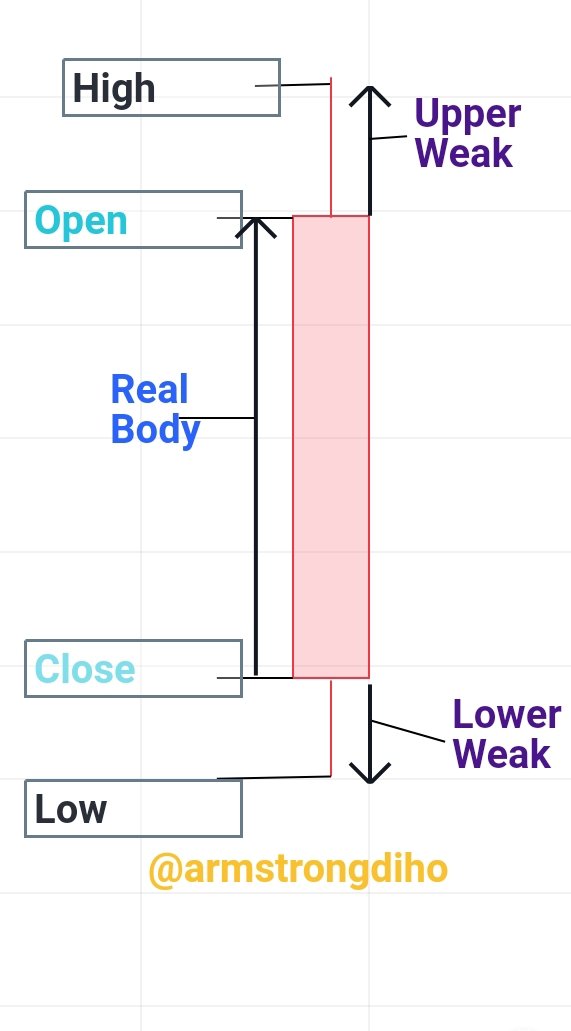
Open & Close Price: The close price of the asset is always below the open price.
Low shadow: This shows the asset's lowest price for a specific period.
High shadow: This aspect indicates the asset's highest asset price for a given timeframe.
IMAGE SHOWING THE REACTION OF BEARISH CANDLES
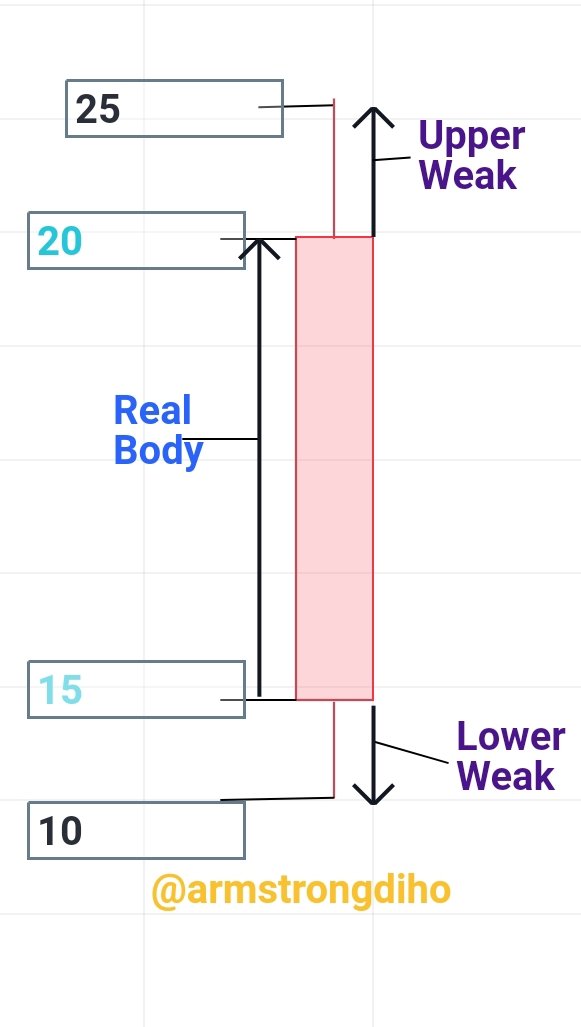
The image entails that the price of FTX Token (FTT/USDT) opened at the rate of $20 and the sellers lifted the asset price low at the rate of $10 but the buyers pulled the price high at $25, however, the fight didn't end here. The sellers closed the price of the asset at the rate of $15 which means they controlled the market within this specific time, perhaps, there was a price rejection in the contest but in all the sellers won.

CONCLUSION

Japanese candlesticks are very important tools when in the affairs of crypto trading, however, chartists or technical traders can't do without them. The chartist makes trade decisions with the data derived or analysed from the Japanese candle. This shows that an analyst can use the data to know the set of traders that are in influencing the market for a specific timeframe.
Furthermore, understanding and interpreting the candlesticks enables the trader to have the advantage of minimizing the risk of being liquidated and maximizing profits, as well as to identify buy and sell opportunities. Also, to know an entry and exit point. Nevertheless, it is recommended to understand how it works before embarking on trade.

THANKS FOR READING THROUGH

Downvoting a post can decrease pending rewards and make it less visible. Common reasons:
Submit