Understanding of RSI + Ichimoku Strategy

There are several technical indicators designed to perform different work in the trading system, as such, serves as powerful technical analysis tools that enable traders/critics to interpret price directions in the market.
However, technical indicators have some limitations such as providing false signals mostly in a highly volatile market and as a result that it is not ideal to make use of one indicator as a standalone to make trade decisions. Also, No Indicator is 100% accurate.
Nevertheless, one of the possible solutions to prevent such false signals is by combining technical indicators with other technical analysis tools such as price action or employing two indicators can help to eliminate false signals in the market, which brings us to the concept of the RSI + Ichimoku indicator combined to establish a trading strategy. Let's check them out for better knowledge.
IMAGE SHOWING THE NATURE OF RSI AND ICHIMOKU INDICATOR
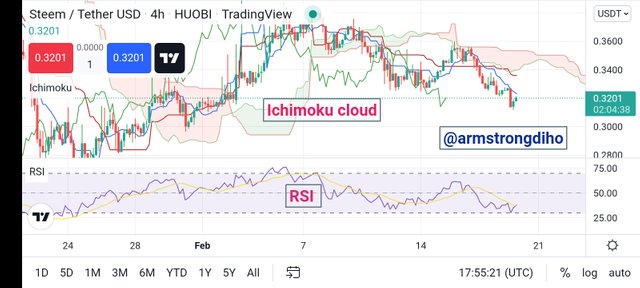
One of the momentum-based indicators mostly used by traders, that calculates price momentum by demonstrating market conditions such as the price overbought and oversold condition in the market over a period is called the RSI indicator. The RSI indicator alone is not ideal to make trade decisions regardless of its usefulness mostly in a range market as it can signal false signals when used in a trending market.
On the other hand, the Ichimoku indicator is a powerful trend-based indicator that enables traders/ critics to identify the market trend and future dynamic support and resistance. However, the Ichimoku indicator has its downgrade in trading as it lags behind price movement and gives a late signal which indicates that signal data generated by the indicator is revealed after the price has already occurred.
To achieve a good trade success with the RSI and the Ichimoku indicator, combined them establish a strong trading strategy whereby identifying the direction of price as well as detecting the formation of a current trend. With this effect, traders can bring about an early buy and sell position into the market.

Flaws of RSI and Ichimoku

Indicators are prone to signal false signals most especially when used as a single one as a standalone. So, since No can give you 100% accuracy, it means they all have flaws. Let's check the flaws of the RSI and Ichimoku indicators respectively.
Flaws of the RSI Indicator

The Relative Strength Index (RSI) is a momentum-based indicator that indicates the momentum of the market condition by using the oscillating line above 70 to indicate the price overbought and 30 to show the price oversold conditions. That's the RSI line oscillates around 0-100 where an above 70 (overbought) and below 30 ( oversold) is the vital point to consider.
Hence, we can identify the strength of the trader (buyer and seller) and the side which is in control of the market at a given timeframe. So, traders can make use of the RSI to identify the status of the market condition.
Let's check out its flaws.
√ Using the RSI indicator, identifying a clear trend for a long time is not possible. That's the RSI cannot estimate the selling and buying pressure respectively in the market and the distance a trend will go into the future.
√ The strength of a trend and the overbought and oversold signal will be false during a strong trending or volatile market, as such, can also give false signals which can lead to a wrong trade decision. That's RSI line might remain at the overbought and oversold condition for a long duration even when trend reversals has occurred.
√ The RSI doesn't submit powerful signal information which we need to define good trading positions.
√ The RSI doesn't give key points about the next volume to be experienced in the market.

Flaws of the Ichimoku Cloud Indicator

The Ichimoku cloud is a trend-based indicator designed to identify several price information like the support and resistance level, trends, and momentum in the market. The indicator does this using 5 lines which serve as moving averages of prior price data points and a trend signal is generated when the intersection of price above and below the moving averages. That's the position of cloud below the price signals an uptrend, and the position of cloud above the cloud signal a downtrend.
Let's check out the flaws of Ichimoku
√ The Ichimoku cannot identify the inception of a current trend on time.
√ The indicator is limited to searching the movement of traders (buyers and sellers) in the market.
√ Ichimoku Cloud submits signal information on the factor of historical data point which the data point might occur again, as such, might provide false signals.
√ The indicator delivers late signals as it relies on historical data points which might result in a late entry position.

Trend Identification Using RSI+Ichimoku Strategy

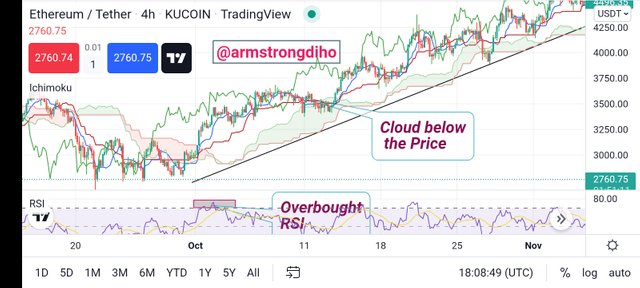
Using the RSI and the Ichimoku strategy, we can identify possible trends only when you understand how it works. Well, when the RSI is above 70, the price is said to be observing an overbought condition. Conversely, with a consistent rise of price as a result of the strong bullish trend, the RSI is detected to remain in the overbought condition
On the other hand, when the Ichimoku is below the price it signals an uptrend. Nevertheless, the velocity of the bullish trend will be reflected in the expansion of the Ichimoku cloud. Let's check out the crypto chart below for a better understanding.
IMAGE SHOWING UPTREND SIGNAL
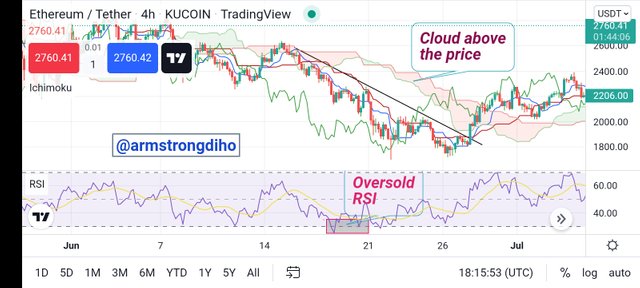
On the other hand, a downtrend is observed when the RSI is below 30 it indicates that the price is in an oversold condition. Conversely, with a consistent fall of price as a result of the strong bearish trend, the RSI is detected to remain in the oversold condition.
So, when Ichimoku clouds above the price, it suggests a downtrend. The momentum of the bearish trend will be reflected in the expansion of the Ichimoku cloud. Let's check out the crypto chart below for a better understanding.
IMAGE SHOWING DOWNTREND SIGNAL

Using MA with RSI+Ichimoku Strategy

The moving average is another important trend-based indicator that works to picture trends and trend reversals in the market within a given timeframe. So, the combination of moving average with RSI+Ichimoku strategy will boost the effectiveness and efficiency of the trading signal, as such, can be used to eliminate false signals to an extent from the Ichimoku cloud. Thus, 100 period MA will be used with the RSI+Ichimoku strategy.
Note that the addition of the MA performs as a confirmation which is to filter out inaccurate signals information by this strategy.
Looking at the crypto chart below, we have put 100 periods MA (black line ) on the chart. We can identify that 100 MA and the Ichimoku cloud respectively is above the price in correspondence with the RSI above 70, which is useful to confirm that price is in a downtrend state.
IMAGE SHOWING MA with RSI+Ichimoku Strategy
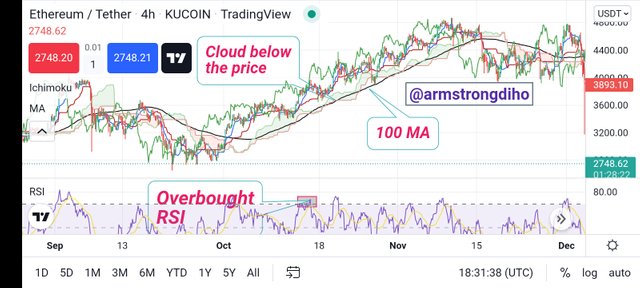
Adding the MA indicator with this strategy is very useful to traders as it helps to filter false market signals.

Support and Resistance with RSI + Ichimoku Strategy

Support and Resistance are very significant measures to look for in trading, as they illustrate regions of buying and selling pressures of price. However, these levels can be identified using RSI+Ichimoku Strategy.
To identify these levels, the market can either be trending or ranging. So, a trending market, the Ichimoku cloud will be used to identify support and resistance. Similarly, in a range market, the RSI will be used to identify support and resistance levels.
Trending Market
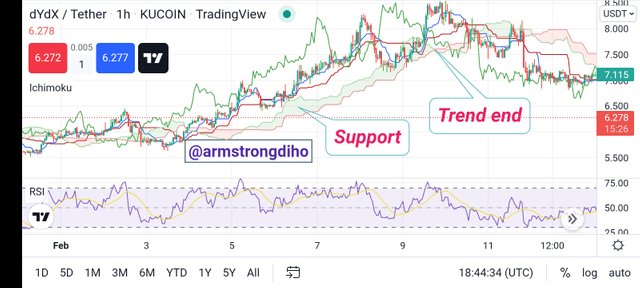
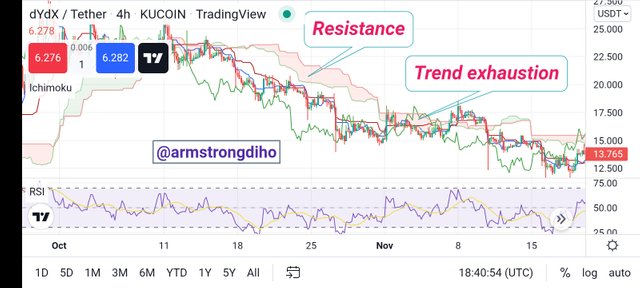
Here, the Ichimoku cloud serves as a support and resistance level. Perhaps, the Ichimoku performs as support and resistance when the cloud is green and red respectively. Thus, when the market is in an uptrend and downtrend, price finds support and resistance respectively on the Ichimoku cloud. Also, we indicate a strong trend when prices are distant away from the cloud and once the cloud is broken means a trend reversal. Moreover, the weakness of the trend is indicated when the price action moves toward the Ichimoku cloud.
Let's check out the crypto chart below for better clarification.
IMAGE SHOWING Support and Resistance with RSI + Ichimoku Strategy IN A TRENDING MARKET
RANGE MARKET
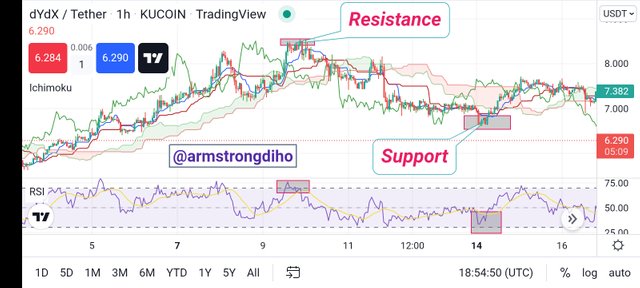
Here, the Ichimoku is limited and can not convey an accurate trading signal, which means we will be using the RSI. The RSI function better in a ranging market and an overbought and oversold condition acts as support and resistance.
So, from the crypto chart below, we can see the RSI acting as a support and resistance using the oversold and the overbought conditions. To get overbought and oversold conditions, we used the RSI line of 70 and 30 respectively. We observed the price rejection from both conditions which means in a ranging market the RSI works better.
IMAGE SHOWING Support and Resistance with RSI + Ichimoku Strategy IN A Ranging MARKET

Using this Strategy for Intraday Trading

Every trading strategy is perfect only when you understand how it works and use it in the right way. Then a successful trade rate will be achieved. However, being savvy and well-disciplined matters to achieving a better trading rate. I believe this strategy will be very good for intraday traders as it is used to spot trends, and dynamic support and resistance levels. Also, from the previous question, we have seen how we can use this strategy significantly in trend and range market respectively.
Intraday traders can not only use this strategy to spot trends, support and resistance levels but also to locate entry and exit points in the market. Perhaps, we can observe the combination of the Moving Average with this strategy boosts it to eliminate false signals in the market.
Technical indicators are very powerful and profitable for traders if they worked in the right manner.

Demo Trade Using RSI + Ichimoku Strategy

I will perform a demo trade using the strategy RS+Ichimoku indicator to place a trade. The chart analysis and the trade will be obtained on Tradingview.com and the trading view paper trading.
BNB/USDT BUY TRADE
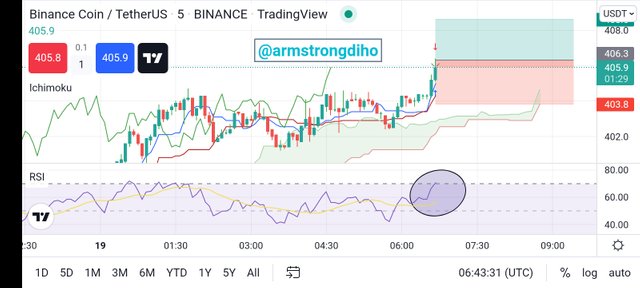
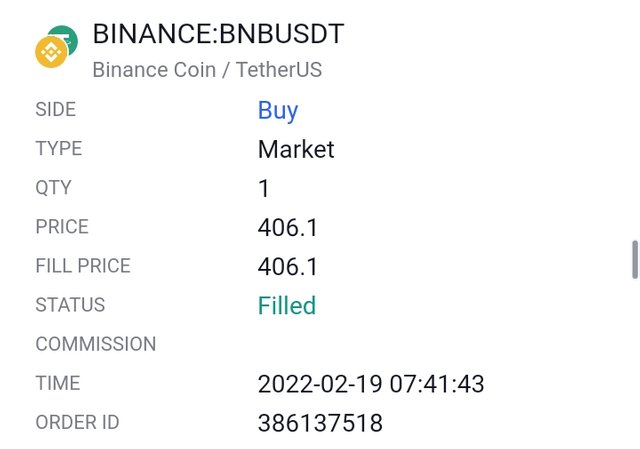
On this BNB/USDT chart, I observed the RSI was in an overbought region which also sounds high in buying interest. I looked down to the Ichimoku and saw that cloud is below the price which means the price breaks the cloud leading to a reversal from bearish to bullish. Then I open a buy position with a stop loss placed below the cloud.
BTC/USDT SELL POSITION
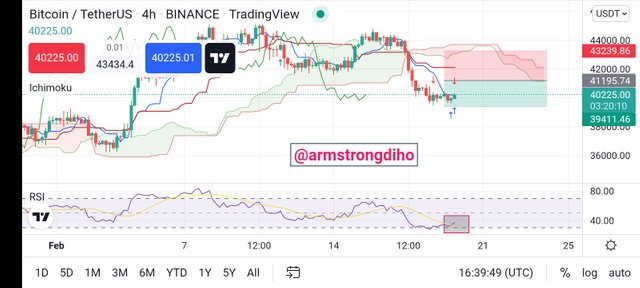
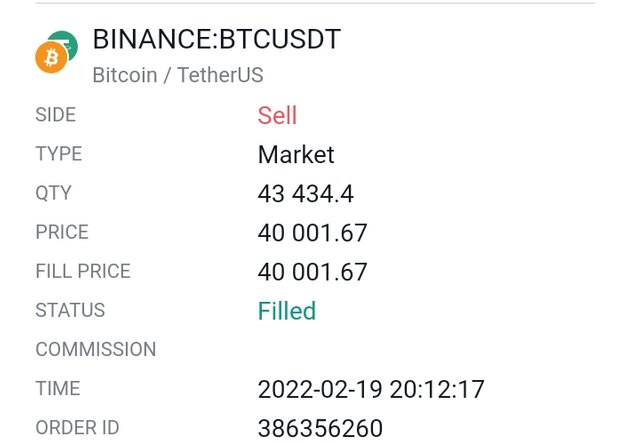
From the BTC/USDT chart, the RSI was below the 40 line which shows a bearish signal in the market. For confirmation, I moved to Ichimoku and identified that the cloud is above the price. I opened a sell position with a stop loss placed above the cloud.

CONCLUSIONS

Technical indicators provide better signals when combined with other technical tools or other indicators. However, we have combined momentum and a trend-based indicator which is the RSI+Ichimoku. These two indicators signals help to filter out false signals.
Though they both have some flaws when combined covers it's each other weakness especially when we added the Moving Average indicator. So, it is clear that No indicator can be 100% accurate when used alone, however, this strategy will enable traders to get trading signals not only on a trending market also in a ranging market.
Nevertheless, the success rate of this strategy banks on the traders' understanding of how it works and at the same time should be able to suit it with their trading strategy. Always ensure proper risk management adheres because crypto assets are characterised by price fluctuations and the trade might go against your prediction.
THANKS FOR READING THROUGH
Cc @abdu.navi03
All images are taken from
