Explain the Williams %R indicator by introducing how it is calculated, how it works? And what is the best setting? With justification for your choice.
The Williams %R indicator is a technical trading indicator and is referred as
Williams Percentage Range indicator. This indicator is classified as a momentum indicator that accelerates from 0-100 indicating the traded market such as overbought and oversold as well as other different trading signals. When the reading of the indicator moves at the range of 0-20% indicates overbought while 80% -100% indicates oversold.
However, the indicator was developed by an American stock and commodity trader named Larry Williams and he realized it in the year 1973. He has developed numerous technical indicators and the Williams %R indicator is one of them which has enhanced the functionality of trading assets.
CALCULATION
To simplify this indicator, Larry Williams developed a suitable mathematical equation to indicate price momentum (Williams %R). Hence, calculating the Williams %R requires the use of maximum and minimum price values of previous "N" periods, and Price close for the day of the specified period. Let's check out the formula he developed.
Williams %R = (HP- PC) / (HP - LP) × (-100)
Where:
HP = Highest price of previous "N" periods
PC = Daily closing Price
LP = Lowest price of previous "N" periods
Note: The "N" is the observed previous period for both the highest and lowest price value.
For better clarification let's check out the following example.
Suppose, The Williams % R is to be calculated for yesterday and a given observations period of 14 days. During the observation period, it was noted that the highest price value was $30.6 and lowest price value was $20 and the closed price is at $25.2. The Williams %R will be calculated as follows;
Soln.
Recall, I'm using the below formula.
Williams %R = (HP- PC) / (HP - LP) × (-100)
HP= 30.6
LP= 20
PC= 25.2
%R=?
Williams %R = (($30.6- $25.2) / ($30- $20)) x (-100)%
%R = ($5.4/10$) x (-100)%
%R = (0.54) x (-100)%
%R = -54%
HOW IT WORKS
Understanding how it works makes it r for the trader. However, The Williams %R is an indicator that is ranged to signals overbought and oversold within the observed period. It has a scale of 0-100%.
when the scale is between 0-20%, shows an overbought meaning the buyers are the one influencing the market at that given period, as such provide buy signal. Perhaps when the scale is between the range of -80-100%, shows oversold meaning the sellers are the ones influencing the market at that given timeframe, as such tells the trader to place a short trade.
The Willams %R doesn't only show the dominance between the buyers and the sellers, it also indicates tells the trader the current strength of the trend within the given period. For instance, when the indicator moves -20 or above indicates a strong uptrend. Also when it falls and failed to respect above -20 indicates danger for those in the long position because the downtrend transition is about to take place.
Hence, any trader who understands how this indicator works by interpreting the ranges of 0-100% within a specific period will obtain profitable trade since it provides buy signals and sell signals.
Williams %R Settings
The Williams has 14 periods as default which is the best setting chosen by Larry Williams. I believe the 14 periods might have favoured L. Williams which makes him prefer the period. However, there is an adjustment in the trading system which has made lots of traders or analysts test and confirm another period settings suitable to them.
So the best setting depends on the trading strategy of the trader. For instance, A scalp trader will not use the same period as the swing trader because both work with a different timeframe. Meaning a short-term trader needs to use a shorter period to get fast signals, whereas a long-term trader requires higher settings.
Also, the best setting depends on how the trader understands and interpret how the indicator works.
How do you interpret overbought and oversold signals with The Williams %R when trading cryptocurrencies? (screenshot required).
The Williams %R is ranged to provide overbought and oversold signals respectively. Let's check out the interpretation of the overbought and oversold signals.
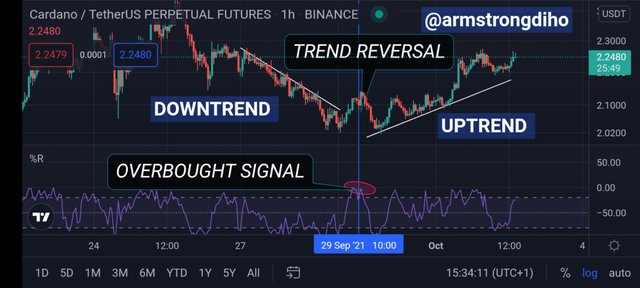
OVERBOUGHT SIGNALS
The Williams %R indicates overbought signals when the Indicator value moves between 0 to -20%. When the indicator moves to -20 signify a strong uptrend which means there will be consistent swing higher highs & swing higher lows generated as a result of the high pressure of the buyers in the market within that specific period.
Also, when the market is experiencing an uptrend, expect a trend reversal because the market must fall. But when the market falls and fails to bounce back to -20% shows an uptrend reversal to downtrend. And that moment requires the trader to place a short trade.
For a valid short signal, it's advised to wait for the price of the asset to observe a downtrend movement and wait when the %R value gets back after reaching the overbought levels. Let's check out the chart below.
OVERSOLD SIGNALS
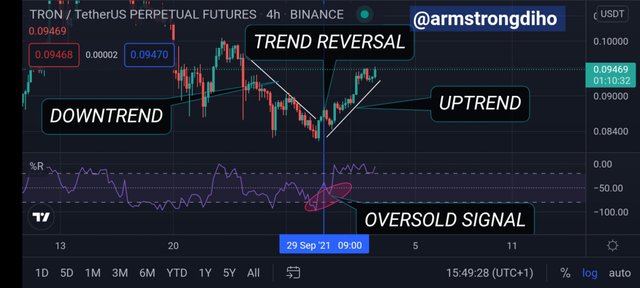
The Williams %R indicates oversold signals when the Indicator value moves between -80 to -100 %. When the indicator moves below -80% and -100% signify a strong downtrend which means there will be consistent swing lower highs & swing lower lows generated as a result of the high pressure of the sellers in the market within that specific period.
Also, when the market is experiencing a downtrend, expect a trend reversal because the market might rise. But when the market fails to pull back to -80% shows a downtrend reversal to an uptrend. And that moment it requires the trader to place a long trade.
For a valid buy signal, it's advised to wait for the price of the asset to observe an uptrend movement and wait when the %R value gets back after reaching the oversold levels. Let's check out the chart below.
What are "failure swings" and how do you define it using The Williams %R? (screenshot required)
Generally, swings are high and low points generated as a result of the influence of the buyers and sellers in the market as such causing the price to rise and fall. Hence, when the price of an asset fails to respect a certain high or low point respectively, it is referred to as Failure Swings.
However, in the case of the use of the Williams %R, the failure swing is a condition that occurs when the indicator values fail to reach the range of -20% and -80% respectively. That's when the indicator value rises but can not approach the high limit of -20% or the price falls without dropping to the low limit of -80%.
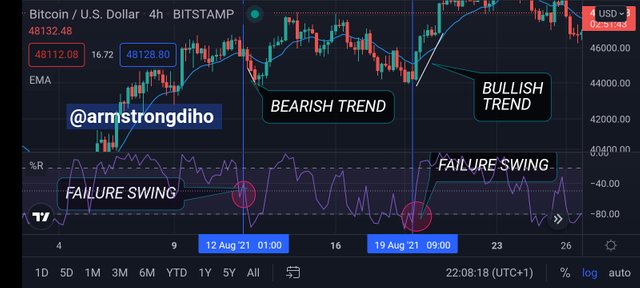
There is the observation of weakness of trends as a result of earlier reversal which provides signals as well. Hence, when the Williams %R indicator value reaches the lower limit (oversold -80%) but fails to respect the low limit before a downtrend reversal to uptrend direction which indicates buy signals.
Also, when the Williams %R indicator value reaches the high limit (overbought-20%) but fails to respect the high limit before an uptrend reversal to a downtrend direction which indicates sell signals.
How to use bearish and bullish divergence with the Williams %R indicator? What are its main conclusions? (screenshot required)
In the crypto sphere, bearish and bullish divergences spotted with the Williams %R occurs when there is a great difference in direction of the indicators value and the price movement. Hence, with the relevant informs derived from the divergence, there is a possible opportunity to spot early trend reversal before it reflects in the price movement.
BULLISH WILLIAMS %R DIVERGENCE
A market movement is said to be bullish divergence when the Williams %R indicator scales signify a bullish move, but at the same time, the price movement on the crypto chart is falling/ dropping. With this effect, it represents that there might be a trend reversal as such can lead to possible buying opportunity to most price action traders while others might wait for the clear uptrend.
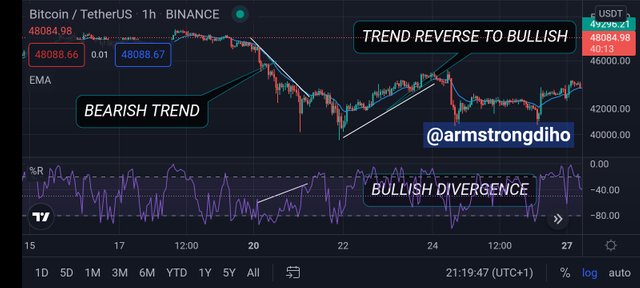
From the image above, we observed how the price movement falls but the Williams %R indicator scale shows uptrend signals but there was uptrend transition follows. With this, we can say that the market is observing a bullish divergence.
BEARISH WILLIAMS %R DIVERGENCE
A market movement is said to be bearish divergence when the Williams %R indicator scales signify a bearish move, but at the same time, the price movement on the crypto chart is rising. With this effect, it represents that there might be a trend reversal as such can lead to possible selling opportunity to most price action traders while others might wait for the clear uptrend.
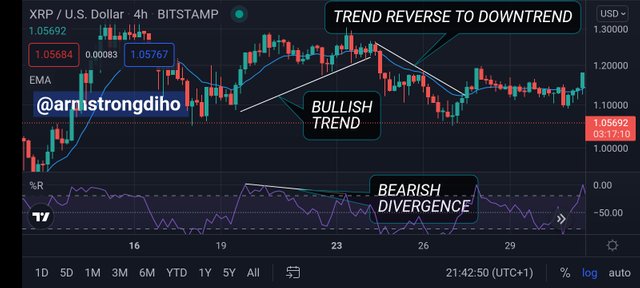
From the image above, we observed how the price movement rises but the Williams %R indicator scale shows bearish signals but there was uptrend transition follows. . With this, we can say that the market is observing a bullish divergence.
MAIN CONCLUSIONS ON DIVERGENCES
Furthermore, through the divergence, a trader can use the Williams %R to identify early trend reversal but it is ideal to have a proper confirmation before making any trade decisions to avoid false signals or fake-out.
How do you spot a trend using Williams %R? How are false signals filtered? (screenshot required)
The Williams %R is used not only to identify trend reversal via the divergence but also to spot trends via failure swings and divergence. First, to spot a trend using the Willaims %R requires the trader to be savvy with the indicator. However, to spot a trend using the Williams %R, the movement of the ranged lines of the indicator should be in correspondence direction of the present price movement.
In an uptrend, the trend is known as a strong trend when the ranged line of the Williams %R indicator is above the -50% line, while in the aspect of a bearish trend, a strong trend is when the ranged lines of the indicator are below the -50% line.
To filter out false signals, it is ideal to make use of other reliable indicators like the EMA, MACD, etc. as a means of confirmation before placing any trade.
For better classification, let's check out the crypto charts where I will be combing the Williams %R with the exponential moving average to spot and filter false signals.
FALSE SIGNAL
The chart below shows the EMA14 Line Doesn't Confirm The False Trend Reversal Signal Of The Williams %r Indicator.
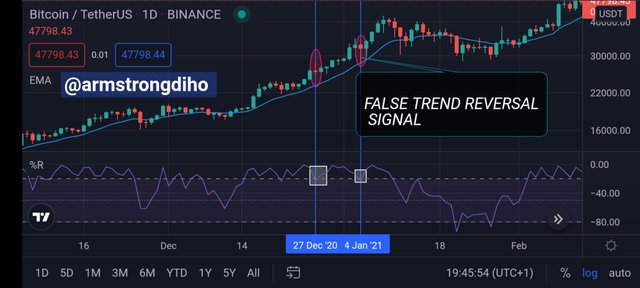
Looking at the crypto chart of Daily BTC/USDT, we can see that the Williams %R indicator has given overbought signals twice that signify downtrend transition. But the reversal never took place though the EMA doesn't confirm such trend reversal. As such the Williams %R is not reliable to be used as a standalone indicator when making trend decisions just as we can see how the price continue to rise.
GOOD SIGNAL
The chart below shows the EMA14 Line Confirm The False Trend Reversal Signal Of The Williams %r Indicator.
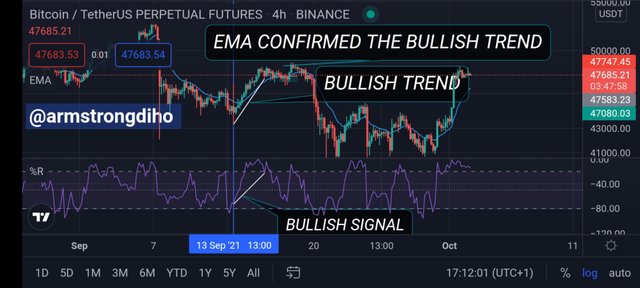
Looking at the BTC/USDT graph chart we can see that the Williams %R indicator has given overbought signals. The EMA confirmed the price movement is on uptrend transition. As such it is a better chance to place long the trade.
Use the chart of any pair (eg STEEM/USDT) to present the various signals from the Williams %R indicator. (Screen capture required)
Using the Williams %R indicator, a trader can picture out signals through trend continuation and trend reversal. The Williams %R uses failure swing and divergence to indicate trend continuation and trend reversals respectively. But to identify the buy and sell signals, will be using the overbought and oversold condition. Let's check it out with the following crypto charts.
DASH/USDT Daily chart - Overbought condition showing a buying opportunity.
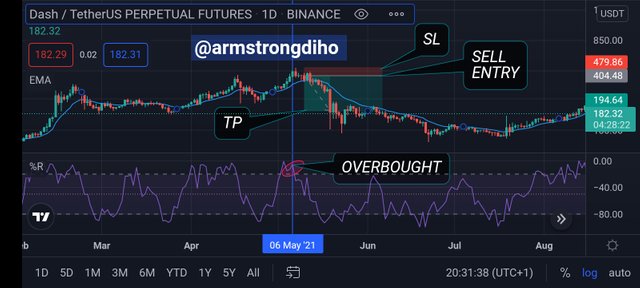
In the crypto chart, we can see that it is in a bullish trend. Also, the Williams %R indicator gives a signal that the market conditions at that timeframe are overbought which indicates a valid buy opportunity. Meaning the buyers are putting much pressure on the market.
BTC/USDT 1D chart - Oversold condition showing a selling opportunity.
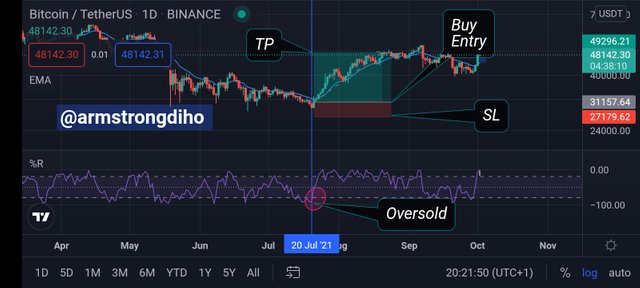
In the crypto chart, we can see that it is in a bearish trend. Also, the Williams %R indicator gives a signal that the market conditions at that timeframe are oversold which indicates a valid sell opportunity. Meaning the sellers are putting much pressure on the market.
CONCLUSION
The Williams %R is a sensitive momentum based indicator that provides lots of benefits for traders and investors to enable them to spot areas of price accumulation, overbought, oversold and early trend reversals.
However, it is ideal to use other reliable indicators like the Exponential Moving Average (EMA) indicator, etc to filter false given by the Williams %R indicator. Also, before making any trade decision, it is ideal to understand how the indicator works.
Thanks for reading
Cc:
@kouba01
Hello @armstrongdiho,
Thank you for participating in the 4th Week Crypto Course in its 4th season and for your efforts to complete the suggested tasks, you deserve a Total|8/10 rating, according to the following scale:
My review :
Good work in general in which the answers differed in their analysis and interpretation.
Thanks again for your effort, and we look forward to reading your next work.
Sincerely,@kouba01
Downvoting a post can decrease pending rewards and make it less visible. Common reasons:
Submit