
Greetings to all dear steemit fellows I home you all will be doing well.
So here is another great lecture by our Respected professor @stream4u .
Before starting my homework task let me thanks first to our Respected professor for his kind act he taught us a good lesson here I learned alot from this task so practically I'll do my best to convince our Professor that how much I understood his lecture, before starting A BIG THANKS to our Respected professor @stream4u for this beautiful lecture.So here let's start !
Question 1 : Discussed your understanding of Pivot Points.
Pivot Points.
As we know there are many technical indicators we have studied in Crypto Academy to assist us in making better trading decisions. Most of these indicators can be categorised as trend-based, momentum-based and volume-based indicators. Pivot point is a technical indicator that helps us identify the overall market trend,you can say that it can tells the exact direction of market I mean to identify overall market direction.The pivot point utilizes the closing price, intraday highs and lows in its calculation to determine the pivot point levels. The main point for this indicators is the pivot point which enables traders to determine the current market trend. There is still other levels of this indicator which includes the resistance levels and the support levels. Traders keep tab of these levels as price travel through them to make trading decisions. So there are two different things Pivot and Pivot Points. Pivot is an important price level like some weeks high or low for traders while Pivot Points are calculated levels.
Pivot is a technical indicator mostly used by intraday traders to take an entry, stop loss and book profit. Pivot Points are calculated by the previous day's low, high and closing price.
Traders use Pivot Points in combination with other indicators to make trade successful, basically there are five major types of Pivot Points – Standard Pivot Points, Camarilla Pivot Points,Demark Pivot Points,Woodie's Pivot, & Fibonacci Pivot Points,
Question 2 : Details about Pivot Point Levels.
Pivot Points Levels
As earlier I mentioned that Pivot Points are different price levels of support and resistance,using the PP as a base different levels of support and resistance calculated .
The pivot point levels are the most necessary and important aspect of this indicator. The pivot point levels play very important role in making trading and decisions. The main level of the pivot indicator is the main pivot level which is the middle and the main pivot point as shown below in the chart.
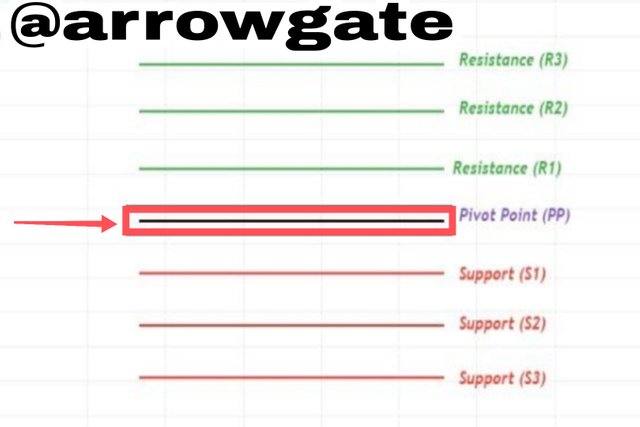
The levels above the main pivot point is the levels and the levels below the main pivot point is the support levels,as you can seen above in chart.When the price is trading above the main pivot level, it is considered as a BULISH TREND. The resistance levels above the main pivot levels serve as profit point levels and also a possible reversal point in the current market trend. When the resistance level is broken, it is considered as a continuation of the bullish trend. Similarly, when price breaks the support levels, it is considered as a continuation of the BEARISH TREND.
The Overview of Pivot Points Levels :
Main Pivot point level (PP): This is the main level to determine the current market trend. When price is trading above the PP or is considered as a bullish signal for a buying opportunity. Similarly, when the price is trading below the *PP, it is considered a bearish signal for a selling.
Support 1 (S1): As this is the first level of support below the PP,price tend to reverse to the opposite direction when it gets to this level. Similarly, when the S1 is broken, it is considered as a continuation of the bearish trend.
Support 2 (S2): This is the second level of support below the PP. price tend to reverse to the opposite direction when it gets to this level. Similarly, a break below this level considered as a continuation of the Bearish trend.
Support 3 (S3): This is the third level of support below PP. In which price tends to reverse to the opposite direction when it gets to this level. Similarly, a break below this level is considered as a continuation of the bearish trend.
Resistance 1 (R1): This is the first level of resistance above PP.price tend to reverse to the opposite direction when it gets to this level. Similarly, a break above this level is considered a continuation of the bullish trend.
Resistance 2 (R2): This is the second level of resistance above PP. Price tends to reverse to the opposite direction when it gets to this level. Similarly, a break above this level is considered a continuation of the bullish trend.
Resistance 3 (R3): This is the third level of resistance above PP. Price tends to reverse to the opposite direction when it gets to this level. Similarly, a break above this level is considered a continuation of the bullish trend.
So if you understood these Indicators you can get enough profit in tradings.i am very happy to learn these from Professor's lecture.
Question 3 : Pivot Point Calculation and R1 R2 S1 S2 Pivot Levels Calculation.
To calculate the base Pivot Point of any previous day's high,low and closing price is used.
So you can say that the pivot points can be calculated using the previous day's high, low and the close of the previous day. For example, to calculate the pivot points for Friday, the high, low and close of the Thursday trading sessions are used to calculate the pivot points for Friday's session. The formula for calculating pivot points is illustrated below.
PP = (High+Low+Close)/3
PP = The pivot point.
High = The highest price of the previous day.
Low = The lowest price of the previous day.
Close = The closing price of the previous day.
So Once we have calculated PP using the formula above, we can now easily calculate the support and resistance levels of the Pivot point indicator. The formula is given below.
S1 = 2 * PP - High
S2 = PP - (High -Low)
R1 = 2 * PP - Low
R2 = PP+ (High - Low)
S1, S2, R1, R2 are dependent on PP and that is why PP must be calculated first to get the support and resistance levels.
That's from my side.
Question 4 : How to Apply Pivot Point on Chart. (Screenshot with tag your name)
In this question whick is asked by our Professor I'll apply Pivot Point in chart, so firstly I'll open Tradingview chart to illustrate pivot Points on the chart.
So as you opened the chart then click on Indicator icon written like (fx***) on the top middle of menu bar.
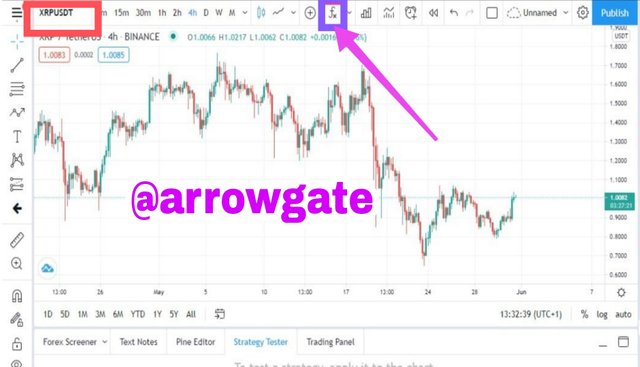
After that, the indicator and strategies page appear. Click on candlestick patterns and search for pivot points using the search tab as shown in the screenshot below. Notice there are several pivot point indicators on the Tradingview platform. Now Click on Pivot Points Standards in order to add on your add on your chart as shown below in screenshot.
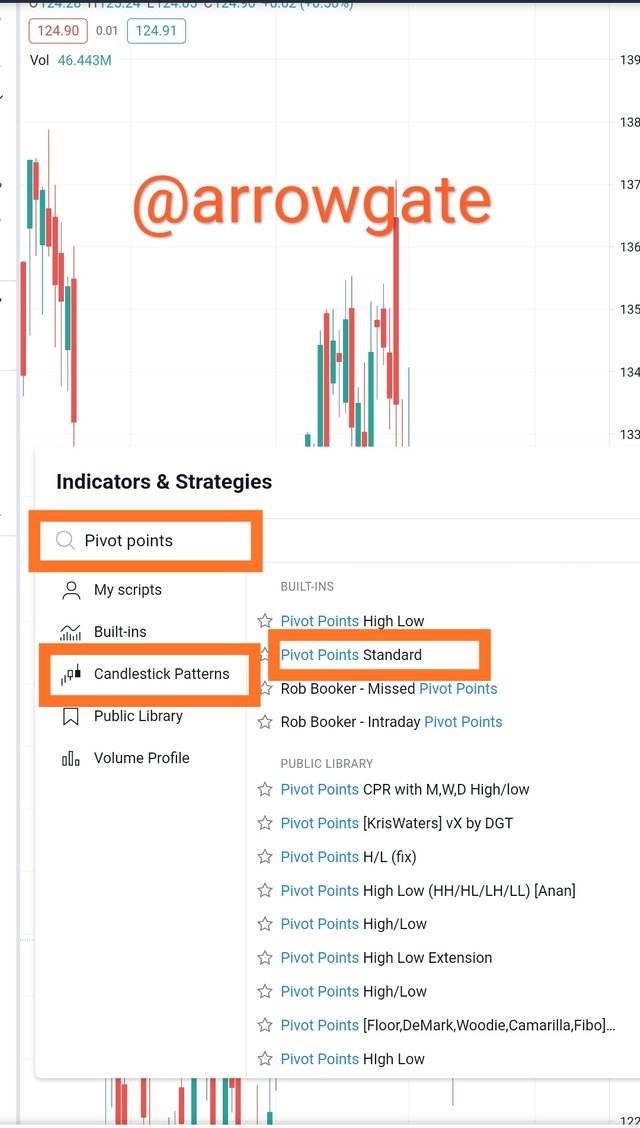
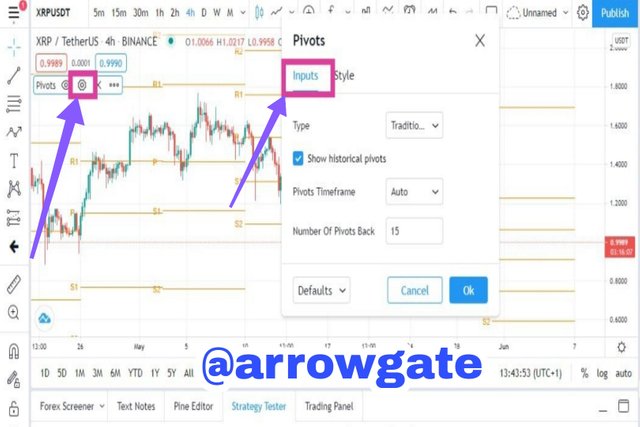
From the screenshot above, I have successfully added pivot points indicator to my chart. To configure the pivot point indicator, follow the steps below:
Click on the settings icon on the indicators toolbar.
After that, the first configuration page is the input, here a you can select the parameters that suit according to your trading style. The default input configuration is shown in the screenshot below.
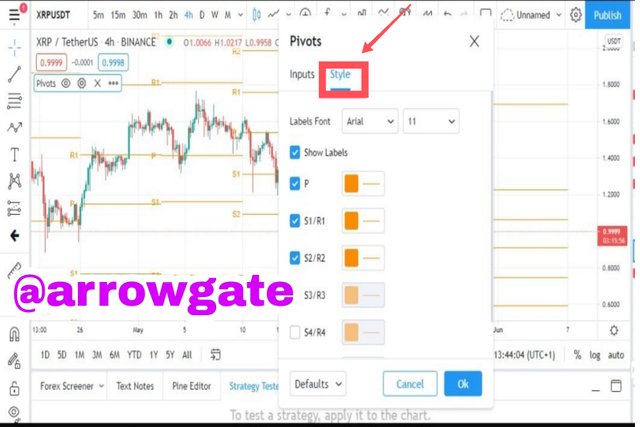
Now after that , the next configuration is the style. Here the user selects the labels fonts, font size and the colours of the levels. As you can see in the
screenshot given below.
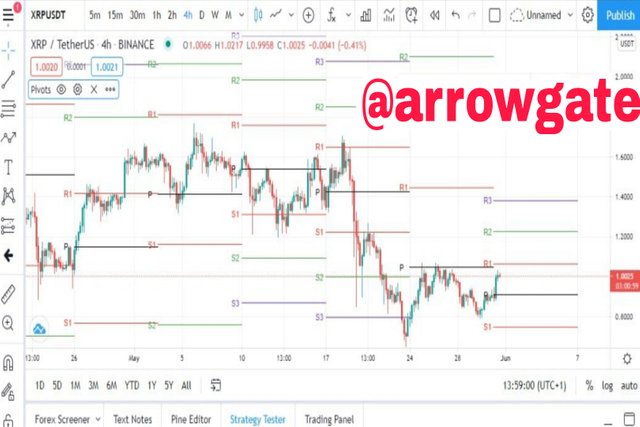
Now finally , I have successfully configured the pivot point indicator to my trading style by selecting the pivot levels and labels font colours etc.As it can be seen in screenshot given below.
Question 5 : How Pivot Points Work. (Screenshot with tag your name)
As I earlier mentioned that Pivot points use the previous day's high,low and closing price in order to calculate nthe Pivot points levels of the next trading day.As you know that the main Pivot Point level (PP) is used to determine the market trend so when price is trading above PP is considered a Bullish trend, similarly when price is trading below the PP it is considered as Bearish trend.
you can see in screenshot given below.
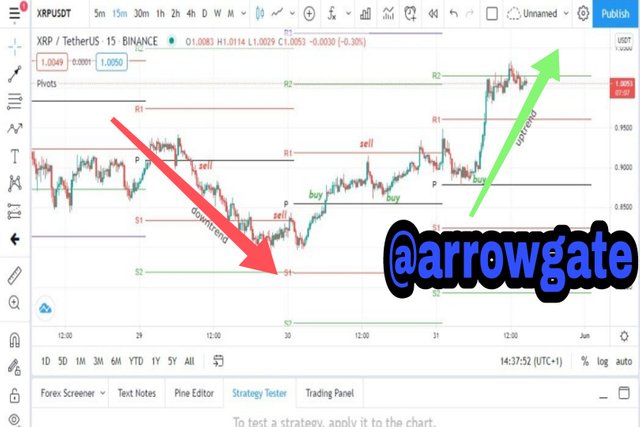
Price trading above and below PP
Similarly, the pivot points support and resistance levels help a trader to make trading decisions as these levels can be an entry-level or a profit-taking level. In a bullish trend, the price tends to reverse when it gets to a resistance level. Traders can look to go short when price approach a resistance level.
Moreover it also, a trader in a long position can look to take profit when price approaches a resistance level and these levels are considered reversal points. Furthermore, a break above the resistance is considered a continuation of the bullish trend as I earlier mentioned. You can see it in chart given below.
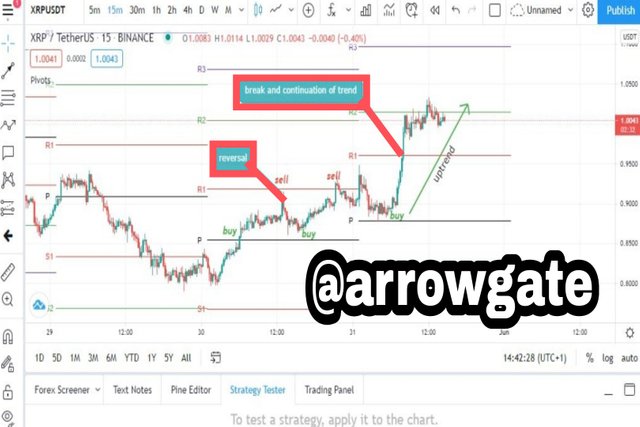
Price trading above PP
For a bearish trend, when price approaches a support level, it tends to reverse to the upside. Traders can look for a long position when price approaches the support levels. Similarly, support levels can be profit-taking points for traders who are already in a short position. so it's a break below the support level which is considered a continuation of the bearish trend.
as shown in screenshot below.
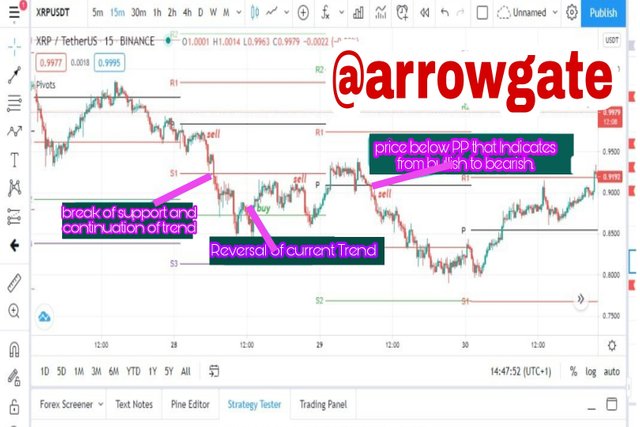
price trading below PP
As you can see from the examples given in the screenshots above, we can know very clearly that how price reacted to pivot points levels and how we can make trading decisions when price comes to this levels. We also Notice how a break of the PP levels indicates a change of trend and also how the support and resistance levels serve as reversal & breakout levels.
Question 6 : Pivot Point Reverse Trading. (Screenshot with tag your name)
As you know that we have established, the support and resistance levels of the pivot points act as reversal levels. We all know that price reverses to the upside from a support level and also, price reverses to the downside from a resistance level. Support and resistance levels are areas of buying and selling pressures and also areas of profit-taking. We will see how price react at support (S1, S2) and resistance (R1, R2) levels.
As shown in screenshot below
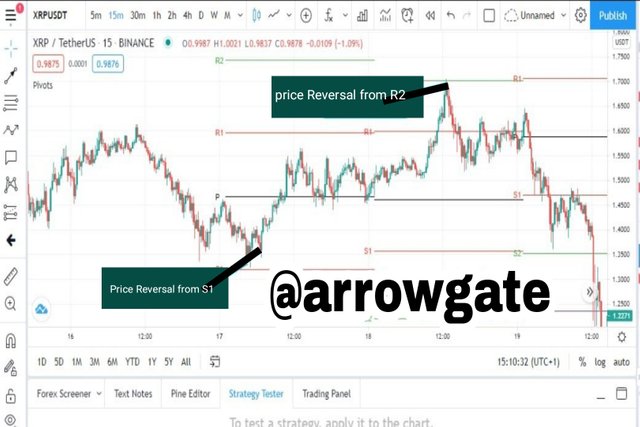
Pivot point reverse trading on XRP/USD chart
The chart above shows the 15minutes chart on XRP/USD. On the first day, price opened and was trading below PP level which indicates a bearish trend. A trader can enter a sell position to target S1 as take profit level because there are high chances price will reverse when it gets to a resistance level. After some time, price got rejected and reversed from R1. Here, traders who entered a sell position can take exit their trade and take profit. They can also look to open a buy position at this point.
After price reversed from S1 to the upside on the first day, it broke above the PP which indicates a change from bearish to a bullish trend. Traders can look to open a buy position as price broke above the PP level. Price was trading above the PP level until the second day. On the second day, price was trading above the PP and broke R1. The break indicated a continuation of the bullish trend which started the previous day. Price found resistance at R2 and got rejected. Price reversed to the downside from S2 and broke below the PP level on the next day which indicated that the trend has shifted from bullish to a bearish trend,that means trend shifted and We you can see another example in the chart below.
Pivot point reverse trading on XRP/USD chart
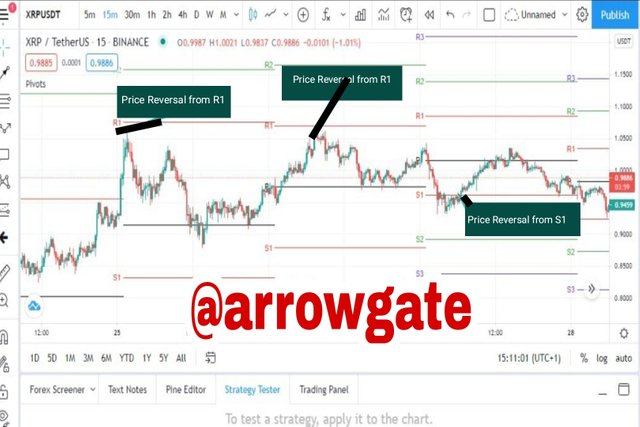
Question 7 : What could be a common Mistakes in Trading with Pivot Points.
As I came to know that indicators, none of them is a complete trading system but more over also keep one thing in mind that any Indicator or technical are 100% correct as it helps to make a decision and the same also applies to the pivot Points also as pivots points can be considered as one of the simplest Indicators to understand even new user can also easily use them but it doesn't means that it will work always,so traders shouldn't rely on only one indicator to make trading decisions. Indicators are part of a trading system and they work best when combined with other technical tools. For Pivot point trading, the common mistake a trader will make is to not use a stoploss when trading with pivot points. There's no guarantee that price will reach a support or resistance level, or price will reverse at a support and resistance level. Price can break out and continue in the original direction. The use of stoploss is necessary to protect you from losses during a breakout, especially in pivot point reverse trading.
Here is another common mistake is to rely on only Pivot Points for entry confirmation.
As price sitting at support & resistance doesn't mean you should make a buy or sell position.
Here is another common mistake that some traders completely rely on pivot points for their tradings so in this way they don't look at price,volume and supply,they use to trade only by looking at pivot Points without knowing that it will bounce back or not from resistance and support levels.So from my thoughts that one should also use another Indicator like MACD ,Stochastic and Bollinger bands along with pivot Points to get accurate entry and exit points or position of stop loss.
In short when trader don't have a good trading plan using these Pivot Points they can be in trouble so in order to get position of stop loss a trader trading with Pivot points should have a strategy for entry as well as for exit.
Question 8 : What could be the reasons For Pivot Points is Good.(Pros/Advantages)
I believe that there are many reasons for which traders use pivot points for trading and as Pivot point is considered to be a simplest and good Indicator which helps in trending due to its following reasons :
From my point of view I came to know that it is very easy to add Pivot points on chart and the trader who has a little bit knowledge of resistance and support line can easily understand the working of pivot points and can get good profit.
Pivot Points are one of the most widely used indicators for intraday trades, so capable to impact the flow of the market. By using this we can flow in the trend. Its widespread use also makes it accurate technical indicators.
*** The most importantly is that pivot point is a powerful trend-based indicator especially in a highly volatile market like cryptocurrency. The pivot point indicator makes it very easy to identify the market trends and also find areas of support and resistance levels on the chart.***
Question 9 : Apply the Pivot Points indicator in the Today chart (the day when you making this task) and set the chart for 15 minutes. Explain the market trend till the time of writing the task and how it will be next till the end of the day. You can give possibilities on both the side bearish and bullish.
Technical Analysis using Pivot Points Indicator :
In this section, I will apply pivot points indicator on XRP/USD to indicate a trend. This analysis will be carried out using 15mins chart on Tradingview platform for the past 3 days.
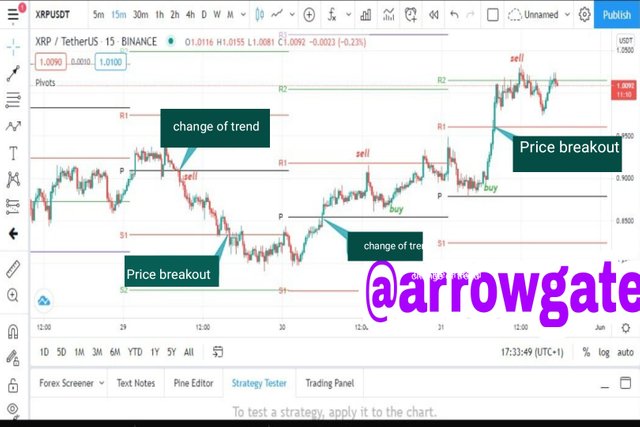
From the chart above, on the first day, the price broke below the PP level at $0.90 which signal a trend reversal from bullish to bearish. After that, price continue going and broke the S1 support level. The breakout signalled a continuation of the downtrend. After the breakout, price ranged throughout the day and couldn't reach the S2 support level.
The following day, price reversed up and broke above the PP level at $0.85. Again, at this point, the trend jas changed from a bearish trend to a bullish trend. Price traded up to R1 resistance and was rejected. Price came back down to close to the PP level which is a perfect opportunity to go long on XRP. After price slightly approaches the PP level, it reversed back to the upside to continue the original bullish trend.
Price went back to retest the R1 resistance before the end of the day. On the third ( current day), price retraced back to the PP level from R1 resistance.
Again, the pivot offered an opportunity to go long again. This time, price went back up and broke the resistance at $0.96. This breakout signalled a strong bullish trend and continuation of the bullish trend. Price continued trading up to R2 resistance level and was rejected.
As shown below in screenshot
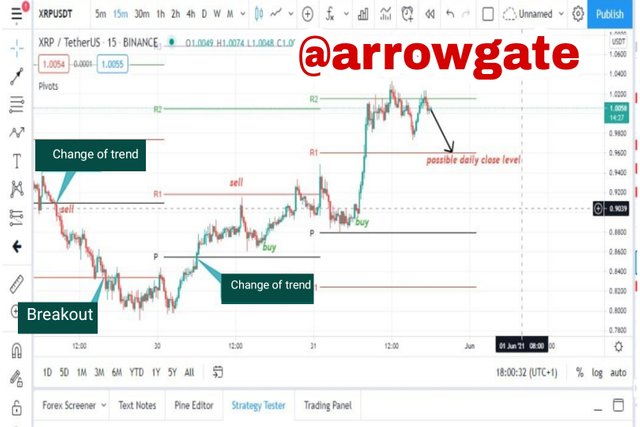
Price got rejected at R2 resistance level and retraced down. Price went back up to retest the R2 resistance level. From what we have in the chart above, I'm predicting price to reverse down to the R1 resistance level before the end of the day. We have a bearish engulfing candle at the R2 resistance which is a candlestick reversal pattern. The overall trend is bullish as price has R1 resistance level. I expect price to retest the R1 resistance level before the end of the day and continue bullish tomorrow.
That was done easily, as I earlier mentioned if you have little knowledge then you can do your best.. now I'll move to Professor's next question.
Question 10 : Weekly Price Forecast For Crypto Coin.
Weekly Price Forecast for Crypto Coin: Ripple (XRP)
Ripple is a payment settlement system with the goal of improving payment systems and facilitating the transfer of funds. Ripple aims to eliminate third party agents in the transaction process which will help to settle transactions faster. Ripple settles transaction faster than Bitcoin and Ethereum network and the transaction fees on Ripple network is relatively low compared to fees charged by traditional banks and other digital networks.
Why I have chosen XRP ?
As XRP is the native cryptocurrency that runs on Ripple network. XRP was designed to facilitate transactions on the Ripple network and can also be used as a transaction fee across the network. XRP run on XRP-Ledger which an open-source database that is not based on blockchain. The XRP ledger processes transactions every 3-5 seconds making transactions with XRP faster than Bitcoin and other networks.
Moreover it has proven to be a better payment system. I do also believe that XRP will be a bigger competitor to the Bitcoin network and many other payment networks.
My technical analysis .
Here I'll do some technical analysis on XRP/USD chart.These analysis will be performed using candlestick analysis,multi-timeframe analysis, technical Indicators and chart patterns.
just as same on tradingview.
XRP/USD: Weekly chart
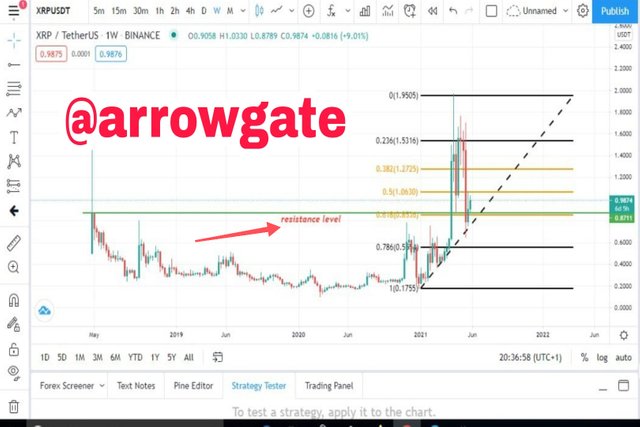
As you can seen from the weekly chart above, we can see price broke a resistance level at $0.88 for the first time since May 2018. After that, price went further up to create a high at $1.93. After that, we saw a correction as price retraced back to retest the previous resistance now turned support for a continuation of the uptrend. Similarly, the previous resistance turned support is in confluence with the Fibonacci retracement golden at 0.618 which is considered a major reversal point. We hope to see price continue its bullish trend. Let's look at what we have on the daily chart.
XRP/USD: Daily chart
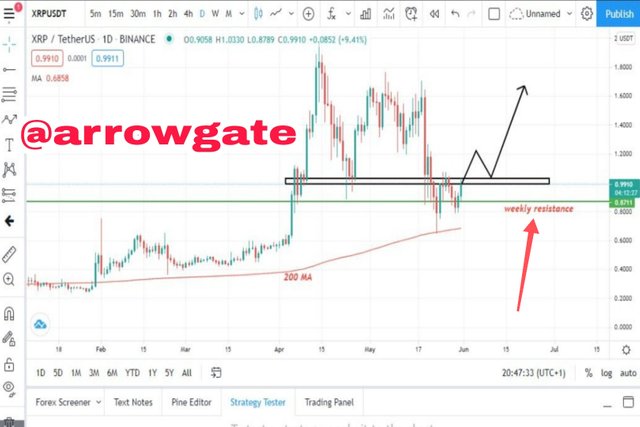
Looking at the daily chart, we can see price is trading above the 200 period moving average which is a sign that the trend is bullish. Also, notice how price has failed to break below the previous weekly resistance now turned a support that was discussed earlier. Similarly, we have a minor level on the daily chart at $1.0. Price is expected to break above the minor resistance and retest it to continue going up to retest the high at $1.8.
XRP/USD: 4hours Chart.
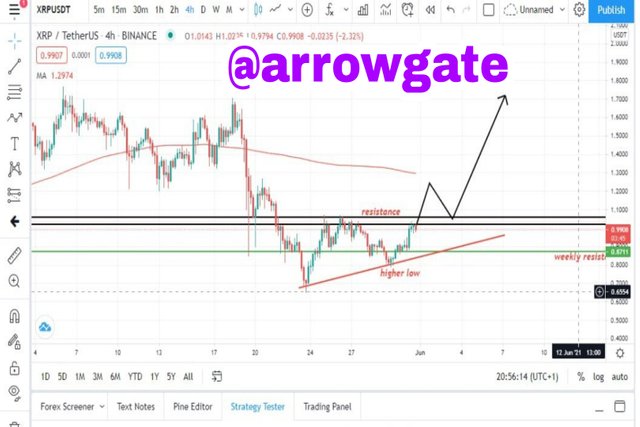
Looking at the 4hrs chart, the situation is different as there is a conflicting signal. Price is currently trading below 200 period MA which is indicating a bearish trend. But we have seen the big picture from the high timeframe. Also, notice how price has failed to break the previous low at $0.7 forming a higher low. The resistance indicated is similar to the daily resistance we expected price to break for the continuation to the upside. A break above this resistance will push price to retest the high at $1.8.
From the overall technical analysis, the price of XRP is still bullish as price is currently at a strong resistance level. We expect price to break this resistance level at $1 for a continuation of the bullish run. What we have currently is a retracement of price for a continuation of the original trend. But this will be confirmed when price breaks the resistance.
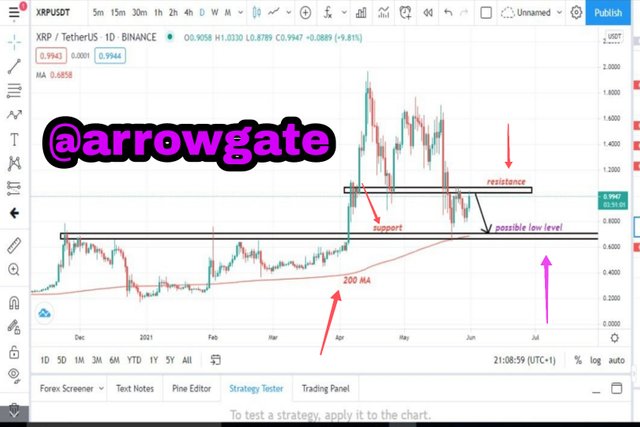
*Here is Possible Low level and the level of XRP for the next one Week.
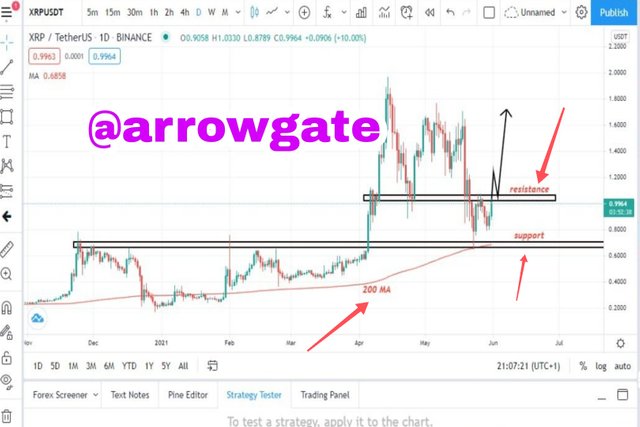
From the technical analysis performed on XRP/USD, we will have a possible high level at $1.8 if price should break the resistance at $1. A break of this resistance will trigger buying pressure to push XRP to the previous high at $1.8.
On the other hand, if price rejects the resistance at $1, we might see XRP go down to retest the support level at $0.67 and this level is also a dynamic support of the 200 moving average. This will be the possible low for XRP if price rejects the resistance.
As you can see it screenshot given below.
11 Conclusion :
To me I'll just say that pivot Points and levels is a very good Indicators if they used properly while trading as it helps us in finding price movement and correct direction of market that where it's going.
Also from my point of view Pivot is a good Indicator and easy to use but it must be used with the other Indicators.
As they are good Indicators for identifying the market trend and finding good area of support and resistance levels. Yes it's true that Pivot points might not be always helpful to do a profitable trade but it will be more effective while using with other technical tools and candlestick analysis to make better trading plans and decisions in order to stop loss and getting good profit.
At the end I'll only say that from all these factors one should have little knowledge to apply these Indicators for getting good profit.
That's from my Side I'll specifically thanks and mention to our respected Professor @stream4u to please do review my Homework as it took my enough time so A big Thanks to the Professor for his kind attention
Regards @arrowgate
Hi @arrowgate
Thank you for joining The Steemit Crypto Academy Courses and participated in the Homework Task.
Your Homework Task verification has been done by @Stream4u, hope you have enjoyed and learned something new.
Thank You.
@stream4u
Crypto Professors : Steemit Crypto Academy
#affable
Downvoting a post can decrease pending rewards and make it less visible. Common reasons:
Submit
Dear Respected sir @stream4u i am really sorry I didn't read new rules as my sp is 130 and in my steem more 118 steem is there I am going to up it to 150+ please grade it otherwise my all efforts will be wasted please 🥺
Downvoting a post can decrease pending rewards and make it less visible. Common reasons:
Submit
You can increase the STEEM POWER, reply to me once done.
Thank You.
@stream4u
Crypto Professors : Steemit Crypto Academy
#affable
Downvoting a post can decrease pending rewards and make it less visible. Common reasons:
Submit
Thank you so much for your kind act, it means alot to me
And I'll keep participating in doing my Homework.😊
Downvoting a post can decrease pending rewards and make it less visible. Common reasons:
Submit
Dear Respected professor @stream4u I have done it.
As I am showing screenshot of all my procedure of powering up to 171 sp.
After powering up..
moreover now you can also check my Steempower from 131 to 172..
I'll specifically thanks to you for your kind reply and act Thank you so much and waiting for your kind reply !
Downvoting a post can decrease pending rewards and make it less visible. Common reasons:
Submit
GREAT Grade updated in the Review.
Thank You.
@stream4u
Crypto Professors : Steemit Crypto Academy
#affable
Downvoting a post can decrease pending rewards and make it less visible. Common reasons:
Submit