Hello everyone! I hope you are all doing well and enjoying life with the blessings of Allah Almighty. I am happy to take part in the exciting challenge hosted by SteemitCryptoAcademy community' Contest (ENG/ESP) Steemit Crypto Academy Contest / S14W4: Fibonacci Retracements || Retrocesos de Fibonacci So, without any further delay, let's dive right in!
The Fibonacci Number System Similar to a tool in the stock market, retracements are used to determine possible levels of support and resistance. While playing a game of hopscotch, picture yourself with these unique markings on the ground that you could potentially bounce off of. It is similar to that, but with stocks instead.
Certain percentages, such as 23.6%, 38.2%, 50%, and 61.8%, are used in these retracements and are derived from a complex mathematical series known as the Fibonacci sequence. Consider it as adding various stepping stones to your game. These percentages are used by traders to predict potential "retrace" or bounce back points in the up and down movements of a stock's price. Although it's not 100% accurate, it provides an indication of possible regions where price fluctuations may occur.
These retracements are used by investors to decide whether to buy or sell equities. For example, traders may use those Fibonacci percentages to determine where a stock might go next if its price dips and then starts to rise. If it's close to a specific percentage, they might choose to purchase it because they believe it will rise from that point.

Canvas source But keep in mind that it's not magic. It's just one of the instruments used by stock market participants to predict potential future stock price movements.
- How to Calculate Fibonacci Retracement Levels?
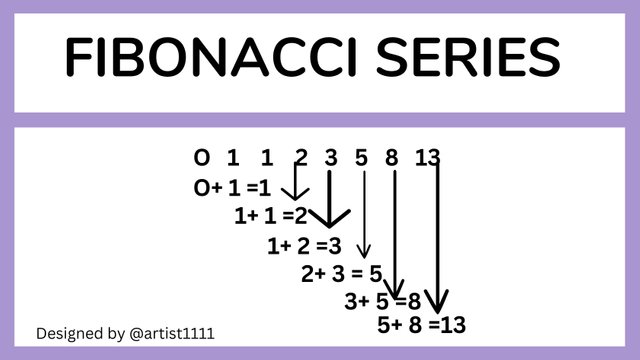
The Fibonacci retracement levels are interesting because they originate from a unique series of numbers. Consider that you begin with the numbers 0 and 1, add on to them to get a string that is 0, 1, 1, 2, 3, and so forth. It never ends, and the percentages that result from dividing one number by the next are 61.8% and 38.2%. These are the primary levels that traders use to determine potential stops or bounces in the price of a stock.
Thus, you use this unique number sequence to find these levels rather than actually "calculating" them. They aid traders in speculating on potential future stock price movements. It is similar to having hints from this pattern in math.
The cool thing about these numbers is that they pop up everywhere! From sunflowers to galaxies, shells, ancient stuff, and even in buildings' designs, this 61.8% ratio shows up in all sorts of places. It's like nature and design have a secret code based on these numbers.
So, when folks talk about Fibonacci retracement levels, they're basically talking about using these percentages to guess where a stock might turn around. It's kind of like having a special math-based map for the stock market.
In the world of trading, there are three key Fibonacci retracement levels that stand out: the 61.8%, 38.2%, and 23.6%. These levels hold quite a bit of significance for traders. They're like checkpoints that traders keep a close eye on during their stock market journey.
 |
|---|
Tradingview
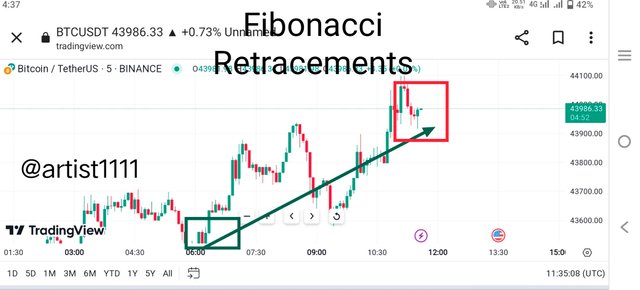
It is clear by examining the BTC to USDT trading chart that Bitcoin started off with an upward trend at $43,300. This rising trend suggested that Bitcoin was appreciating its value relative to the US dollar. But as the day went on, the price increased even more, reaching $44,100, which was the top (highest point) of the trading session. This peak represents the highest value that Bitcoin might have attained in that particular period of time and is an essential point of reference for traders.
On the other hand, within that same time frame, the price of Bitcoin also decreased, hitting a low for the day's trade. This low is the lowest price at which Bitcoin fell during that period, making it an important low point. Due to their ability to identify probable zones of price volatility and changes in market mood, these high and low points are crucial indications for traders.
These high and low levels are important to traders looking to enter or exit the market. For example, the first entry point was noticed at $43,300, which signified the start of the upward trend. Furthermore, an other possible entry point may be evaluated around $43,600, indicating a thereafter advantageous position for traders to either enter the market or contemplate taking profits.
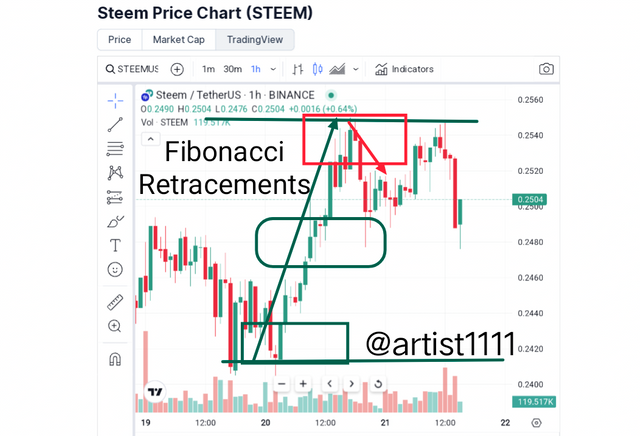
Using the Steem to USDT trade chart, let's dissect it. The daily last 30 mins makes it clear that Steem's movement began in an upward trend at about $0.2420 and eventually broke through to reach $0.2550 by the end of the day. The low point and the peak point are two significant moments in this journey.
 |
|---|
Tradingview
These points represent possible entry or departure points for traders. It is clear from looking at the chart that the initial entry might have been made near the beginning of the uptrend, around $0.2420. It's possible that a second entry point at $0.2480 was discovered when the price increased.
These particular levels are frequently watched closely by traders because they might signal important junctures in the market movement. In this instance, depending on the movement in the cryptocurrency pair, Steem to USDT, these levels could be the indicators for traders to think about entering or closing positions.
Advantages of Fibonacci Retracements:
Clear Levels: They offer clear levels for potential of support and resistance. Traders use these levels to anticipate potential price movements, aiding in decision-making for buying & selling.
Widely Used: Fibonacci retracements are very popular among traders. Their widespreed use can sometimes result in self-fulfilling prophecies, as many traders pay atention to these levels, & increasing their reliability.
Simple to Use: They are very relatively easy to understand and apply. Traders do not need complex calculations; they just need to identify the swing highs and lows to plot the retracement levels.
Disadvantages of Fibonacci Retracements:
Not Always Accurate: While they can be reliable, they are not foolproof. Market dynamics can override these levels, causing unexpected movements that do not adhere to the Fibonacci ratios.
Subjectivity: Identifying the most relevant swing highs & lows for plotting the retracement levels can be subjective. Different traders might draw retracements differently, leading to varied interpretations.
Not Standalone Indicators: Using of Fibonacci retracements alone might not suffice for making trading decisions. Traders often combine them with other indicators or analyses for even more better accuracy.
In summary, while Fibonacci retracements provide valuable insights into potential price movements and levels, they are not flawless. Traders should use them alongside other tools & consider market conditions to make informed decisions.
With Best Regards
@artist1111

Goodbye, friends. It's been a pleasure getting to know you all participating in this community. I will miss interacting with all of you, but it is time for me to move on. Take care & I hope to see you all again very soon , Best of Luck .
As the sun sets on the day
And the night falls softly in
We close this chapter, dear reader
But the story's not yet done
Tomorrow's pages wait, unwritten
INTRODUCTION
As the sun sets on the day
And the night falls softly in
We close this chapter, dear reader
But the story's not yet done
Tomorrow's pages wait, unwritten
INTRODUCTION
Upvoted. Thank You for sending some of your rewards to @null. It will make Steem stronger.
Downvoting a post can decrease pending rewards and make it less visible. Common reasons:
Submit
Greetings,
I appreciate your efforts in explaining this tool to our understanding. The Fibonacci retracement is a tool used in trading to predict future price movements. It helps us figure out the best times to buy or sell stocks or other assets. Like any tool, it has its strengths and weaknesses. To make the most of it, it's important to learn how it works and try out different strategies. Good luck with the contest.
Downvoting a post can decrease pending rewards and make it less visible. Common reasons:
Submit
Thank you for the comment! Best wishes with your trading endeavors!
Downvoting a post can decrease pending rewards and make it less visible. Common reasons:
Submit
Thank you so much for your kind words, I really appreciate it. Best of luck to you too in the contest and in life general. Have a fantastic day
Downvoting a post can decrease pending rewards and make it less visible. Common reasons:
Submit
👍👍👍👍👍👍👍
Downvoting a post can decrease pending rewards and make it less visible. Common reasons:
Submit
Exploring Fibonacci retracements is like playing hopscotch with unique markings on the stock market ground, bouncing off possible support and resistance levels.
Just as in the game, these retracements use specific percentages like 23.6%, 38.2%, 50%, and 61.8%, derived from the Fibonacci sequence, acting as stepping stones to predict potential bounce back points in stock price movements. While not foolproof, it adds an insightful layer to understanding possible trends. Interesting analogy!
I have also participated in the contest, do well to check it out and engage. My post link to the contest.
Downvoting a post can decrease pending rewards and make it less visible. Common reasons:
Submit
Thanks you for your time . Indeed, the comparison between Fibonacci retracements and hopscotch markings offers a vivid way to understand market movements!
Downvoting a post can decrease pending rewards and make it less visible. Common reasons:
Submit
Hello friend.. greetings!!
I sincerely commend the aay you took time and effort in explaining the concept of the Fibonacci retracements. It was a job well done and I appreciate you for this masterpiece of quality content...
The Fibonacci retracements I indeed no magic. It is simply a tool that's been utilized by traders in the trading market to mske entry and exit decisions. It's just one of the instruments used by stock market participants to predict potential future stock price movements.... It is a very good tool with been listed among the best indicators. One thing is to know what the Fibonacci retracements is all about, another thing is to understand how to use it, when and how. Knowing the main purpose of this tool is essential for good and satisfied results. But when this tool is been used with other relevant indicators , we are bound to have a more accurate result and possibly enhance our analysis..
Very rightly Said, certain percentage of the Fibonacci retracements is been traced to the root of the mathematical series of Fibonacci sequence and where they are derived from....
Using the STEEM/USDT chart, you made good description of how the Fibonacci retracements actually works..
As a tool, It must have disadvantages since there are advantages to it. You listed the right ones..
Thanks for sharing and good luck with the challenge.....
Downvoting a post can decrease pending rewards and make it less visible. Common reasons:
Submit
Thank you for your time 👍👍👍👍🙏
Downvoting a post can decrease pending rewards and make it less visible. Common reasons:
Submit
Saludos gran amigo artist1111.
Los retrocesos de finobacci, el tema para estudiar y presentar una participación para este reto.
Dentro del análisis técnico contamos con este indicador para mostrarnos soportes y resistencias y así poder ver posibles tendencias alcistas o bajistas, de tu parte buenas palabras para explicarnos cada pregunta, buenas imágenes y buen análisis de los gráficos que presentaste.
Te deseo éxitos y bendiciones.
Downvoting a post can decrease pending rewards and make it less visible. Common reasons:
Submit
Greetings! Fibonacci retracements aid in spotting support, resistance, and potential trends within technical analysis. Best wishes!
Downvoting a post can decrease pending rewards and make it less visible. Common reasons:
Submit
Defines los retrocesos de Fibonacci como las herramientas para determinar los niveles de soporte y resistencia. Los niveles claves como 23,6%, 38,2%, 50% y 61,8% son utilizados para predecir posibles puntos de retroceso de los movimientos hacia arriba o hacia abajo del precio analizado, haciendo la salvedad que nos exacto, así que define zonas probables donde pueden ocurrir sus fluctuaciones.
Explicas con detalle el orígen de la secuencia de Fibonacci, lo cual es una información educativa y valiosa para comprender su relación con la naturaleza que nos rodea, lo que le dá un sentido místico con la proporción áurea del 61,8%.
Gracias por participar y compartir tus conocimientos.
Saludos y éxitos.
Downvoting a post can decrease pending rewards and make it less visible. Common reasons:
Submit
Thanks for commenting on my post! Fibonacci sequence originates from 13th century mathematician Fibonacci, found in nature, and relates to trading via key retracement levels. Good luck to you too!
Downvoting a post can decrease pending rewards and make it less visible. Common reasons:
Submit
Bhai mujhe ummid hai ki aap khairiyat se honge aur aapane is engagement challenge ke har question mein bahut acchi Tarah se participate karne ki koshish ki aur apne knowledge se hamen agar karne ki bharpur koshish ki hai jiske vajah se main aapko dad deta hun
Mujhe aapki baat se bilkul ittefaq hy k agr hum Fibonacci retracements ki methodology ko samajhna chahte Hain To hamen hopscotch jassi game ko samajh mein ki jarurat hai Taki Ham iski acchi understanding Le sake iske alava aapane fwaid nuksan ko bahut acchi Tarah se explain Kiya hai main aapki koshish per aapko good Lak kahta hun
Downvoting a post can decrease pending rewards and make it less visible. Common reasons:
Submit
Your appreciation means a lot, encouraging me to contribute further. Thanks!
Downvoting a post can decrease pending rewards and make it less visible. Common reasons:
Submit
***We can be successful by encouraging each other at quality content 💞
Downvoting a post can decrease pending rewards and make it less visible. Common reasons:
Submit
Inshallah dear brother, hoping so.😍
Downvoting a post can decrease pending rewards and make it less visible. Common reasons:
Submit
Hey there
I must say I appreciate your work you wrote so excellently and professionally your post is highly educational and smartly arranged. Please keep sharing such high quality post to build steam blockchain.
Thanks for sharing wishing you success, please engage on my entry https://steemit.com/hive-108451/@starrchris/steemit-crypto-academy-contest-s14w4-fibonacci-retracements
Downvoting a post can decrease pending rewards and make it less visible. Common reasons:
Submit
Thank you kindly! Your support motivates me to keep contributing positively.
Downvoting a post can decrease pending rewards and make it less visible. Common reasons:
Submit
I really appreciate your efforts and views about that topic and you have shared a very interesting post with us. You have nicely covered the whole topic and done a great job. Yes you are right that the FRs are very useful tools to analyze the market technically. Thank you so much for sharing with us 😀
Downvoting a post can decrease pending rewards and make it less visible. Common reasons:
Submit