Hello everyone! I hope you are all doing well and enjoying life with the blessings of Allah Almighty. I am happy to take part in the exciting challenge hosted by SteemitCryptoAcademy community' Contest (ENG/ESP) Steemit Crypto Academy Contest / S15W6: Chartist analysis || Análisis chartista So, without any further delay, let's dive right in!
What is chartist analysis? And the importance of chart patterns. |
|---|
Chartist analysis analyzes historical trends to forecast future price movements. Sort of like trying to connect the dots to find a pattern. As an illustration, the shoulder-head-shoulder pattern points to a potential shift in the price's direction.
However, this is not a given. It is not a given that the pattern will materialize simply because it appears. It is advisable to combine this chart data with additional information when investing in cryptocurrencies such as STEEM in order to make more informed choices.

Therefore, although they can provide clues, chart patterns are not magic spheres. It is similar to reading traffic signs in that it is useful, but you still need to be alert for any unexpected turns.
Investors use chart patterns as a kind of guidebook. By examining historical trends, they assist us in predicting future price movements. We can predict whether prices will rise or fall by identifying patterns such as the shoulder-head-shoulder.
Though not infallible, these patterns offer us hints. It is helpful to combine them with other information, such as news and market emotion, to make better selections.
Thus, chart patterns are useful tools even when they aren't magical. The market's twists and turns are navigated with the help of something akin to breadcrumbs in a forest.
What is the shoulder head shoulder pattern? Show screenshots using the BTC/USDT pair. |
|---|
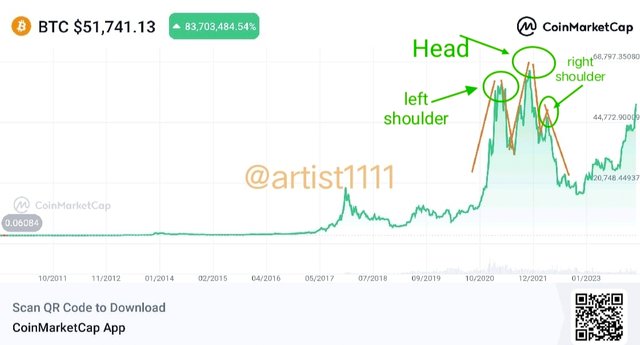
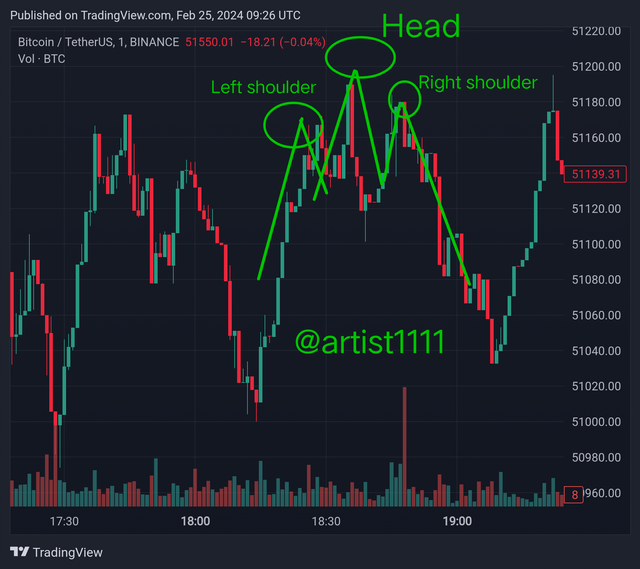
One technique to identify a potential market trend reversal is to look for the shoullder-head-shoulder pattern. It appears to be three hills, the highest of which is in the middle. The head is the tallest hill, the left shoulder is the first, and the right shoulder is the third. This pattern indicates that prices may be about to decline when it appears following an increase.
It like spotting a peak between two smaller ones. It suggests that sellers may soon gain the upper hand and that the purchasing pressure may be waning. This pattern helps investors determine whether to sell now or hold out for a better deal.
A technical analysis pattern known as the head & shoulders pattern suggests that the current trend may be about to reverse. It is made up of three peaks, the largest of which is the center peak, also known as the head, and the two smaller peaks on either side as the shoulders. The neckline is the line that joins the lowest points of the two troughs that are situated between the peaks.
 General outlook General outlook |
|---|
Left Shoulder: The first peak forms during an uptrend, followed by a temporary decline.
Head: The highest peak forms next, representing the climax of buying pressure.
Right Shoulder: The third peak forms, usually lower than the head, indicating a weaker rally than the previous one.
Neckline: Connects the lows of the two troughs between the peaks, serving as a support level.
Reversal Signal: Following the formation of the right shoulder, price action below the neckline may indicate a possible change in trend from an upward to a downward one.
Validation of the pattern is ensured by a successful break below the neckline and increased volume.
 Trading view complex outlook Trading view complex outlook |
|---|
Entry: Following a price breach below the neckline, traders frequently open short bets.
positioned above the right shoulder to reduce possible losses in the event that the pattern breaks.
Target: The probable price decrease following the breakout is frequently estimated using the distance between the head and the neckline.
Explain the formation of the inverse head shoulders pattern. Show screenshots of a cryptocurrency pair that displays this pattern. |
|---|
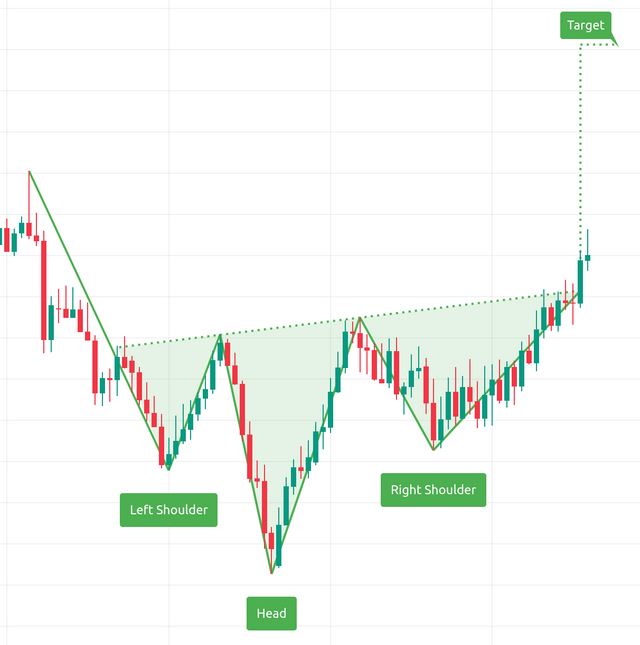
The inverse head and shoulders pattern, which is the reverse of the classic head and shoulders pattern, usually forms at the bottom of a downtrend and may indicate an impending uptrend reversal. This is how it originates:
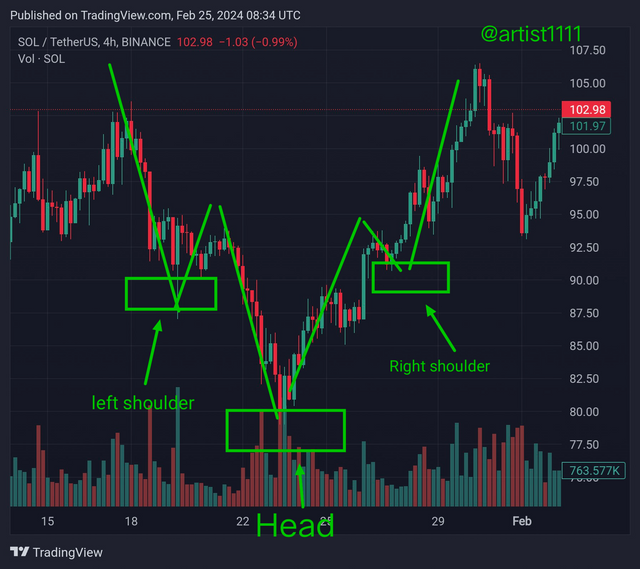
Left Shoulder: The pattern starts with a price decline that reaches a low point. This is followed by a brief upswing that forms the left shoulder.
Head: The pattern's head is formed when the price declines once more to create a lower low following the left shoulder. Typically, the head's low point falls below the left shoulder's low point.
 General outlook , source General outlook , source |
|---|
Right Shoulder: There is another rally after the head, but it is not as strong as the last one. This makes up the right shoulder, and it usually doesn't rise higher than the head.
Neckline: The neckline joins the high points of the two shoulder peaks, following the conventional pattern. It serves as a barrier that, when breached, validates the pattern.
Confirmation: The pattern's validity is supported by a breakout above the neckline and rising volume, which points to a possible trend reversal from the downward to the upward direction.
 Trading view Trading view |
|---|
An indication of a change in market mood from negative to bullish is the inverse head and shoulders pattern, which is seen as bullish. Because it presents a buying opportunity, traders frequently search for this pattern. Their targets are determined by measuring the distance between the head and the neckline.
For the technical analysis of the Steem, would you use chart patterns? Explain your answer |
|---|
Honestly, I am still learning about using chart patterns for Steem's technical analysis. Right now, I have not had the chance to put it into practice, but I'm eager to learn more.
Analyzing historical price movements to forecast future ones is the process of using chart patterns. It's similar to joining dots on a graph to look for patterns. However, it's not always accurate; occasionally the trends break and the market surprises us.
Chart patterns are one component of the jigsaw, but one that could be helpful for Steem. It's crucial to take into account news, market mood, and other elements. Bringing all of this information together makes decision-making easier.
Thus, even if I'm still getting the hang of it, I think that utilizing chart patterns in conjunction with other analysis techniques can offer insightful information on how Steem's price moves.
In conclusion , even though I am still learning how to use chart patterns for Steem technical research, I see its potential value in addition to other analytical tools. Although chart patterns might provide information about future price movements, for a more complete picture, one should also consider news and market mood.
With continued skill and knowledge development, my goal is to successfully incorporate chart patterns into my analysis to support well-informed trading and investment decisions on Steem.
With Best Regards
@artist1111

Goodbye, friends. It's been a pleasure getting to know you all participating in this community. I will miss interacting with all of you, but it is time for me to move on. Take care & I hope to see you all again very soon , Best of Luck .
As the sun sets on the day
And the night falls softly in
We close this chapter, dear reader
But the story's not yet done
Tomorrow's pages wait, unwritten
INTRODUCTION
As the sun sets on the day
And the night falls softly in
We close this chapter, dear reader
But the story's not yet done
Tomorrow's pages wait, unwritten
INTRODUCTION
Excelente información amigo, aunque todo esto puede servir como una guía algunas veces no sucede así ya que puede suceder lo contrario, pero si nos puede servir, no se nada sobre el mercado de cripto pero leyendo tu publicación he tenido una idea clara de como los grandes inversores se guían a la hora de comprar y vender criptomonedas, me fue muy útil tu post ya que logré captar la información
Downvoting a post can decrease pending rewards and make it less visible. Common reasons:
Submit
Thanks for your feedback! Understanding how major investors navigate crypto markets from my post was helpful for you.
Downvoting a post can decrease pending rewards and make it less visible. Common reasons:
Submit
@artist1111 Your breakdown of chartist analysis and the detailed insights into patterns like shoulder-head-shoulder and its inverse are incredibly helpful. Your honesty about still learning adds a relatable touch. Wishing you the best on your journey of incorporating chart patterns into Steem analysis! Looking forward to more insightful posts from you. Good luck with the contest!
Downvoting a post can decrease pending rewards and make it less visible. Common reasons:
Submit
Thanks for your encouraging words! I'm glad you found the breakdown helpful. Incorporating chart patterns into Steem analysis is indeed a journey, and I appreciate your support!
Downvoting a post can decrease pending rewards and make it less visible. Common reasons:
Submit
Dear @artist1111
You have clearly explained what chartist pattern is and how it helps traders to make informed trading decisions.
The head and shoulder pattern is always unique. It works almost everytime it appears on the chart.No wonder it is the toast of many traders
There are other chart patterns that can be very useful in technical analysis. They are, bullish flag, Engulfment patterns, Evening and morning star, etc
You have written well my brother. Wishing you the best in this contest.
Downvoting a post can decrease pending rewards and make it less visible. Common reasons:
Submit
Thank you for your kind words! I'm glad you found the explanation of chartist patterns helpful. Indeed, the head and shoulders pattern is quite reliable, and there are many other useful patterns in technical analysis. I appreciate your support in the contest!
Downvoting a post can decrease pending rewards and make it less visible. Common reasons:
Submit
It gives me so much joy whenever I see and innovative intellectual and creative youth in this our generation, your article it's of high quality and I really appreciate such quality articles.
Indeed cool skills and educative ideas on knowledge like this could really influence once decision order or trade in the crypto ecosystem.
I must say such high quality actually needs high quality reward and I'm sure you get one very soon thanks for putting in such hard work and I really love the motivational speech at the footing of your article thank you very much for sharing please also trying engage romantico through the link below
https://steemit.com/hive-108451/@starrchris/steemit-crypto-academy-contest-s15w6-chartist-analysis
Downvoting a post can decrease pending rewards and make it less visible. Common reasons:
Submit
Thank you for your heartfelt appreciation! I'm dedicated to continually improving and incorporating chart patterns into my analysis. Your recognition means a lot, and I'm glad you found the article motivational.
Downvoting a post can decrease pending rewards and make it less visible. Common reasons:
Submit
I must say, your breakdown of chart analysis and the detailed insights into patterns like shoulder-head-shoulder and its inverse are absolutely invaluable. The way you explain these concepts in simple terms really helps us grasp the intricacies of chartist analysis. And I love how you're so open about still being in the learning process. It makes you relatable and approachable, inspiring others to embark on their own journey of understanding chart patterns.
I have no doubt that your dedication and enthusiasm will take you far in incorporating these chart patterns into your analysis of Steem. Your insightful posts are always a pleasure to read, and I'm eagerly looking forward to more of your brilliant insights. Keep up the fantastic work. Good luck.
Downvoting a post can decrease pending rewards and make it less visible. Common reasons:
Submit
Thank you for your generous praise! I'm delighted to hear that you found the breakdown of chart analysis and pattern insights invaluable. Being open about my learning process is important to me, and I'm glad it resonates with you. Your encouragement means a lot, and I'm excited to continue sharing insights on Steem. Thanks for your support!
Downvoting a post can decrease pending rewards and make it less visible. Common reasons:
Submit
Your detailed analysis and simple explanation of chart analysis is very valuable. Your honesty and the fact that you are still learning is very inspiring. With your hard work and enthusiasm, I am confident that you will make progress in incorporating chart patterns into your Steem analysis. Your writing style is always inspiring. good wishes.
Downvoting a post can decrease pending rewards and make it less visible. Common reasons:
Submit
Thank you for your kind words! I'm grateful for your appreciation of my detailed analysis and honesty about my learning journey. Best wishes to you too!
Downvoting a post can decrease pending rewards and make it less visible. Common reasons:
Submit
Your most welcome and also thanks to your for the best wishes my brother
Downvoting a post can decrease pending rewards and make it less visible. Common reasons:
Submit
hey your detailed explanation of the shoulder-head-shoulder pattern, along with the screenshots using the BTC/USDT pair, enhances understanding for those interested in technical analysis. It's great that you emphasized the importance of combining chart patterns with other factors for more informed decision-making in the cryptocurrency market. Well done on breaking down the general outlook and trading strategy for the head & shoulders pattern. Keep up the insightful work..
Downvoting a post can decrease pending rewards and make it less visible. Common reasons:
Submit
Your post ending is always precious and your hard work is depicting from your post best of luck for your participation
Downvoting a post can decrease pending rewards and make it less visible. Common reasons:
Submit