
Hello everyone! I hope you are all doing well and enjoying life with the blessings of Allah Almighty. I am happy to take part in the exciting challenge hosted by SteemitCryptoAcademy community . So, without any further delay, let's dive right in! Shall we ? ........, Okay , Okay😊! .
Give a real-life example where Fibonacci retracements can be used to determine support and resistance levels on a trading chart. Use recent market data to illustrate your point. |
|---|
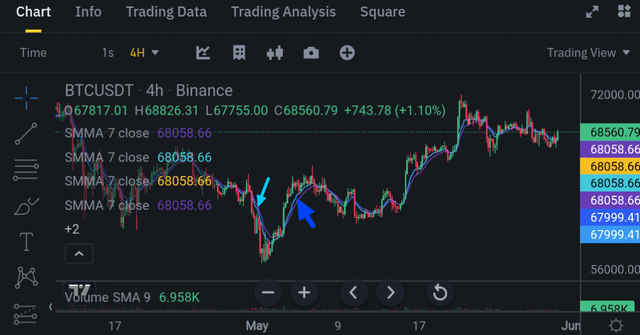
The most important basic tool in technical analysis are moving averages, which enable traders to balance out price data and spot trends. The two most widely utilized forms are the the simple moving average (SMA) and the Exponential Moving Average (EMA).
Both serve a purpose for identifying trends, but they differ in how vulnerable they are to changes in price and in how they perform calculations.
 SMA and EMA SMA and EMA |
|---|
How can we calculate Simple Moving Average (SMA)?
We refer to this as the Simple Moving Average, or SMA, as the average market value of an asset over a particular number of periods. The SMA has been calculated by adding up the prices at the end for the selected period and multiplying the total by the total number for periods.
For instance, you can sum altogether the closing prices over the previous ten days and dividing that number by ten to get a 10-day SMA. The equation is:
SMA = (P₁ + P₂ + ... + Pₙ) / N
- Where 𝐏 represents the closing prices and N is the number of periods.
Example :
If the closing prices over the past 5 days are $50, $52, $54, $56, and $58, the 5-day SMA would be:
𝐒𝐌𝐀 = ( 50 + 52 + 54 + 56 + 58 ) / 𝟓 = 𝟓𝟒
The SMA is straightforward and provides a clear signal of the average price over a period, but it might be slow to respond to rapid price changes.
How is the Exponential Moving Average (EMA) Calculated?
The Exponential Moving Average (EMA) gives more weight to recent prices, making it more responsive to new information. The EMA is calculated using a smoothing factor, which is based on the number of periods. The formula involves:
- Calculating the SMA for the initial EMA value.
- Using the formula:
𝐄𝐌𝐀 = ( 𝐏𝒕 × 2 ÷ 𝐍 + 𝟏) + 𝐄𝐌𝐀previous
- And then multiply with ,
( 1 - 2 ÷ n + 1 )
Where 𝐩𝓽 , is the current price and 𝒏 is the number of periods.
- Example: For a 10-day EMA, if today's price is $60, the smoothing factor is ( 2 ÷ 10 + 1 ) 0.1818. If the previous EMA was $55, today's EMA would be:
𝐄𝐌𝐀 = (𝟔𝟎×𝟎.𝟏𝟖𝟏𝟖)+(𝟓𝟓×𝟎.𝟖𝟏𝟖𝟐)=𝟓𝟔
𝘛𝘩𝘦 𝘌𝘔𝘈 𝘳𝘦𝘢𝘤𝘵𝘴 𝘮𝘰𝘳𝘦 𝘲𝘶𝘪𝘤𝘬𝘭𝘺 𝘵𝘰 𝘱𝘳𝘪𝘤𝘦 𝘤𝘩𝘢𝘯𝘨𝘦𝘴, 𝘮𝘢𝘬𝘪𝘯𝘨 𝘪𝘵 𝘶𝘴𝘦𝘧𝘶𝘭 𝘧𝘰𝘳 𝘪𝘥𝘦𝘯𝘵𝘪𝘧𝘺𝘪𝘯𝘨 𝘴𝘩𝘰𝘳𝘵-𝘵𝘦𝘳𝘮 𝘵𝘳𝘦𝘯𝘥𝘴.
 SMA Indicator SMA Indicator |
|---|
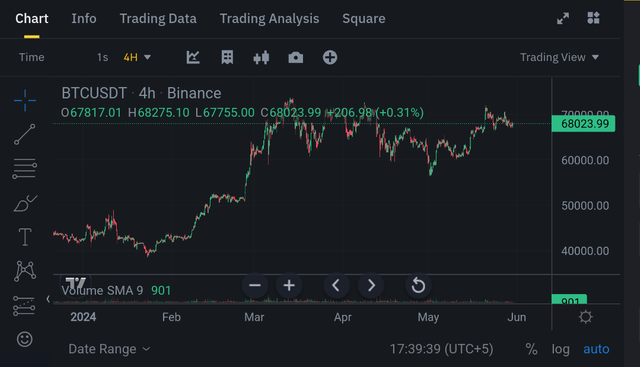
To find the average price of a valuable resource over a particular length of time, an indicator called the Simple Simple Moving Average (SMA) incorporates the costs associated with closing and dividing the result by the overall number of periods. For example, a 10-day simple moving average (SMA) takes the close of prices during the previous 10 days and increases them by 10.
This approach provides a more seamless, but frequently slower, picture of overall market movements through allocating a comparable significance to each price point.
SMAs are useful for identifying long-term trends and support/resistance levels, such as using a 50-day or 200-day SMA to gauge overall market direction.
 EMA Indicator EMA Indicator |
|---|
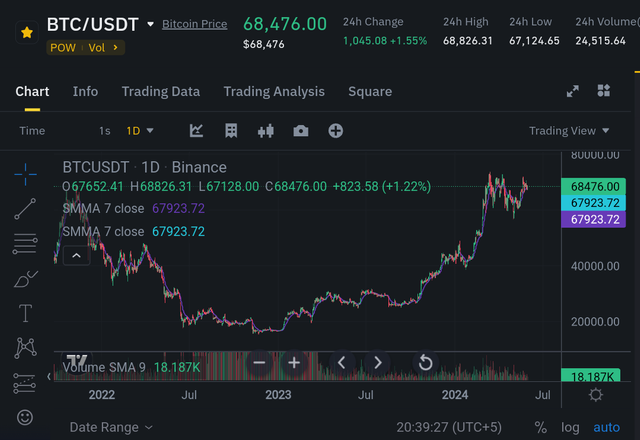
The Exponential Moving Average (EMA), on the other hand, responds more rapidly to fresh material since it gives recent prices more weight.
A smoothing factor is used to perform this it; for example, a 10-day EMA emphasizes the most recent prices by using a ratio of 2/(10+1). It also raises the EMA's sensitivity to brief price fluctuations, enabling operators to see trends and possible reversals earlier.
EMAs are frequently utilized in methodologies that need for quicker signals, like the 12-day and 26-day EMA crossovers that show whether to buy or sell.
Explain what a 'Golden Cross' and a 'Death Cross' are in the context of moving averages. How do these setups influence trading decisions? |
|---|
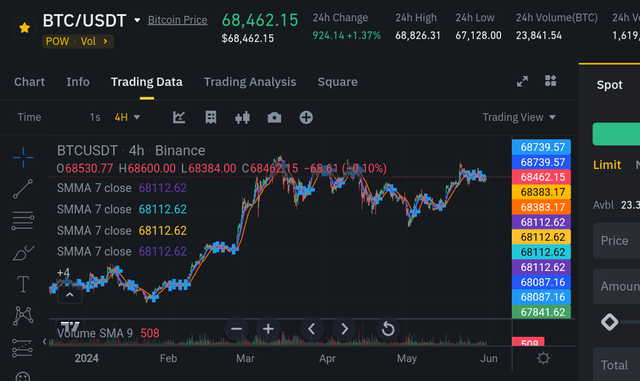
A 'Golden Cross' and a 'Death Cross' are significant signals in technical analysis involving moving averages.
A Golden Cross occurs when a short-term moving average, typically the 50-day SMA, crosses above a long-term moving average, such as the 200-day SMA.
 |
|---|
This crossover indicates a potential shift from a downtrend to an uptrend, suggesting bullish market sentiment.
This crossover suggests an opportunity in trend from one of collapse to one of increase, indicating optimism in the market. A Golden Cross is understood by traders as a purchasing signal, suggesting an upward trend.
For instance, if a firm's 50-day SMA crosses higher than its 200-day SMA, traders might become compelled to purchase the stock in preparation of a long-term price increase.
Example: Take a stock, whose 200-day SMA is $145 and its 50-day SMA is $150. Traders view the formation of a Golden Cross, where the 50-day SMA crosses over the 200-day SMA, as a positive indicating them. Let's say in the coming weeks the stock hikes in prices from $150 to $160. In preparation of future profits, traders may purchase the stock as a result of this crossover.
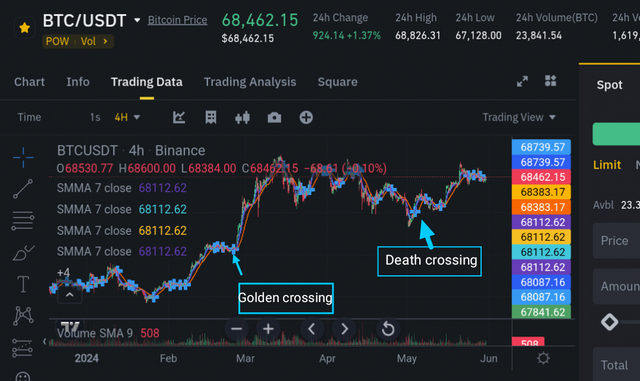 |
|---|
The layout suggests a depressing future, suggesting that pricing may decline much further. Most traders interpret a death cross an a trade signal or as a signal to quit newly initiated positions for longs.
Example: As an illustration, let's look at the same stock alongside 200-day SMA of $150 and 50-day SMA of $145. Traders perceive the formation of a Death Cross, where the 50-day SMA intersects listed below the 200-day SMA, as a bearish indication.
Give a real-life example where Fibonacci retracements can be used to determine support and resistance levels on a trading chart. Use recent market data to illustrate your point. |
|---|
Fibonacci retracements are a popular tool in technical analysis used to identify potential support and resistance levels.
Let's consider a real-life example using the stock of Company XYZ.
Suppose Company XYZ's stock has been on an uptrend, rising from $50 to $100 over three months. To use Fibonacci retracements, we first identify the recent high at $100 and the recent low at $50.
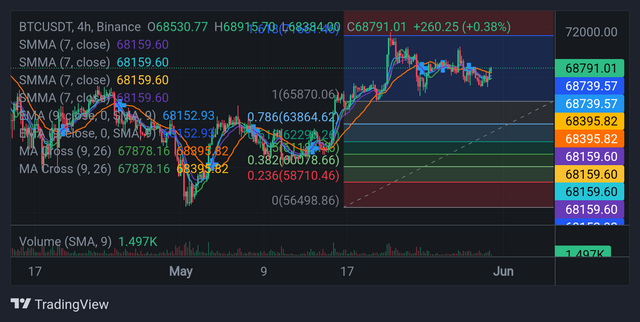 Fibonacci retracement Fibonacci retracement |
|---|
We then apply Fibonacci retracement levels of 23.6%, 38.2%, 50%, 61.8%, and 78.6% to this range.
Calculation of retracement levels:
- 23.6% retracement: $100 - [(100 - 50) * 0.236] = $88.20
- 38.2% retracement::; $100 - [(100 - 50) * 0.382] = $80.90
- 50% retracement;: $100 - [(100 - 50) * 0.5] = $75.00
- 61.8% retracement: $100 - [(100 - 50) * 0.618] = $69.10
- 78.6% retracement:; $100 - [(100 - 50) * 0.786] = $60.70
Traders will view these levels as possible zones of support where the price might find buying interest and reversal upwards as the stock price starts to decline from its peak.
For example, if the stock costs drop to $80.90 (the 38.2% retracement level) and starts to consolidate, traders might see a strong support level and a buying opportunity. However, if how much starts increasing again, the current levels might potentially be used as resistance.
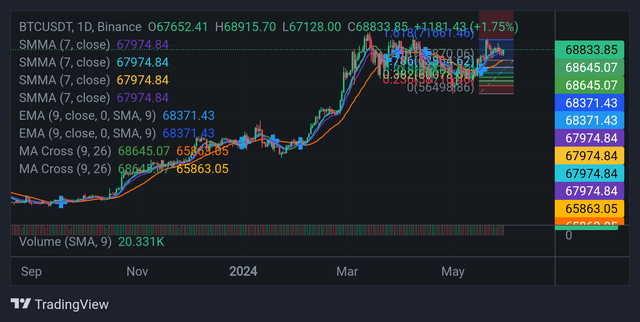 Fibonacci retracement Fibonacci retracement |
|---|
For example, if the stock moves back up to $88.20, the 23.6% retracement level, and then fails to move greater it might be nearing the point of resistance where selling pressure might get stronger.
Traders can more precisely identify significant market thresholds and base their investment choices on historical price movements by employing Fibonacci retracements.
And so the case same for BTC/Usdt chart as well.
Let's Using a hypothetical variation between $67,500 and $68,500 on May 30, 2024, let's apply Fibonacci retracement levels to Bitcoin (BTC). This range will help us determine probable levels of support and opposition.
Range:
- High: $68,500
- Low: $67,500
Fibonacci Retracement Levels:
23.6% Retracement:
{Level} = 68,500 - [(68,500 - 67,500) \times 0.236] ]
{Level} = 68,500 - (1,000 \times 0.236) ]
{Level} = 68,500 - 236 = 68,264 ]38.2% Retracement:
{Level} = 68,500 - [(68,500 - 67,500) \times 0.382] ]
{Level} = 68,500 - (1,000 \times 0.382) ]
{Level} = 68,500 - 382 = 68,118 ]50% Retracement:
{Level} = 68,500 - [(68,500 - 67,500) \times 0.5] ]
{Level} = 68,500 - (1,000 \times 0.5) ]
{Level} = 68,500 - 500 = 68,000 ]61.8% Retracement:
{Level} = 68,500 - [(68,500 - 67,500) \times 0.618] ]
{Level} = 68,500 - (1,000 \times 0.618) ]
{Level} = 68,500 - 618 = 67,882 ]78.6% Retracement:
{Level} = 68,500 - [(68,500 - 67,500) \times 0.786] ]
{Level} = 68,500 - (1,000 \times 0.786) ]
{Level} = 68,500 - 786 = 67,714 ]
Interpretation
If BTC is fluctuating within the $67,500 to $68,500 range, traders will look at these Fibonacci levels as potential support and resistance points.
Support Levels:
- $68,118 (38.2% retracement): If BTC drops to this level and shows signs of stabilization, it may be a strong support where buyers might step in.
- $68,000 (50% retracement): A significant level that often acts as strong support or resistance.
- $67,882 (61.8% retracement): Another key support level that traders will watch closely.
Resistance Levels:
- $68,264 (23.6% retracement): If BTC is moving up, this level might act as initial resistance where selling pressure could emerge.
- $67,714 (78.6% retracement): If BTC declines further and then rises back to this level, it might face resistance.
Example Scenario
As of today, May 30, 2024, Bitcoin reaches a peak of $68,500 before beginning to fall. It retraces after finding support at $68,118, suggesting that this is a solid support level. BTC is rising, but it is having difficulty breaking above $68,264, indicating that this is a resistance level.
Using these retracement levels to help them make decisions, traders may think about purchasing at the support level and selling close to the resistance.
When trading in a volatile market, traders can make better decisions by employing Fibonacci retracement levels to more precisely identify potential support and opposition divisions.
Design a trading strategy using both EMA and Fibonacci retracements. Describe your approach to entering and exiting a position, as well as risk management. |
|---|
Entry Strategy:
I suggest using the 50-day EMA in conjunction with Fibonacci levels drawn from recent price changes to create a trading system that combines EMA and Fibonacci retracements.
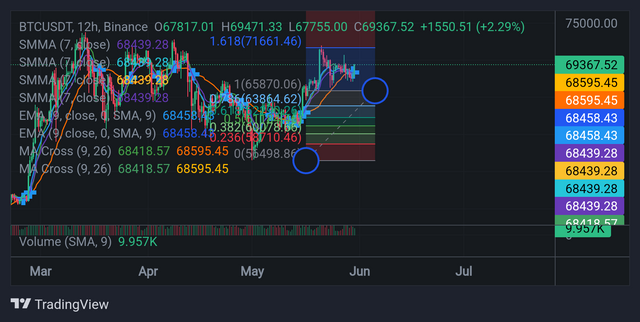 Fibonacci levels (Entry Spot) Fibonacci levels (Entry Spot) |
|---|
Bitcoin (BTC) showed a range of $67,500 to $68,500 on May 30, 2024 mean today . To enter the market, I waited for a bullish trend to be indicated by the 50-day EMA crossing above the 200-day EMA. In addition, I keep an eye out for possible support at Fibonacci retracement levels, especially the 38.2% and 50% levels.
Exit Strategy:
When the price is getting close to a Fibonacci resistance level, such the 23.6% or 78.6% retracement levels, I would think about selling and closing the position. In order to lock in profits, I would also carefully watch for the 50-day EMA crossing below the 200-day EMA, which would indicate a possible trend reversal.
Risk Management:
To manage risk, I would set stop-loss orders below key Fibonacci support levels, ensuring that losses are limited if the market moves against the trade.
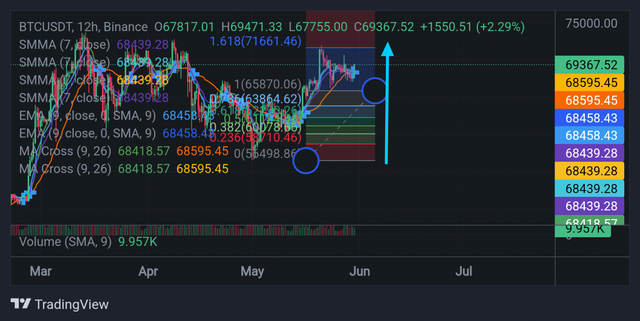 Risk Management strategy Risk Management strategy |
|---|
I would also employ a suitable position sizing to make sure that every trade is in line with my overall portfolio investment plan and risk tolerance.
The risk management strategy would additionally incorporate reevaluating the market circumstances on a regular schedule and changing stop-loss levels as necessary.
This trading technique attempts to profit from both short-term market movements and long-term trend reversals while efficiently managing risk by combining EMA crosses for trend identification with Fibonacci retracement levels for the entry and exit points.
Analyze a historical trading chart of STEEM/USDT pair where a 'Golden Cross' followed by a Fibonacci application led to a significant price movement. Explain how you would have negotiated this scenario. |
|---|
Analyzing the historical trading chart of the STEEM/USDT pair over the last month, we observe a significant price movement from $0.25 to $0.3350. Let's suppose we identify key support and resistance levels at $0.30 and $0.32 respectively.
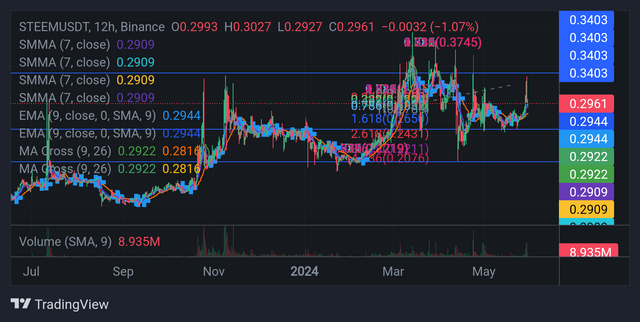
During this period, a 'Golden Cross' occurred, where the 50-day exponential moving average (EMA) crossed above the 200-day EMA,, indicating a potential bullish trend reversal. Additionally, we applied Fibonacci retracement levels to identify potential entry & exit points.
In this case, I would have handled the issue by taking a calculated risk after identifying the Golden Cross and taking the Fibonacci retracement levels into account. First, by keeping a close watch on the price movement after the Golden Cross, I ought to have waiting for confirmation of the bullish trend. After confirmation, I would have explored for an entry target close to the $0.30 support level, whose is the 38.2% Fibonacci retracement level. This level is in line with both a major psychological level and Fibonacci support, delivering an appropriate risk-reward ratio.
I would have set a target price when I first entered the trade, close to the 61.8% Fibonacci retracement level, or all around $0.32 resistance level. This level is equivalent to a significant resistance level on the chart as well as Fibonacci resistance, making it a possible exit point. I also could have used placed a stop-loss order to control risk and guard against unfavorable the market swings, slightly lower than the $0.30 support level.
Overall, I would try to profit that extends from the notable price movement of the STEEM/USDT pair whereas skillfully managing risk through incorporating the price signals of the Golden Cross with Fibonacci retracement levels along with carefully dealing entry and exit points.
I invite @casv @ngoenyi and @johnmitchel to join this contest,
kind Regards
@artist1111

Adieu, folks!
May the winds of fortune
carry you to greatness!
May the winds of fortune
carry you to greatness!
You have created such a great and high quality content. The content is connected and I would say cohesive. I enjoyed going through it.
In my opinion, Fibonacci retracements are very helpful for traders to identify where a stock's price might stop falling or rising. They use this tool to make more informed trading decisions.
I think that when the 50-day moving average crosses above the 200-day moving average, it signals that the market might go up. This Golden Cross is usually seen as a positive sign by traders.
As far as I know, the EMA is useful because it reacts faster to recent price changes than the simple moving average. This helps traders catch trends quicker.
As a trader, to apply Fibonacci retracements, I first need to find the highest and lowest prices of a stock over a period. This helps set up the levels to watch for support and resistance.
I believe traders often buy when the price is at a support level and sell when it's near a resistance level. This strategy uses Fibonacci retracement levels to guide their actions.
Good luck .
Downvoting a post can decrease pending rewards and make it less visible. Common reasons:
Submit
Congratulations, your comment has been successfully curated by our team via @steemdoctor1 at 10%
Downvoting a post can decrease pending rewards and make it less visible. Common reasons:
Submit
Thanks for reading my post. I'm glad you found it cohesive and helpful. Fibonacci retracements, Golden Crosses, and EMAs are indeed valuable tools for making informed trading decisions.
Downvoting a post can decrease pending rewards and make it less visible. Common reasons:
Submit
Upvoted. Thank You for sending some of your rewards to @null. It will make Steem stronger.
Downvoting a post can decrease pending rewards and make it less visible. Common reasons:
Submit
Thank you very much for inviting. There is much knowledge embedded in this post. I would say you took time to write in detail everything needed to know about Averages and retracements. I read between the lines and i would say i gained knowledge. Thanks once more for inviting me to not only give out value but to receive value from you. Goodluck in the contest.
Downvoting a post can decrease pending rewards and make it less visible. Common reasons:
Submit
Thanks for reading my post and for your kind words. I'm glad you found it valuable and informative. Good luck!
Downvoting a post can decrease pending rewards and make it less visible. Common reasons:
Submit
Downvoting a post can decrease pending rewards and make it less visible. Common reasons:
Submit
Thank you @deepak94 for support .
Downvoting a post can decrease pending rewards and make it less visible. Common reasons:
Submit
I know too well that I've got some knowledge about this concept but this one is pro-level from you.
I'm already feeling excited for learning this topic and concept much better from you sir.
Indeed every points are relevant and very technical to traders like us.
And I wan to believe that in as much as I'm open to learning more of this from you, you're also open to teaching me more about it.
Thanks for this knowledge and best wishes 🙏☺️
Downvoting a post can decrease pending rewards and make it less visible. Common reasons:
Submit
Thanks for reading my post and your kind words! I'm thrilled to share insights with fellow traders. Always happy to discuss more and learn together. Best wishes! 🙏☺️
Downvoting a post can decrease pending rewards and make it less visible. Common reasons:
Submit
Hello friend it's so good to see high quality article on the platform, and I will say you did well this is because your article is filled with a lot of ideas and knowledge that would make anyone successful in the crypto ecosystem. Indeed your knowledge in Fibonacci retreatment strategy and the different types of moving average indicators is of high standard and I appreciate you for sharing such high quality of content.
Do well to go through my article too, thanks https://steemit.com/hive-108451/@starrchris/steemit-crypto-academy-contest-s18w2-mastery-of-moving-averages-and-fibonacci-retracements
Downvoting a post can decrease pending rewards and make it less visible. Common reasons:
Submit
Thanks for reading my post. I'm glad you found it valuable. Sharing knowledge about Fibonacci retracements and moving averages is rewarding.
Downvoting a post can decrease pending rewards and make it less visible. Common reasons:
Submit