
Hello everyone! I hope you are all doing well and enjoying life with the blessings of Allah Almighty. I am happy to take part in the exciting challenge hosted by SteemitCryptoAcademy community . So, without any further delay, let's dive right in! Shall we ? ........, Okay , Okay😊! .
Explain the components of the Stochastic Oscillator. How does it help in identifying overbought and oversold conditions in the market? |
|---|
A popular indicator for analyzing stock market patterns is the Stochastic Oscillator. It facilitates traders' understanding of the overbought and oversold stocks. The %K and %D lines are the two key parts of this utility. %K compares the current pricing to the range of prices over a defined time frame.
The %K line is quick and sensitive to changes in pricing. It displays the stock price's momentum. The stock may be overbought if the %K line passes over a particular level. The stock may be oversold if it passes below. The line %D indicates a refined version of %K.
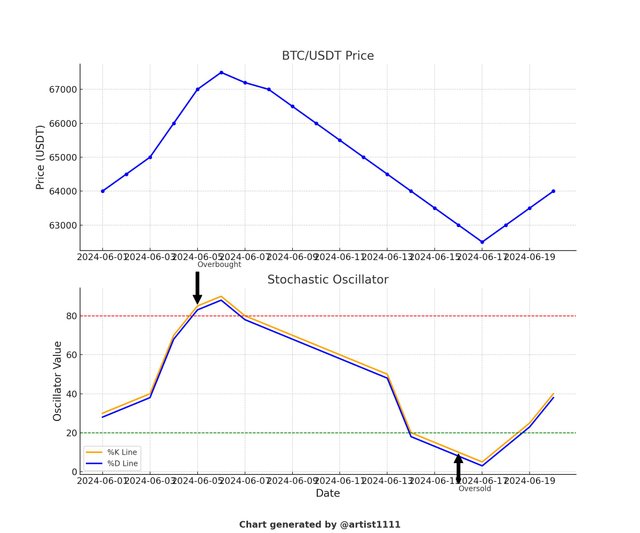 Oversold and overbought Oversold and overbought |
|---|
It is computed as a %K moving average, typically over three intervals. The signals provided by the %K line are independently verified by the %D line. When combined, they give a more accurate view of the stock's trend.
A potential buying is indicated when the %K line crosses over the %D line. The price may increase as a result of this crossover. On the other hand, a possible sell is indicated when the %K line crosses below the %D line. This crossing indicates the possibility of price decrease.
How does it help in identifying overbought and oversold conditions in the market? |
|---|
The Stochastic Oscillator helps in identifying overbought and oversold conditions in the market by comparing a particular closing price of a security to a range of its prices over a certain period. This is shown by the %K and %D lines.
 TradingView TradingView |
|---|
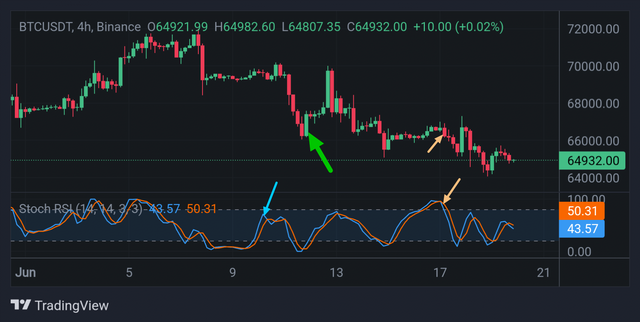
In the above chart, the Stochastic Oscillator shows two lines: the blue line (%K) and the orange line (%D). When these lines are above 80, the market is considered overbought. When they are below 20, the market is considered oversold.
In this second chart, the green arrow points to an overbought condition. Here, the %K line is above 80, indicating the price may soon drop. Shortly after, a decline in the BTC/USDT price can be observed.
The blue arrow highlights another overbought condition where the %K line is above 80, signaling another potential price drop. As indicated, the price of BTC/USDT decreases afterward.
Conversely, the orange arrows show oversold conditions where the %K line falls below 20. These points suggest potential buying opportunities as the market may rebound, leading to a price increase in BTC/USDT.
By using the Stochastic Oscillator in these ways, traders can better time their entry and exit points based on overbought and oversold signals, as clearly illustrated in the charts.
Describe the Parabolic SAR indicator and its application in identifying the trend direction. How is it interpreted differently in an uptrend compared to a downtrend? |
|---|
The Parabolic SAR (Stop and Reverse) indicator is a tool used to identify the direction of a trend and potential reversal points in the market. It is represented by a series of dots that appear either above or below the price on a chart.
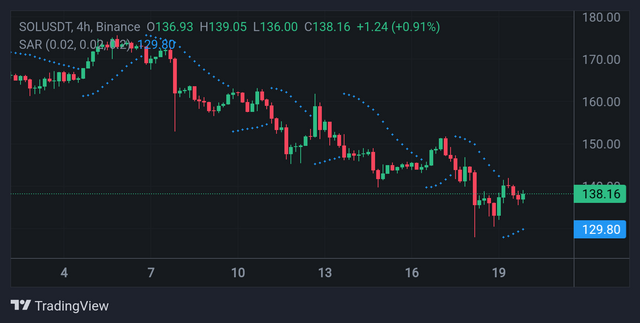
The application of the Parabolic SAR is plainly visible in the SOL/USDT pair chart following. An upward trend is indicated when the Parabolic SAR dots are below the price. This implies that traders might think about making a purchase during these times.
 TradingView TradingView |
|---|
For instance, the price of SOL/USDT rises from roughly 135 to approximately 150 between the fourth and eighth of the month, and the SAR dots are continuously apparent below the price. This suggests a solid upward trend and a favorable time to invest.
On the other hand, a downward trend is indicated when the dots are above the price. At certain periods, traders may think about selling. The price of SOL/USDT decreases from roughly 150 to almost 130 between the eighth and the fifteenth, while the SAR dots stay above the price. The persistent existence of SAR dots above the price denotes a significant downward trend, implying that now would be a good time to sell.
The Parabolic SAR's interpretation depending on the trend's direction. The SAR dots below the price signal to possible reversals until the dots that are flip above the price point indicate the start of an uptrend.
A downtrend is indicated by the SAR dots above the price point, which indicates that the trend will persist until they switch below the price point, which may indicate an upward reversal.
In summary, the Parabolic SAR is an excellent tool for identifying patterns and reversals.
It assists traders in making well-informed buy or sell decisions based on the direction of the trend, as shown by the chart's SOL/USDT price fluctuations. With its strong indications of appearance for possible entry and exit locations, this indicator is especially helpful in moving markets.
How can the combination of the Stochastic Oscillator and Parabolic SAR be used to create a robust trading strategy? Provide a detailed explanation. |
|---|
The two most popular indiactor Stochastic Oscillator and Parabolic SAR can be used to create a potent trading strategy through the use of their complimentary qualities. The strategy uses the stochastic oscillator to figure out overbought & oversold levels, which assists in determining entry and exit positions.
 Graphic Representation of both indicators Graphic Representation of both indicators |
|---|
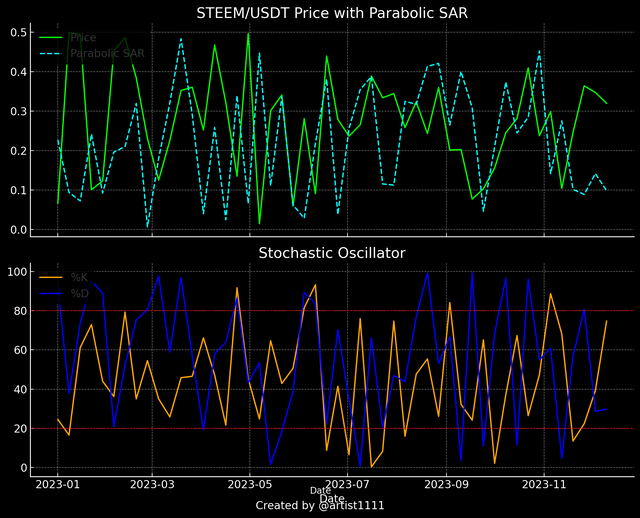
Confirming trend direction and possible reversals at the same time is the Parabolic SAR. For example, the graph presented illustrates a possible buying opportunity when the Parabolic SAR dots are below the price and the Stochastic Oscillator shows oversold circumstances with %K and %D lines below 20. Strong rising confirmation is highlighted by this convergence.
On the other hand, overbought circumstances, denoted by %K and %D lines over 80 and Parabolic SAR dots above the price, portend a potential sell-off and bearish reversal. Decision-making is strengthened by this alignment, which validates signals from both indicators.
Clarity is improved by using colors to distinguish between signals: red indicates a sale signal (overbought Stochastic with SAR above) and green indicates a buy signal (oversold Stochastic with SAR below).
With the use of this visual tool, traders can quickly determine the best times to enter and exit the market, increasing overall trading efficiency and lowering risk.
Using historical data, analyze a trading scenario for the STEEM/USDT pair where the Stochastic Oscillator indicated an oversold condition. How would you use this information along with the Parabolic SAR to make a trading decision? |
|---|
Analyzing the historical data from the provided charts, let's look at a specific period where the Stochastic Oscillator indicated an oversold condition for the STEEM/USDT pair.
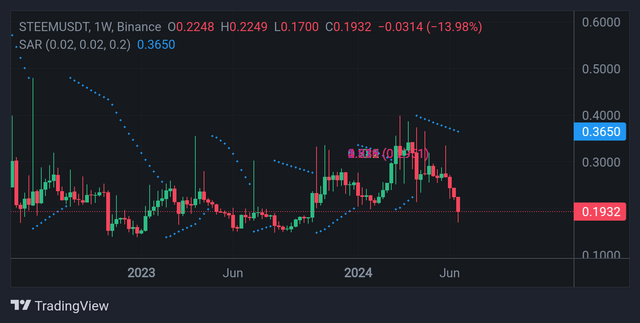 TradingView TradingView |
|---|
Early in 2023, an oversold situation was indicated by the Stochastic Oscillator, which displayed both the %K and %D lines crossing below the 20 level. The price of STEEM dropped to about $0.17 at this point. This implies that the price was cheap and might be ready for a correction upward.
At the same time, the Parabolic SAR dots started to move below the price candles, suggesting a downtrend, after initially being above them. This change suggests that an uptrend could possibly be about to reverse from an downward trend.
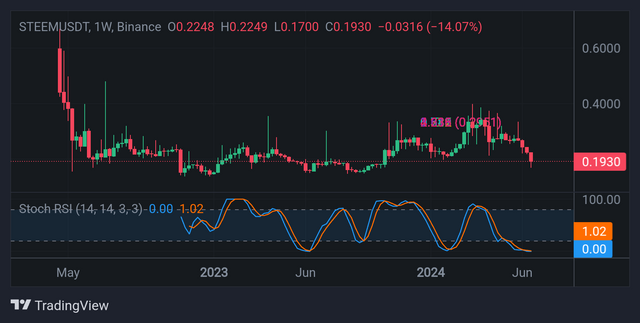 TradingView TradingView |
|---|
Before starting to rise, the price of STEEM began to show signs of steadiness around $0.17.
Looking the chart on the oversold data from the Stochastic Oscillator around $0.17 and the Parabolic SAR's verification of a trend reversal, a trader using this data might decide to open a long position.
STEEM can now be bought by the trader in anticipation of a price increase. All of these indicators would have encouraged the buyer to make the purchase of when the price started to rise from $0.17 to $0.22 and beyond, perhaps resulting in a profitable deal.
Combining the oversold signal from the Stochastic Oscillator with the trend resumption indication from the Parabolic SAR helps traders make more accurate choices.
Using both momentum and trend confirmation, this method aids in locating possible entry positions with a higher chance of success.
Perform a technical analysis on the current STEEM/USDT pair using both the Stochastic Oscillator and Parabolic SAR. Based on your analysis, what would be your trading recommendation? |
|---|
Analyzing the provided chart of the STEEM/USDT pair, we can utilize the Stochastic Oscillator and the Parabolic SAR to derive a trading recommendation.
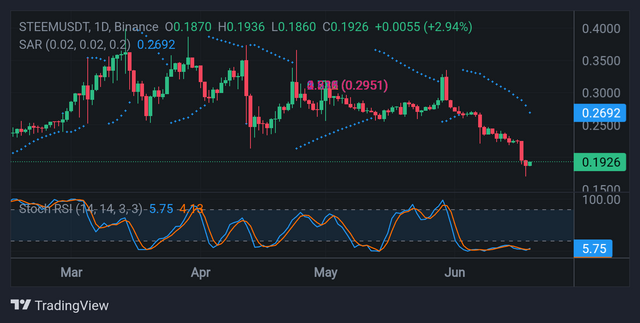 TradingView TradingView |
|---|
Stochastic Oscillator Analysis:
The Stochastic Oscillator, which shows %K and %D lines, is currently below the 20 level, indicating an oversold condition. The %K line (blue) is at 5.75, and the %D line (orange) is at 4.83. This suggests that the market is potentially oversold, and a price reversal might be imminent.
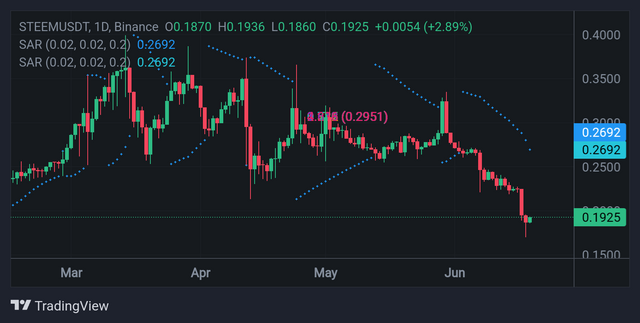 TradingView TradingView |
|---|
Parabolic SAR Analysis:
At this moment, the Parabolic SAR dots are above the price candles, suggesting that the decline continues to remain ongoing. There is, nonetheless, evidence that the price is beginning to level off at the $0.19–$0.20 range. A trend reversal would be confirmed if the price started in order to boost and the Parabolic SAR dots switched to being below the price candles.
Combined Analysis and Trading
Considering the Stochastic Oscillator's oversold signal as well as the present price stabilization around $0.1926, it is imperative to monitor the Parabolic SAR for confirmation of a trend reversal. An uptrend would begin if market prices increased and the Parabolic SAR dots crossed below the price candles.
Trading Recommendation:
- Buy Signal: If the Stochastic Oscillator %K line crosses above the %D line while these both are below 20, combined with Parabolic SAR dots moving below the price candles, consider entering a long position.
- Hold/Wait: It would be wise to wait to trade until stronger indications are revealed if the Parabolic SAR is not confirming the move and the Stochastic Oscillator stays oversold despite the absence of a crossing.
Traders can improve the quality and their decisions by continuously tracking these indicators. As of right now, the warning signs point to the possibility of a buying opportunity, but risk needs to be mitigated reduced and confirmation from the Parabolic SAR is required.
kind Regards
@artist1111

Adieu, folks!
May the winds of fortune
carry you to greatness!
May the winds of fortune
carry you to greatness!
We often see that without indicators, beginner traders often have difficulty and even make mistakes in analyzing the direction of stock movements, and parabolic SAR is an indicator that is very useful and makes it easier for beginners to analyze market movements even if there is a trend reversal.
This indicator also has 2 lines (above 80/below 20) which will make things even easier.
I just found out about %K and %D...
Enjoy reading your publications
Good luck for this contest friends... 👍👍👍
Downvoting a post can decrease pending rewards and make it less visible. Common reasons:
Submit
Congratulations, your comment has been successfully curated by our team via @steemdoctor1 at 5%
Downvoting a post can decrease pending rewards and make it less visible. Common reasons:
Submit
Upvoted. Thank You for sending some of your rewards to @null. It will make Steem stronger.
Downvoting a post can decrease pending rewards and make it less visible. Common reasons:
Submit
Your detailed information on Stochastics and Parabolic SAR indicator is very helpfull. These details can help traders on how to use these specific indicators especially to find overbought and oversold zones. Consistance following this can make better trading decision. Nice information.
Downvoting a post can decrease pending rewards and make it less visible. Common reasons:
Submit
Thanks for reading my post! Glad it helps you make better trading decisions.
Downvoting a post can decrease pending rewards and make it less visible. Common reasons:
Submit
Hello my dear friend awesome write up. Currently, Steem price is at the buy or hold level. Now I think we should take entry and hold because our token could go up to at least 24 cents in a very short period of time. Your analyzes were really excellent K line and The line presented very nicely 80/20. Best of luck.
Downvoting a post can decrease pending rewards and make it less visible. Common reasons:
Submit
Thanks for reading my post! I appreciate your feedback. Good luck trading!
Downvoting a post can decrease pending rewards and make it less visible. Common reasons:
Submit
Downvoting a post can decrease pending rewards and make it less visible. Common reasons:
Submit
Thank you for support , @bossj23 dear dude😊.
Downvoting a post can decrease pending rewards and make it less visible. Common reasons:
Submit