Hello everyone! I hope you are all doing well and enjoying life with the blessings of Allah Almighty. I am happy to take part in the exciting challenge hosted by SteemitCryptoAcademy community . So, without any further delay, let's dive right in! Shall we ? ........, Okay , Okay😊! .
Explain the Components of Bollinger Bands |
|---|
Bollinger Bands is a technical indicator used to measure the market volatility and find the trading signals. It is made up of three main components: a middle line, which is the simple moving average, and two standard deviation bands located above and below the SMA. These bands expand and contract with the price action and thus give information regarding the behavior of the market.
Components and Their Role
This middle band is an SMA for the average price over a fixed period. This allows fluctuations to smooth out while illustrating the overall trend of price. Upper and lower bands are located relative to the number of standard deviations that exists from the SMA. As price action extends past the bands, there can be a likelihood of reversal signals in the overbought or oversold situations.
Applying Bollinger Bands in Trading
Volatility is portrayed by the distance between bands. The bands are more expansive when volatility is high and a stronger price movement would occur. When the band is narrower, then it gives a signal that the market is less volatile and its trend might be stable to predict breakouts. Based on the conditions of these signals, entry and exit points in trading can be determined, and the adjustment of strategies can be altered according to market conditions.
 |
|---|
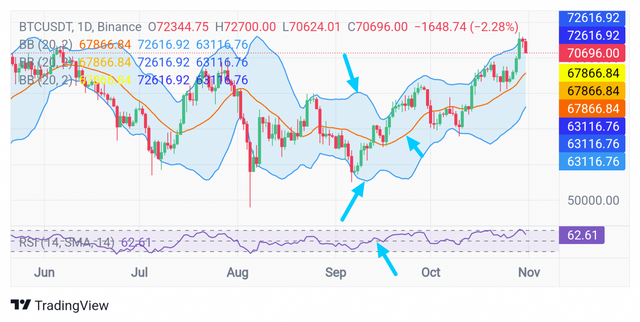
Bollinger Bands Components
Simple Moving Average: This is a line that plots the average price for the given period, which takes out the noise of short-term daily fluctuations and can be used to define overall trends. It acts as the middle reference point around which Bollinger Bands create their own range to watch by the trader.
Upper Band : The upper band is how many standard deviations away the SMA is, indicating just how far prices deviate from the average in turbulent times. When prices rise to or breach this level, it may be considered an overbought level.
Lower Band. The same number of standard deviations below the SMA, the lower band shows the extent to which prices usually drop from the average. If prices reach or break down below this point, then it may be an over-sold situation, that is, there may be a buying opportunity.
All these parts work together with the visualization of price volatility around an average to give traders an expectation of direction and improve trading strategies.
Analyzing Market Conditions with Bollinger Bands |
|---|
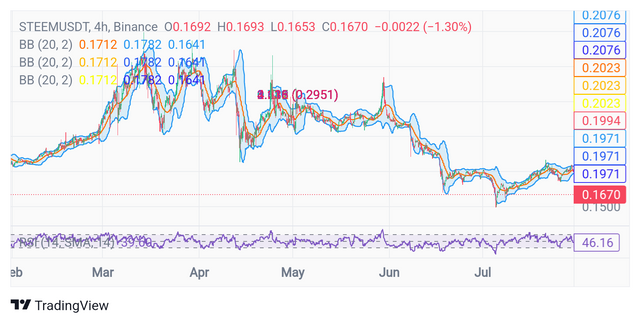
As is evident in the below STEEM/USDT price charts there exist different trends, and time-based volatilities. From the recently updated data from the very first chart, we could see $0.1670 as trading price in which STEEM is currently trading and this forms a consolidation from the depicted tighter movements by the Bollinger Bands.
 |
|---|
Narrowing bands indicate lower volatility compared to when STEEM had its rally in early this year, aiming for $0.24 - $0.26.
The latter spiking patterns indicate how powerful the chance is that STEEM may go parabolic if positive market sentiment will enter.
The graph below depicts when STEEM approached around $0.25. The places where the price reaches near $0.25 indicate massive points of resistance which STEEM was unable to break through with tenacity.
Despite these brief spikes, the price has mostly returned to lower support levels, indicating that STEEM is very sensitive to market price action. The Relative Strength Index (RSI), seen below, provides additional information.
 |
|---|
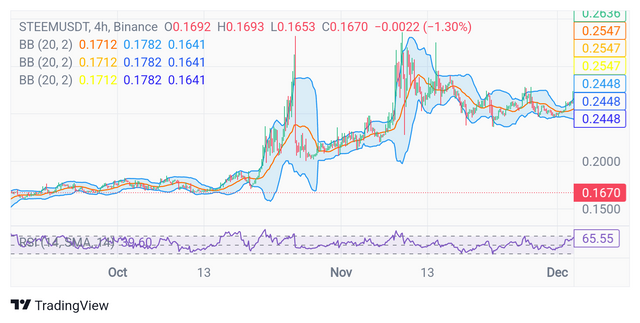
When buying pressure was increased, RSI entered overbought territory (above 70), but it reversed, which means that the bullish momentum could not be sustained.
Moving forward, if STEEM breaks above the $0.25 resistance level, it could be a bullish breakout that would attract more buyers. For now, however, it seems that the price is stabilizing in the $0.17 - $0.20 range.
This might be a support zone unless there is a change in the broader cryptocurrency market dynamics or some positive developments for STEEM.
To put it in a nutshell, the price of STEEM has withstood some pressure but still remains in a consolidation stage, waiting for the next catalyst in the market.
The tight price range may open up to an upward move if there is a conducive environment created by demand in the market and interest by investors.
From the charts, the market is neutral to slightly oversold according to the Relative Strength Index (RSI). The RSI on the latest data is around 46.16 in the first chart and 65.55 in the second, neither extreme overbought nor oversold.
Typically, an RSI above 70 is an overbought market, ready to pull back, while one below 30 means a market is oversold, meaning the price should react upward.
Both charts having RSI values that fall between 40 to 70 indicate the overall market is balanced but close to neutral to being sold over in the first graph.
This may also mean that the price of STEEM is in its consolidation phase as there isn't significant bullish or bearish momentum currently. For this time being, it is somewhat neutral, yet slightly skewed toward being an oversold state if RSI keeps pushing closer to 40.
A well-balanced RSI may indicate the STEEM price trades within the given range until something new and concrete comes around to give momentum a real push.
Identifying Volatility Patterns with Bollinger Bands |
|---|
Bollinger Bands assist in the study of market volatility as the bands become wider based on the changes in the standard deviation of the price movement.
Low volatility in price narrows and contracts the bands. Increasing volatility widens the bands, meaning that it signifies a change in trend or break-out in price.
From the Steem price chart above, we can clearly observe some instances of stretched-out bands, which are the indications of a possible reversal in trend.
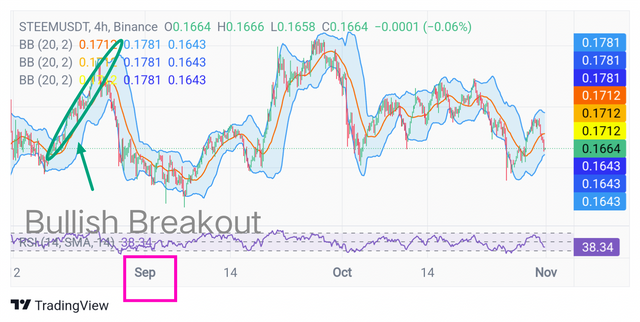
For example, in the first week of September, the sharp increase in price caused a band expansion, where there was an opening gap between the upper and lower bands.
 |
|---|
This gap is indicative of increased volatility and is possibly a bullish breakout in which the price of Steem breaks through the upper band.
Such expansion usually indicates that the asset has further to travel in the breakout direction, especially if it is accompanied by higher trading volumes.
However, once the Steem's price started its phase of consolidation while the volatility had reduced the bands compressed inwards around the middle of September, hence, resulting in a narrow band.
Compression shows that at such times the market fails to make a decision because no side, either a buyer or seller, is able to get a hold; thus, an upcoming break in the market is sure once there is a direction towards either end.
Traders expect this since a break from a narrow band always tends to develop a high trend towards any direction.
 |
|---|
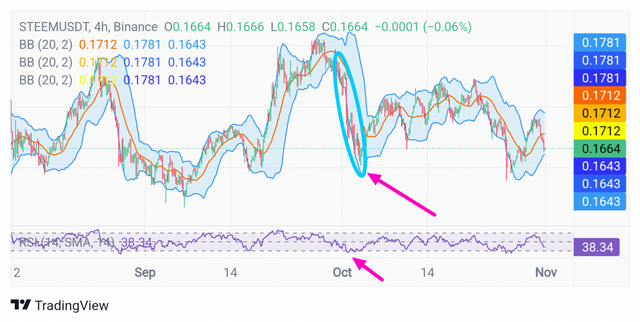
The second notable one is in the later part of October, which saw the bands again widen. The price of Steem had started moving down below the middle band-the 20-period moving average-establishing a bearish trend while it touched the lower band.
Expansion here indicated bearish momentum might continue, but then the price shoots back into the middle band where values of RSI also reflected over-sold conditions and this could go along with the reversal as well.
Effective use of Bollinger Bands requires combining with the rest of the indicators like Relative Strength Index (RSI).
To give an example, after price reaches or breaks lower down to the lower band, and the RSI triggers an oversold signal then there is a strong indication that the trend may reverse.
When price breaks the upper band but RSI remains at an overbought point then a pullback should be expected.
Overall, through Bollinger Bands, the trader might identify periods of high to low volatility, and what guides entry and exiting points are expansions and contractions in the bands.
However, by monitoring these bandwidth changes with volume and RSI, better predictions of potential breakout and trend reversal can be established, hence a better trading strategy.
Developing a Trading Strategy with Bollinger Bands |
|---|
Trading Strategy Using Bollinger Bands for the Steem Token
Strategy Overview:
The Bollinger Bands strategy for Steem shall identify potential entry and exit points through analyzing how a price interacts with upper, middle, and lower bands. The strategy makes its catch by catching price touchpoints to midline crossings while expecting continuations or reversals from trends. It makes bets on both bullish and bearish setups according to observed recent price actions as captured in the charts below.
 |
|---|
Bullish Strategy:
When Steem’s price approaches the lower Bollinger Band and shows signs of bouncing back towards the middle band, it may indicate a potential reversal to an uptrend.
Example Setup:
- In early September, Steem was trading at $0.16 and reached the lower band, which was an over-sold condition. RSI also read close to the oversold region, which supports the possibility of a reversal.
Entry Point:
- Enter a long (buy) position when Steem's price closes above the middle band after rebounding from the lower band. In this case, an entry near $0.17 could have been a great starting point as price moved through the middle band to show strength.
Exit Point:
- Set an exit target as soon as the price reaches or slightly breaks the upper Bollinger Band. In this scenario, Steem reached $0.20 once it touched the upper band, which was a great point to lock in some profits.
Stop-Loss:
- Place a stop-loss below the recent low, around $0.15, to manage risk in case the reversal does not materialize.
Key Idea: Use the lower band as an oversold indicator and the middle band as a confirmation for entering a long position. Exit at the upper band or a defined profit target.
 |
|---|
Bearish Strategy:
When Steem’s price approaches the upper Bollinger Band and begins to reverse toward the middle band, it indicates a potential bearish trend or downtrend.
Example Setup:
- In late October, Steem’s price rose to around $0.23 and touched the upper Bollinger Band. This interaction, coupled with an RSI nearing overbought conditions, suggested a potential reversal.
Entry Point:
- Enter a short (sell) position when Steem’s price closes below the middle band after touching the upper band. In this example, the entry would be near $0.22, as the price showed initial weakness.
Exit Point:
- Target the lower Bollinger Band as the exit point. In this case, Steem approached $0.19 as it neared the lower band, making it a favorable exit point to lock in profits.
Stop-Loss:
- Set a stop-loss above the recent high, around $0.24, to limit potential losses in case of a price rebound.
Key Idea: Use the upper band as an overbought indicator and the middle band as confirmation for entering a short position. Exit at the lower band or a pre-determined profit target.
Summary of Strategy:
Bullish Setup:
- Entry: Price rebounds from the lower band and crosses the middle band.
- Exit: Price touches or breaches the upper band.
- Example: Entry at $0.17, exit at $0.20.
Bearish Setup:
- Entry: Price touches the upper band and crosses below the middle band.
- Exit: Price reaches the lower band.
- Example: Entry at $0.22, exit at $0.19.
Chart Analysis:
This Bollinger Bands strategy, using price interactions with the bands as guides, reveals profitable entries and exits in the real charts shown below. The middle band acts as a confirmation signal for both trend reversals and trend continuations. The upper and lower bands are helpful for identifying overbought and oversold levels. This way, by using stop-losses and exit targets, traders can limit the risk and improve their decisions while trading the Steem token.
Predicting Price Movements with Bollinger Bands |
|---|
In regard to chart presentation of STEEM/USDT's Bollinger Bands, we look at this point to review the expectations and future probable price swings for the equity Steem.
 |
|---|
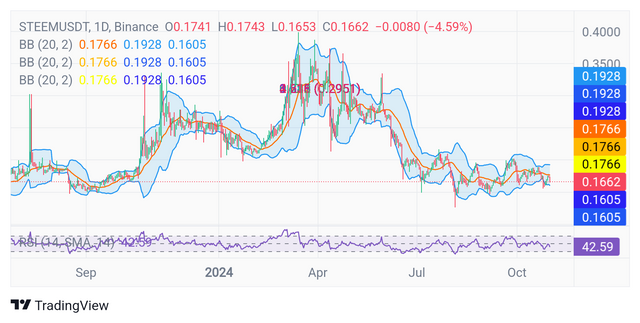
Current Price: The same is likely to stand at around 0.1662. Its positioning close to the lower border of a Bollinger band placed at low value of 0.1605 would suggest a bounce in the stock levels at its support levels, considering the same.
- Middle Band as Moving Average: The middle band may be considered as a simple moving average of about 0.1766. This can be the first resistance level if the price of Steem starts moving upward. If the price can break and hold above this level, it may indicate an upward trend toward the upper band.
- Resistance Level: The upper band stands at about 0.1928. In that regard, if the price advances towards it, this is where the price may potentially face resistance. The strong buy pressure could indicate a bullish breakout above the upper band, but on the other hand, failed breaks may indicate a range-bound or bearish continuation.
- Volatility Insights: Bollinger Bands have been tightened lately, which indicates low volatility. This may be interpreted to mean that the price will move either direction with a large move. Traders usually look for this as an indication of potential breakout in either direction.
In summary, at 0.1662, Steem's price is near a support at the lower band at 0.1605. If it bounces off, then the next resistance is about 0.1766 (middle band), and more resistance is located at 0.1928 (upper band). As the bands are tightening, this price is due for an increase in volatility soon, possibly toward a breakout.
kind Regards
@artist1111

Adieu, folks!
May the winds of fortune
carry you to greatness!
May the winds of fortune
carry you to greatness!