
Hello everyone! I hope you are all doing well and enjoying life with the blessings of Allah Almighty. I am happy to take part in the exciting challenge hosted by SteemitCryptoAcademy community . So, without any further delay, let's dive right in! Shall we ? ........, Okay , Okay😊! .
Explain Trailing Stop and Its Usefulness in a Bull Run |
|---|
A trailing stop is an order in trading, like any other kind. It operates dynamically and follows the move of price based on the asset's underlying price. Unlike a simple stop-loss order, which simply maintains its value to keep the losses only a certain number, a trailing stop will change direction with the price if it moves in your favor.
It establishes a fixed distance ahead, usually calculated in a percentage, or number of price points, or volatility from the current price. If the price is moving upward, a trailing stop price follows, which would keep some gains locked in.
 Binance Binance |
|---|
If the price goes in the opposite direction and hits the trailing stop, then the position would automatically close; that way, the trader would have secured some gains without sitting and watching the market all day long.
Trailing stops become quite handy in a bull run, because the prices are steadily advancing; they let one catch the full upward momentum while securing profits in the process.
In a bull market, traders want to stay invested as long as the trend remains strong. At the same time, they need a mechanism that will protect them if the market surprisingly shifts. A trailing stop balances that because it allows traders to ride the trend along with it without getting out of the market too early.
In fact, most of their emotional trading decisions are reduced because it can automate the risk management and profit-taking process.
Percentage-Based Trailing Stop: This type of trailing stop sets the trailing stop at a given fixed percentage below the market price. For example, if a 10 percent trailing stop is used, the stop level will rise as the price rises so that the 10 percent gap is maintained. Anytime the price falls by 10 percent from its extreme, the stop is hit, and the trade is closed. It is simple and follows with a percentage of price move and thus suitable for steady bull trends.
Fixed-Level Trailing Stop: A fixed level trailing stop employs a fixed price differential to trail the movement of the asset. For instance, a trader may specify a trailing stop that trails every $5 price change. Such a stop best suits trading when a trader foresees predictable and stable price increments, thus providing explicit protection on reaching some specific price milestones.
ATR-Based Trailing Stop (Average True Range) : The ATR-based trailing stop employs volatility about the markets in setting stop levels. The Average True Range, ATR, is a measurement of recent price movement of an asset for which a trailing stop is established in terms of a multiple of an ATR value. For instance, a trader might apply a trailing stop set to twice ATR whereby it adjusts itself as conditions go changing in the current market. This strategy is very useful to a bull run with high volatility as they capture the price movements and save traders from premature exit on small correction levels.
A bull run keeps the risk to the higher trend but protects profits. When the prices advance, the stop rises; therefore, the gains are secured.
In case the market is to reverse, the trailing stop becomes the stop-loss net, closing the trade at its most recent high point minus the trailing distance. It prevents losses from eating away at profits and keeps traders in the game at the most profitable times.
Since trailing stops automate profit-taking and risk management, such stops serve to lower constant market watching, and then these are certainly indispensable for beginners and even professional traders when the market is bullish.
I will use Binance to illustrate how to configure a percentage-based trailing stop. Find below the steps for a problem-free setup:
 |
|---|
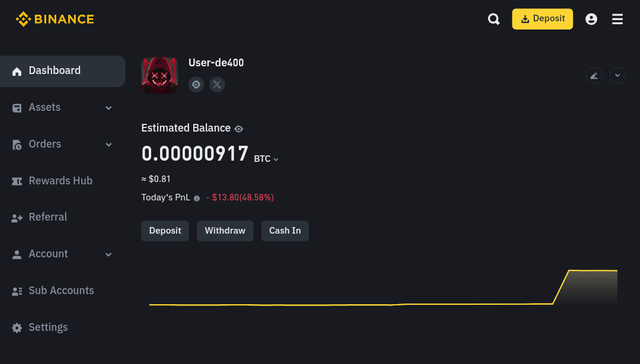
You need to access your Binance account. If you have not already created one, then you will have to do so and possibly complete any verification that the exchange requires. Once you are logged into your account, go to the "Trade" section.
 |
|---|
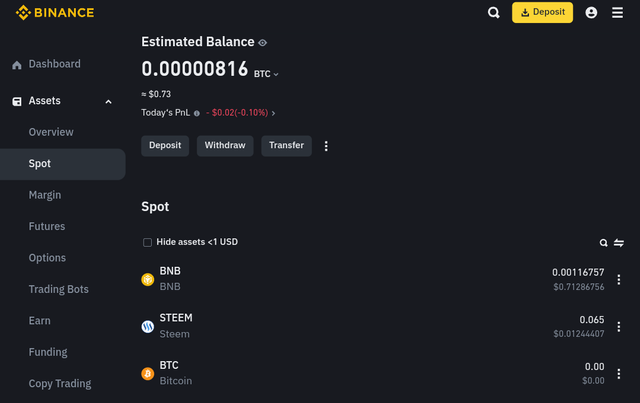
Select a trading pair that excites you-hear me, let's use the Steem/USDT pair during a bull run. And select "Spot" if you'd like to trade non-leverage assets, or "Futures" if leverage is what you're looking for.
 |
|---|
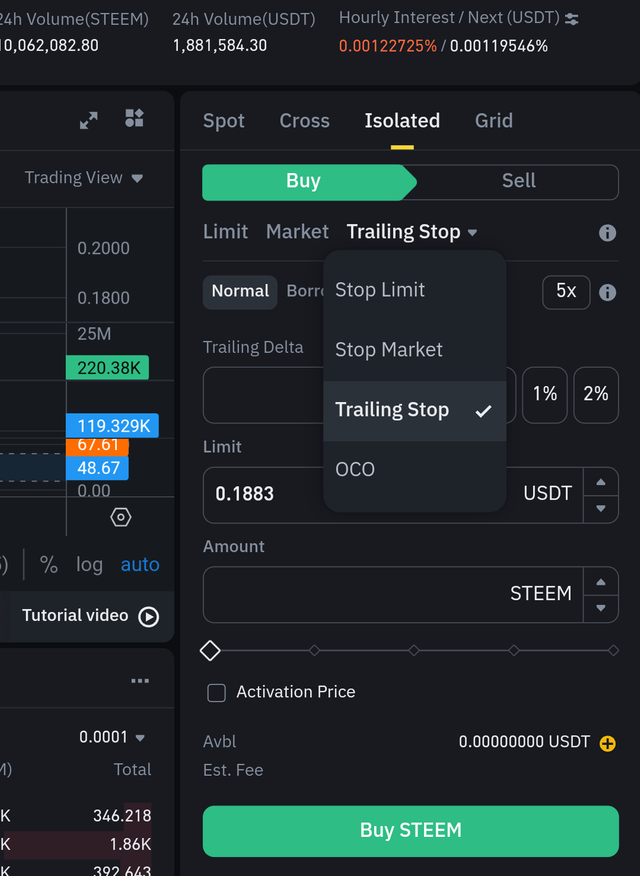
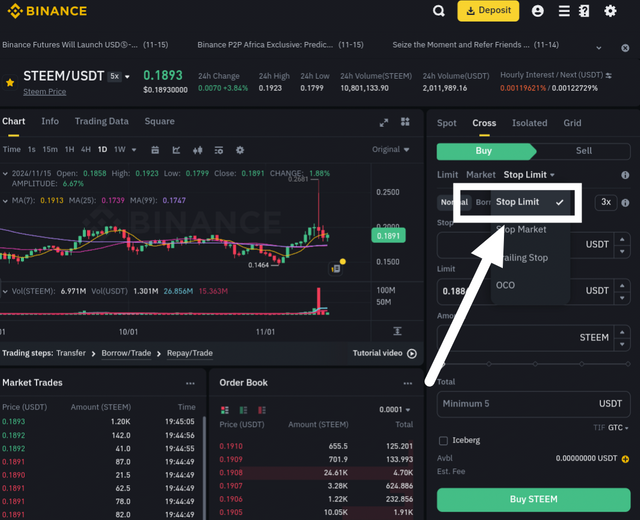
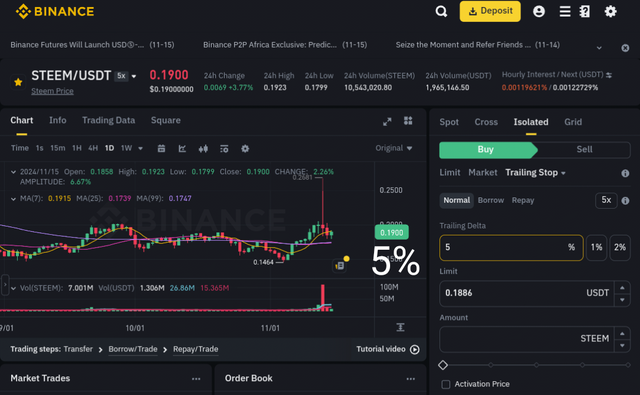
Find the "Sell" or "Short," depending on which is available, on your trading platform, next to which you look for the trailing stop feature-this might be under "Order Types" where you have to choose between different types as such as Limit, Market, and Trailing Stop.
 |
|---|
Pick the percentage distance that you like to have your trailing stop. Example: If you choose a 5% trailing stop, the stop-loss order will trail with the price up by way of having a gap of 5%. As the price continues to appreciate, the trailing stop automatically will rise with the price. Upon lower price at 5% below its highest level, the order gets triggered.
Confirm the trailing percentage to fit your risk level and strategy. Once you are satisfied with it, click the confirmation or place an order button to activate the trailing stop. Binance will now automatically track based on your settings.
Once you have put in your trailing stop, you can track the activity from inside the "Open Orders" section of Binance. You are allowed to change or even cancel your trailing stop if your conditions on the market change, allowing you space during the trade.
This setup in Binance automatically manages your risks, locks your profits and still maximizes the gain of your profits in the event of the case of a bull run.
Multi-Timeframe Analysis for Steem’s Bull Run |
|---|
The multi-time frame analysis of Steem in a bull run will explore trends over several different time frames-weekly, daily, and hourly-to get a more holistic view of what is happening in that specific market. In the weekly time frame, there can be a feel for where the big picture is about the trend to determine whether the market is indeed in a strong upward movement. It shows an important level of support and resistance, through which traders can get an understanding of the point at which the move could continue or struggle.
Look finer into the daily timeframe by identifying the entry points and stop-loss levels. The best time to enter the market can be found based on daily patterns and the adjustment of stops based on recent price movements to better control trades within the larger weekly trend and avoid some stops due to short-term fluctuations.
The hour timeframe is suitable for fine-tuning trades. It captures the price movement and even potential reversal in price at short term, thus allowing the trader to be able to make accurate entry of the pullback or a breakout. By correlating information from all the three timeframes, good decisions are made by the trader and thus ride on the bull run with some protection of profits.
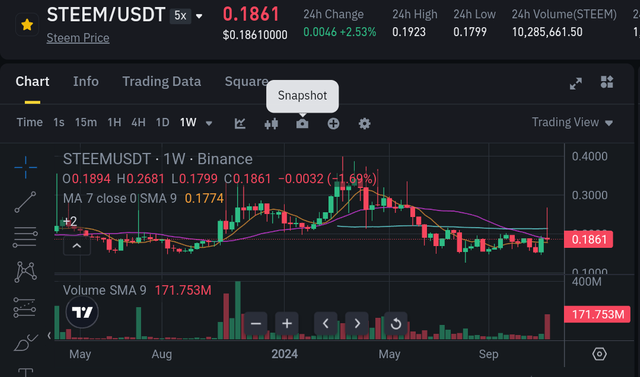
The Steem/USDT weekly chart proves that the spot around 0.1861 USDT is highly interacting with main moving averages.
 |
|---|
The level of the 7-day MA at 0.1774 USDT can function as a possible support and is, therefore, a great point for entry if the trader wants to pursue the price trend. The visible green volume spikes hint that it will continue to grow buying momentum in the nearest short-term term.
From the perspective of risk management, the weekly time frame supports placing more efficient stop levels. With places put below key moving averages, a trader can be protected from unpredicted slumps while leaving the price some space to breathe. This therefore ensures trades can remain active in a bullish environment without trading themselves into a premature exit, capitalizing on any potential price gains.
 |
|---|
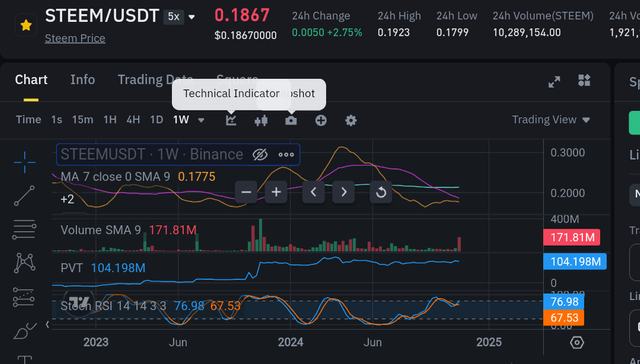
The Stochastic RSI, at 76.98, is leaving it to indicate that the market might be getting to overbought territories. This can advise traders to look for some profit-taking lines if the indicator crosses above critical levels. Checking weekly trends may help in giving a feel about the movement of the broader market and then fine-tune their strategies and take an informed decision to hold or exit the position.
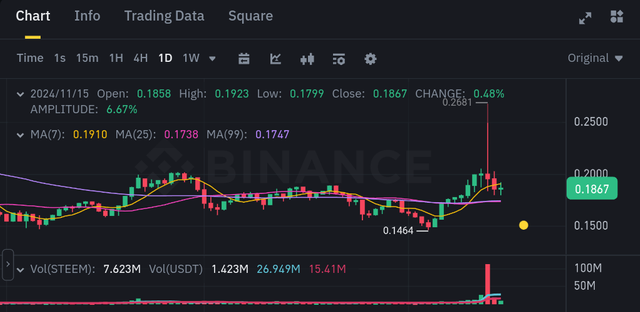
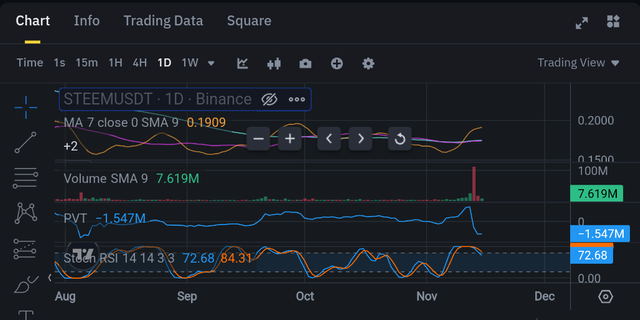
On the daily chart, a massive upward trend with prices toward 0.1867 is seen on the Steem/USDT pair, along with a rise in volume, which seems to be at the bull's side.
 |
|---|
This time frame is good for recognising the overall trend and could easily track the recent price actions, thus confirming the continuation of an uptrend with higher highs and higher lows.
Refining entry points would take in consideration combining shorter time frames, such as 1-hour or 4-hour charts. These will present intraday support and pulling back levels.
 |
|---|
Watching Stochastic RSI levels at conditions of being over-sold could mean a good opportunity to enter into a much bigger daily uptrend.
The dynamic support or resistance levels are a result of the key moving averages on the daily chart while setting stop levels and profit targets. Paying attention to lower timeframes can facilitate setting tighter stops and monitor momentum shifts as it improves the strategy for risk management overall by taking profit near such resistance levels indicated on the daily.
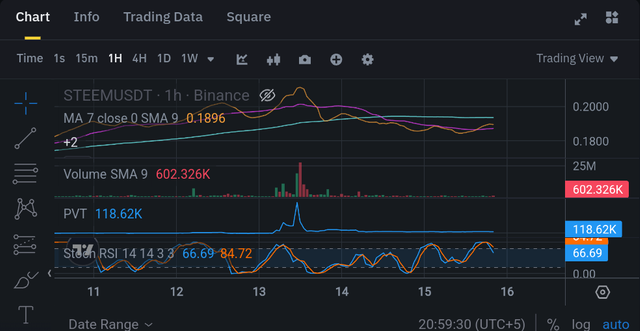
At around 0.1867 the pair has a volatile price on the hourly chart for Steem/USDT and has been quite volatile highs and lows, which makes this market dynamic in giving those entry and exit points to traders within this time frame.
 |
|---|
This short-term time frame indicates the intraday changes that allow for the recognition of an entry point that would align itself with the overall trend.
For the stop levels, monitoring some important moving averages that appear on the hourly chart would give tighter stops in case of some unexpected reversal. Moving averages associated with RSI and Stochastic indicators on the hourly timeframe guide the trader about possible overbought or oversold positions to fine-tune the risk management of short-term trades.
Combining hourly resistance levels with longer-term resistance areas enhances profit-taking decisions. As price approaches an hourly resistance level, partially or fully exit the position to maximize returns and step in tandem with the bigger trend visualized on a higher timeframe.
Adjusting Trailing Stops Based on Multi-Timeframe Analysis |
|---|
Adjusting trailing allow a trader to choose the highest possible gains with less risk, especially in an economy such as Steem/USDT. The mixed approach in using stop levels weekly and daily will be able to track closely in line with the trend while retaining long-term security. This method incurs more profit because it will accommodate both the broad swings of the market and volatility.
 |
|---|
Using the weekly average true range as the basis for such setting of trailing stops can provide that protective buffer in a long-term strategy. For example, if Steem/USDT has an ATR of 0.015 in the weekly chart, setting a trailing stop that moves only if the price shifts by that amount can prevent premature exits by the robot during such minor fluctuations. This buffer means that the trader will stay in the trade as long as the trend remains intact, allowing the trade to ride through lesser pullbacks and not trigger off a stop.
 |
|---|
Trailing stops might be moved rather more frequently on a daily time horizon as its price action is closer. If it traded at around 0.1867 with daily ATR at 0.005, it would tighten and allow the trader to close his profit in a more precise manner. Now if in case the price goes up by 0.005, this will shift the stop in the upper direction such that it closely follows the existing price. This method reduces the chance of losing gains from sudden daily reverses, hence very efficient in capturing short-term profits.
But combined weekly and daily adjustments give a more informative perspective. A weekly trailing stop will secure the long position over bigger swings of the market, whereas daily stops are set to proactively manage the trade in case of smaller price movements. On Steem/USDT, for example, this strategy means setting a fixed weekly stop behind the current price level by 0.015 and adjusting the daily stop with every 0.005 of the price movement. Therefore, the trade is protected by long-term downtrends and short-term noise at the same time.
With steady rises of Steem/USDT 0.1867 to 0.192, the daily stops can track the trend much closer and always capture the upward momentum. A weekly stop is your safety net; you only move your stop when there's a good gain that week. Thus, traders ride the waves of long-term uptrends and short-term volatility without interference from stop management.
This multi-timeframe strategy ensures a position of a trader shall neither be too rigid nor vulnerable to short-term price movements. While providing stability, daily adjustments serve progressively to secure profit. This approach is very suitable for volatile pairs such as Steem/USDT, where prices may suddenly make movements.
In essence, the flexibility and responsiveness of a trading strategy which balances both profit protection and trend-following are done through combining weekly and daily trailing stops based on ATR. By taking into account this method for Steem/USDT, traders can maximize returns while being able to deal efficiently with risks based on different timeframes.
Develop an Advanced Trading Strategy for a Bull Run |
|---|
An advanced trading strategy in capitalizing on a Steem bull run- The strategy to use would be multi-timeframe analysis with adaptive trailing stops. Trade with longer and shorter timeframes for the overall direction of the trend, and fine-tune on entry, exit, and adjustment of your trailing stop to take advantage of your profit as the price appreciates.
Entry Criteria:
It begins with weekly and daily frames, evaluating entry opportunities. For starters, it looks to see if it is in a confirmed uptrend on the weekly chart with higher highs and higher lows, which have been nurtured by some indicator confirmation, such as an MA crossover. For example, on the weekly chart, if the 25-day MA is above the 99-day MA, that is a positive trend. Once confirmed, switch to the daily chart for specific entry timing. For instance, lookout for bullish candlestick patterns or oversold readings on daily Stochastic RSI as entry signals into a long position.
Exit Criteria and Adjusted Trailing Stops:
Lock in profits by using trailing stops with varying ATR levels between the weekly and daily timeframes. Use a large trailing stop dimensioned from the weekly ATR level, such as 2 x the weekly ATR to offer additional buffer to avoid getting stopped out in minor longer-term trend following. As Steem's price moves higher, close the stop tighter by moving to a daily ATR trailing stop in which it will follow shorter price movements more closely.
This would mean, for example, that if Steem is trading at $0.20 and the weekly ATR is $0.01, firstly set a trailing stop $0.02 below the entry. When the price hits major milestones (e.g. every 10% rise), switch to a daily ATR stop. If the daily ATR is $0.005, then the trailing stop would now move on every $0.01 gain, locking up profits as the bull run progresses without giving too much back in the meanwhile price fluctuations.
Optimizing Gains and Minimizing Risk:
When the bull run matures, bring the trailing stops closer to the price and scale the distance off a bit based on the price action. For instance, if the uptrend starts accelerating, switch to half ATR on the daily time frame so that the stop can closely follow the price but still gives room for growth. Partial profit-taking at key resistance levels in strong bullish rallies with sharp upswings by liquidating part of the position while holding on to the rest with trailing stops.
Use hourly charts to look for reversal patterns that warn of an exit. A bearish divergence to indicators like RSI, or a price double top on the hour chart might be a reason to close part of the position, locking in some of the gain. Another example would be to pay attention to volume; if volume collapses during a price peak, the trend could be running out, and it is time to take some money off the table.
In Summary:
This would mean it is aimed at aligning the long-term trend with multitime frame adjustments in order to protect the bull run. Layering ATR-based trailing stops across weekly and daily charts by adapting to price moves by Steem while taking partial profits at appropriate levels in a process to optimize returns while positioning the risk of the bull run on Steem.
Precautions and Limitations of Trailing Stops and Multi-Timeframe Analysis |
|---|
Good tools in a bull market are trailing stops and multi-timeframe analysis; however, they do have their restrictions and risks, and understanding them can avoid pitfalls of common mistakes and become more informed. Here is some look at key limitations, risks, and tips for navigating these tools effectively.
Limitations of Trailing Stops:
Trailing stops protect profits but can be wrong and stop a position at a bad time, especially when market action is against you. In the case of a strong bull market where most pullbacks are brief and sharp, the trailing stop should be set farther away in order not to get stopped out. It may allow the price to rebound or even keep ascending rapidly as an investor is forced out of a position.
Additionally, trailing stops don’t account for market conditions or external factors, meaning they can trigger exits during temporary dips unrelated to the larger trend.
Limitations of Multi-Timeframe Analysis:
While multi-timeframe analysis allows a trader to see the greater perspective, it is quite frequently that creates conflicting signals. For example, the daily chart may be showing a bullish pattern, but on the hourly scale, the reversal is hinted at. Such a conflict might cause hesitation or may lead one to indecisiveness with missed entries or untimely exits. Also, frequent switching between these timeframes may result in "analysis paralysis," whereby overanalyzing several charts causes confusion rather than enlightenment.
Risks in a Bullish Market:
During a bull market, the reliance on trailing stops might become too excessive as traders assume that they will protect their potential gains forever. A sharp decline can cause trailing stops to trigger at a price that is lower than the trader expected due to slippage in markets with low liquidity. There is also a danger of ignoring longer-term trends for short-term signals, leaving one to prematurely exit a bullish trend that would've continued with higher returns.
Tips to Avoid Preventive Halts:
To give the position a little breathing room in the uptrend before being stopped out too early, a larger trailing stop might be used-for instance, twice the ATR for the day. Another approach is only to adjust the trailing stops following large price movements-such as 10% increases in price-rather than adjusting with every minor uptick. This then will capture most of the overall trend while avoiding the premature exits on minor pullbacks. Setting trailing stops based on key levels of support identified in higher timeframes, such as the daily or weekly, also forms a cushion against rapid reversals.
Trend Reversal:
Interpret Trend Reversals Across Multiple Timeframes. Focus on the weekly and daily charts with indicators, such as 50-day MA, as a clearer way in establishing the major trend. Be sure to cross-check in the hourly chart for more timely price action clues.
For example, if the hourly chart shows a bearish divergence in RSI but the daily trend remains up, it may indicate a potential short-term correction rather than a complete reversal. Waiting for confirmation on the daily chart, say, a break below the 25-day MA, could confirm a true reversal before exiting the bullish position.
Balancing Timeframes in a Bull Market:
To avoid premature exits, one needs to balance in different timeframes. Using shorter timeframes can help one spot potential warning signs, but nothing should be done until longer timeframes confirm it-and indeed, this is what should be done: well-established rules for how different timeframes interact with each other, e.g., "exit only if both charts of daily and hourly timeframes indicate the downtrend."
In Summary:
Trailing stops and multi-timeframe analysis are two good but imperfect tools. With wider stops, insisting on longer time frames for high-probability signals in the trend, and confirming these multiple charts, the trader rides out risks of early exits and fake reversals in the bullish market while adjusting these tools incrementally.
kind Regards
@artist1111

Adieu, folks!
May the winds of fortune
carry you to greatness!
May the winds of fortune
carry you to greatness!
I learned a lot from your writing and the post was very informative. I want to know, how do you make decisions combining small and large timeframes. Good luck for the contest.
Downvoting a post can decrease pending rewards and make it less visible. Common reasons:
Submit