
Hello everyone! I hope you are all doing well and enjoying life with the blessings of Allah Almighty. I am happy to take part in the exciting challenge hosted by SteemitCryptoAcademy community . So, without any further delay, let's dive right in! Shall we ? ........, Okay , Okay😊! .
Question 1: Understanding Market Cycles |
|---|
Markets may be understood by studying cyclic moves on market performance, which applies to virtually every tradable asset, including Cryptos like Steem/USDT. The patterns identified are repetitive and have assisted forecasters in making accurate assumptions about price action. Studying these phases can help minimize risks and allow for investment decisions.
Each cycle has four major phases: accumulation, expansion, distribution, and contraction. These phases represent changes in supply, demand, and market psychology that affect the flow of capital between buyers and sellers. Understanding these phases in depth gives traders an edge.
These phases do not have to be specific time frames, but can occur over several time frames ranging from hourly charts to yearly trends. The determination of these cycles requires a good mix of technical analysis and market knowledge.
Market cycles and multi-time frame analysis allow for the alignment of strategies with existing trends. This structure allows for the identification of high-probability opportunities while reducing the risk of impulsive decisions.
In the following breakdown, we will explore the accumulation, expansion, distribution, and contraction phases in detail, defining their characteristics and practical implications.
1. Accumulation Phase
After a long price pullback, the Accumulation Phase ends with stable prices due to increased demand from smart money—institutional investors and informed traders—resulting in low-volatility sideways price activity and slow buying pressure building. It is the prelude to a new bullish upswing.
2. Expansion Phase
The Expansion Phase is characterized by a rapid increase in prices driven by strong bullish sentiment and rising demand. This phase often features sharp price movements, increasing trading volumes, and widespread optimism. Retail investors frequently enter the market, further accelerating price growth.
3. Distribution Phase
The Distribution Phase signifies the peak of the market cycle, where prices reach their highest levels. Volatility increases as traders begin to take profits, creating fluctuations. Smart money often exits during this phase, while retail traders enter, anticipating continued price growth.
4. Contraction Phase
The Contraction Phase After the distribution stage, the market undergoes a sharp price fall with dominant bearish sentiment. Downward movements occur rapidly since selling pressure outstrips demand. The contraction phase is usually associated with panic selling that creates undervaluation and gives way to a new accumulation phase.
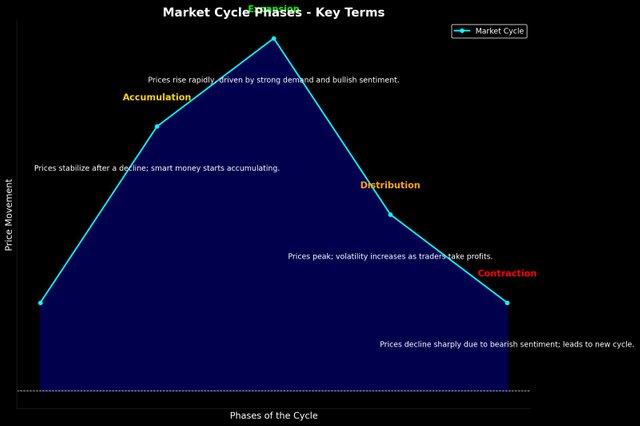 Graphical demonstration of the "Market Cycle" Graphical demonstration of the "Market Cycle" |
|---|
The above diagram presents the Market Cycle Phases with a sleek black background and vibrant, clear labels for each phase:
- Expansion : High price growth fueled by demand and positive sentiment.
- Distribution: Peak prices with heightened volatility as profits are taken.
- Contraction: A sharp drop in prices that shows a bearish attitude.
 TradingView chart TradingView chart |
|---|
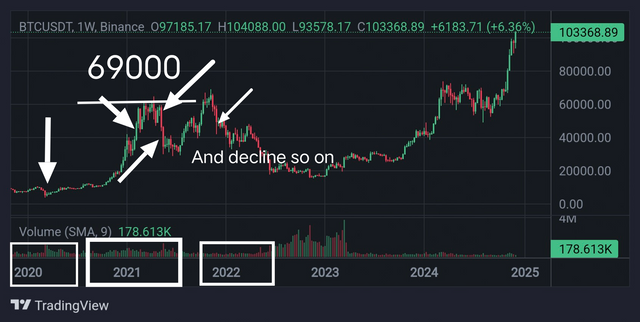
Above is the weekly BTC/USDT chart showing clear market cycle phases.
Accumulation Phase (2020): The stable prices following a long drop are characterized as the accumulation phase, where long-term investors build up their positions ahead of a trend reversal.
Expansion Phase (2020-2021): The price of Bitcoin exponentially grew, fueled by increased demand and positive sentiment. In the expansion phase, most new entrants enter hoping to make profits.
Distribution Phase (Late 2021) : Price volatility increased, with Bitcoin peaking around $69,000. This phase was characterized by profit-taking, which manifested as a reduced bullish momentum.
Contraction Phase (2022) : A sharp decline followed because of bearish sentiment and market corrections. It is crucial to identify such phases for effective cryptocurrency trading strategies.
1. Accumulation Phase
Significance:
The accumulation phase marks the beginning of a new cycle and is critical for long-term investors. Prices tend to be stable, making this the perfect time to buy assets at low valuations just before the market lapses into an expansion phase. Smart money often works here and sets the stage for future growth.
2. Expansion Phase
Significance:
This is a good phase as the momentum traders may be able to capitalize on rapid price increases. More demand and optimism support the prices, and hence is an excellent time to ride bullish trends; identifying early, in this case, means substantially profiting because the prices will continue to go up.
3. Distribution Phase
Significance:
The distribution phase is critical for profit-taking. Prices reach a peak, and volatility increases because market participants are selling their holdings. Smart traders exit their positions to lock in gains. This prevents losses from holding assets during a reversal into the contraction phase.
4. Contraction Phase
Significance:
The contraction phase signals declining prices, providing opportunities for short sellers or those looking to hedge risks. For long-term investors, this phase is essential to avoid panic selling and instead prepare for the next accumulation phase, where assets can be purchased at discounted prices.
Understanding these phases will help traders anticipate market behavior, align strategies, and optimize their cryptocurrency trading performance.
Question 2: Applying Multi-Timeframe Analysis |
|---|
Multi-timeframe analysis represents a powerful trading tool, permitting the evaluation of market trends and reversals by observing price action over different time intervals. That is, combining higher timeframes-including weekly or daily-to understand the bigger picture, and lower timeframes-including hourly or 15-minute-to pinpoint precise entry and exit points-will allow more precise strategies.
This approach is particularly effective when applied during market cycle phases such as accumulation, expansion, distribution, and contraction, as these cycles unfold differently on various time horizons.
Understanding how multi-timeframe analysis complements market cycles ensures that traders avoid false signals, recognize opportunities, and manage risks effectively.
How Multi-Timeframe Analysis Identifies Trends and Reversals
Evaluating Trends Across Timeframes:
During the accumulation phase, higher timeframes, such as the weekly chart, typically exhibit sideways movement or stabilization, while lower timeframes (daily or 4-hour) can indicate early signs of bullish reversals. This alignment helps traders identify the beginning of a new trend.Catch Reversals During Expansion and Distribution
In the expansion phase, lower time frames will show short-term pullbacks in the middle of a longer-term ascending trend visible on higher time frames. Equally, in the expansion phase, the weekly chart may reveal resistance formation, while hourly charts will isolate breaks or failed attempts to maintain highs in the distribution phase.Confirming Bearish Trends in Contraction:
During the contraction phase, higher timeframes show steady downtrends. Lower timeframes enable a trader to time the short at the right moment, catching the dead cat bounce before a trend continues lower.Risk Management and Optimization:
Multi-timeframe analysis reduces risks by ensuring that a trade happens in line with the general trend available on higher timeframes, thus ensuring that overtrade does not occur during volatile phases such as distribution or contraction.
Multi-Timeframe Effectiveness Evaluation
Synergizing market cycles with multi-timeframe analysis offers a robust structure to base informed trading. The methodology presents transitions between phases, filters out noise, and allows traders to adjust their strategy on the fly.
However, if it's too dependent on lower timeframes, there's a high chance of receiving false signals. On the other hand, if higher timeframes are overlooked, opportunities may be missed.
For long-term success, striking that perfect balance is crucial.
Analysis of STEEM/USDT Pair Using Stochastic Oscillator
The Stochastic Oscillator is a momentum oscillator that can help to identify conditions where an asset has been overbought or oversold in trading. It does this by comparing an asset's closing price to its price range within a specified time frame. It consists of two lines. These lines are:
- Blue Line (K%): It reflects the current position of the price compared to its range.
- Orange Line (D%): The blue line smoothed moving average.
If the blue line moves above the orange line at the lower end (less than 20), this is a buy signal. On the other hand, when the blue line falls below the orange line at the higher end (above 80), this indicates selling pressure. This is an excellent indicator for ranging markets. It is well-suited for the STEEM/USDT pair.
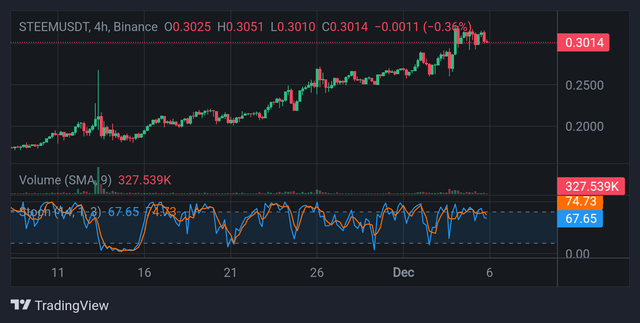 Stochastic Oscillator "4H time frame" Stochastic Oscillator "4H time frame" |
|---|
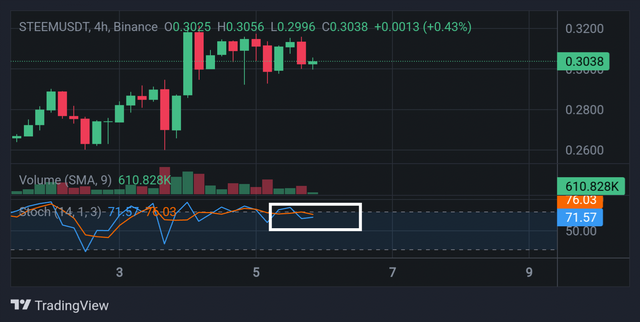 Closer look of 4H time frame "K line crossed the L line but close to 80" Indicating possibly overbought condition Closer look of 4H time frame "K line crossed the L line but close to 80" Indicating possibly overbought condition |
|---|
4-Hour Timeframe Analysis
In the 4-hour chart, the STEEM price is trading around $0.3014. The Stochastic Oscillator reflects the blue line to cross below the orange line close to the overbought zone (80). This points to rising selling pressure and a possibility of a reversal to the lower side. The price action hints at minor upward thrusts but lacks follow-through strength; hence, it will continue to consolidate in the $0.30 region in the near term.
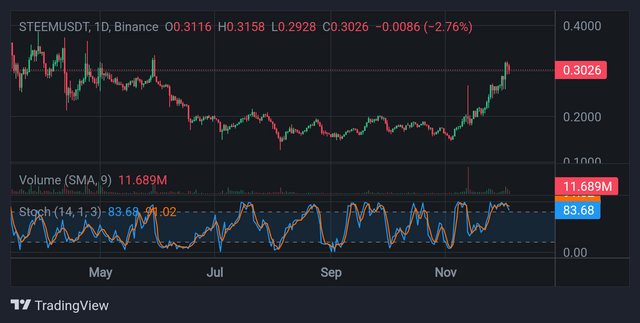 Stochastic Oscillator "Daily Time frame" Stochastic Oscillator "Daily Time frame" |
|---|
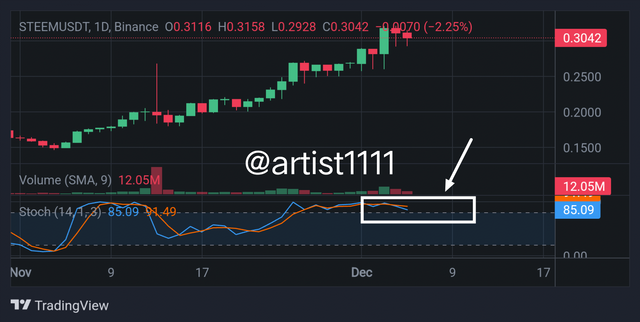 Closer look of Daily time frame "K line crossed the L line but over 80" Indicating overbought condition Closer look of Daily time frame "K line crossed the L line but over 80" Indicating overbought condition |
|---|
Daily Timeframe Analysis
On the daily chart, STEEM price has touched $0.3026. The Stochastic Oscillator is approaching the overbought zone (above 80) with the blue line above the orange line. A further signal of continuation of the uptrend will be necessary but a word of caution; it's when the blue line crosses below when selling would dominate, possibly back to the support levels of $0.28.
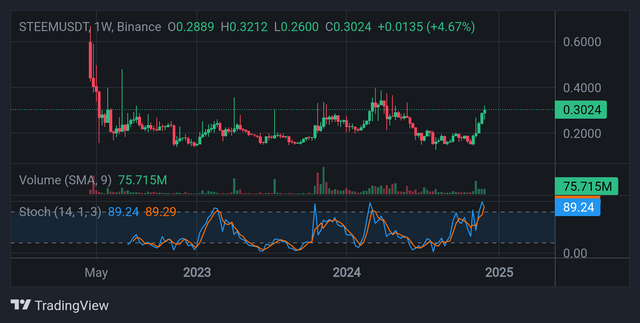 Stochastic Oscillator "Daily Time frame" Very higher buying pressure Stochastic Oscillator "Daily Time frame" Very higher buying pressure |
|---|
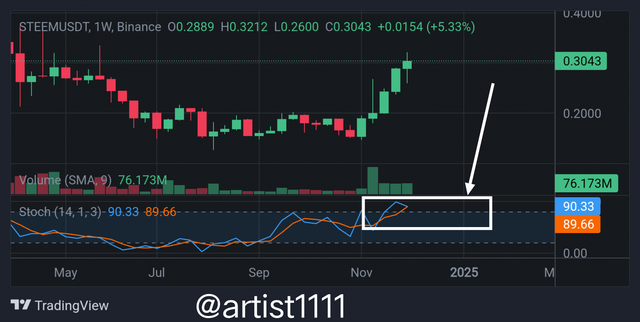 Closer look of Daily time frame "K line crossed the L line but over 80 , reached to 90" Indicating very overbought condition Closer look of Daily time frame "K line crossed the L line but over 80 , reached to 90" Indicating very overbought condition |
|---|
Weekly Time Frame Analysis
On the weekly chart, the STEEM price has reached $0.3024, and the Stochastic Oscillator is showing an overbought region (above 80), with both the blue and orange lines near their peaks.
This is a strong indication that the upward momentum is good but possibly getting exhausted. Historically, when the oscillator gets to these levels, it has often led to a period of consolidation or a minor correction. If the blue line falls below the orange line, it could mean that the selling pressure will drive the price back to the $0.28 range.
But if momentum is sustained, the next resistance could be at $0.35. This timeframe indicates a cautious optimism for longer-term traders, since price is testing major zones.
Observation Across All Timeframes
After observing the STEEM/USDT charts on the 4-hourly, daily, and weekly time frames, the following stand out key observations:
The 4-Hourly Chart:
The price shows short term upward momentum to the high of $0.3014 level. The Stochastic Oscillator is coming close to overbought levels. Hence, current short-term bullish activity may still face the pullback as pressure from a sell increases on this particular time frame.Daily Chart:
On the daily chart, the STEEM price is $0.3026, and the oscillator is deep in the overbought region. This shows continued strength, but a rally is going to face resistance sooner rather than later. If the blue line crosses below the orange, expect a short-term correction to $0.29-$0.28.Weekly Chart:
The weekly timeframe shows a broader bullish trend, with the price holding at $0.3024. The Stochastic Oscillator is also in the overbought zone, reflecting strong buying momentum. However, historically, such levels are followed by consolidation or minor corrections.
Prediction for December 2024
Considering the above observations, the STEEM/USDT pair is likely to experience a mixed phase in December:
- Short-Term: The price may trade between $0.30-$0.32, with minor corrections to $0.29 as selling pressure starts to build on shorter timeframes.
- Mid-Term (End of December): If the bullish momentum continues, the price may test $0.35. This will require increased trading volume and continued buying strength.
- Bearish Risk: A break below $0.28 on heavy selling may indicate bearish sentiment, pulling the price lower towards $0.26.
Overall, the STEEM price seems set for a cautious uptrend in December, but traders should watch volume, key resistance at $0.35, and Stochastic Oscillator signals for confirmation.
Question 3: Combining Market Cycles with Multi-Timeframe Analysis |
|---|
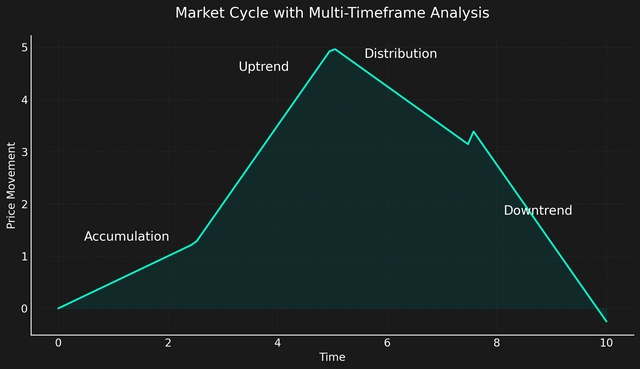
Combining Multi-Timeframe Analysis with Market Cycles Market cycles—accumulation, uptrend, distribution, and downtrend—are essential in understanding the behavior of prices. If multi-timeframe analysis is combined with these cycles, a trader can hone his strategies in order to make the best decisions even in highly volatile markets. Let's see how these tools combine and complement each other.
Market Cycles Market cycles are phases of price movement:
- Accumulation Phase: Prices stabilize after a decline, marked by low volatility and volume.
- Uptrend Phase: Buying momentum dominates, pushing prices higher.
- Distribution Phase: A plateau forms as sellers begin entering the market.
- Downtrend Phase: Selling pressure increases, driving prices lower.
Each cycle offers unique opportunities, but identifying the current phase is crucial to position yourself effectively.
Multi-Timeframe Analysis: A Comprehensive Perspective
Multi-timeframe analysis is the process of looking at charts on various timeframes: short-term, for example, 4-hour; medium-term, such as daily; and long-term, such as weekly. It helps spot trends, reversals, and key levels.
- Short-Term (4H): Best for catching immediate price action and identifying entry/exit points.
- Medium-Term (Daily): Reflects ongoing trends and confirms the direction of price.
- Long-Term (Weekly): Reveals the broader market structure and aligns with macro cycles.
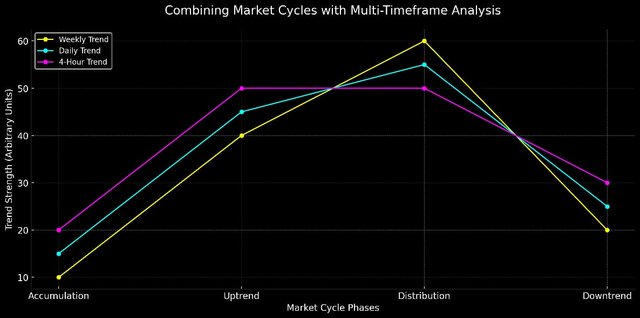
Combining Multi-Timeframe Analysis with Market Cycles
- Accumulation Phase:
- On the weekly timeframe, the Stochastic Oscillator often shows oversold conditions, and the price consolidates near key support levels.
- The daily timeframe confirms accumulation with narrow-range candles and steady volume.
- In the 4-hour timeframe, short-term breakouts indicate the start of new momentum.
Tactic: Go long as the 4H chart displays bullish divergence, which is consistent with accumulation on higher timeframes.
Trend Phase:
- The weekly chart displays higher highs and higher lows, accompanied by increasing volume.
- The daily chart confirms the trend with moving averages as dynamic support.
- On the 4-hour chart, pullbacks to support zones offer low-risk entries.
Strategy: Use the 4H chart for entry points during retracements while holding positions for medium to long-term gains.
- Distribution Phase:
- In the weekly timeframe stochastic indicators move into overbought conditions, meaning less potential price upside.
- A daily chart display a price pause, exhibiting long wicks and failing momentum.
- A 4 hour chart will depict intra-day sell offs followed by sharp reversals.
Strategy: Hike stop-loss levels or start scaling out of positions if the price continues to lose strength across timeframes.
- Down Trending Phase:
- The weekly chart shows lower highs and persistent selling pressure.
- On the daily chart, the price fails to break above resistance, further sealing bearish dominance.
The 4-hour chart shows volatile swings but with a clear downside bias.
Strategy: Use short-term timeframes to enter short positions on retracements, confirming the downtrend from higher timeframes.
How These Tools Complement Each Other
Multi-timeframe analysis and market cycles together provide a comprehensive approach to trading, especially in volatile markets.
- Wider View: Market cycles set the stage, then multi-timeframe analysis helps smooth out the execution.
- Risk Management: Short-term signals are only confirmed by long-term cycle alignment, thus reducing false entries in noisy markets.
- Higher Probability: Trend and reversal validation before capital commitment builds confidence in the trade.
 Market cycle "Simple trend" Market cycle "Simple trend" |
|---|
For instance, during a volatile period, the 4-hour chart may generate a false breakout, which is ruled out by a confirmation on the daily chart, thus avoiding the entry in advance. Similarly, a weekly chart alerting the trader to a change of market cycle will prepare him for reversing the larger trend.
Aligning multi-timeframe analysis with market cycles enhances your ability to adapt to market changes. It combines the precision of shorter timeframes with the reliability of broader cycles, enabling traders to stay ahead in volatile conditions. This approach ensures your strategies are well-informed and better equipped for sustainable success.
 Market cycle phases "Complex chart graph Market cycle phases "Complex chart graph |
|---|
Question 4: Developing an Advanced Trading Strategy |
|---|
Advanced Trading Strategy for STEEM/USDT in December 2024
I will be using multi-timeframe analysis in combination with market cycle phases to make vital trading decisions for STEEM/USDT during the month of December. We will analyze the market from weekly, daily, and 4-hour charts that will create a comprehensive view of where the market is headed. Let's see how it is done:
1. Market Cycle Analysis:
Looking to the current market situation recent charts and price movements of STEEM/USDT, the market is in an Uptrend phase on both the weekly and daily timeframes. The recent bullish price movement indicates that the pair is likely moving from the Accumulation phase to an Uptrend phase. The 4-hour chart, however, shows that there may be short-term pullbacks or consolidation before the next strong leg up.
In the weekly chart, the STEEM/USDT remains in a consolidation or accumulation phase and has just begun to show signs that a new bullish trend is beginning. Daily and 4-hourly charts show that corrections from the short-term are there to be bought into at lower prices, thus confirming to the potential of strong bullish trend from December.
2. Entry Criteria:
Primary Entry Signal:
Wait for a confirmed breakout in the 4-hour chart. If STEEM/USDT forms a bullish engulfing pattern or a positive Stochastic crossover (blue line crossing above the orange line) after a minor pullback or consolidation, it is a good buy signal.
Entry at Breakouts: On the daily chart, look for a breakout above strong resistance levels such as 0.35 USDT and 0.40 USDT. If the price breaks above these levels, expect to have further upside momentum.
Market Sentiment Alignment: Ensure that on social media platforms and the news regarding STEEM and cryptos in general that remains positive. This may act as an additional confirmation.
Example: If STEEM/USDT breaks above 0.30 and continues trading above it on the 4-hour chart, a long position can be entered with a stop loss placed just below 0.28 to avoid any immediate reversal. This also goes with the uptrend on the weekly timeframe.
3. Exit Criteria:
Profit Target 1 would be a possible exit around 0.35 USDT. Here is one of the strongest resistance areas, according to both weekly and daily charts, since the price historically has either been rejected at this area or consolidated.
Profit Target 2: Target 0.40 USDT after the market, if moving bullish, crosses 0.35 USDT.
- Trailing Stop: When the price hits 0.35 USDT, set up a trailing stop to secure your gains while still giving room for more upside. If price goes back, your trailing stop will help you take advantage of the upward momentum when the price keeps going higher.
- Scale out on Reversal Indications: If Stochastic RSI on the 4-hour chart or daily chart indicates overbought situations (above 80), one should scale out of a position or tighten the stop loss to lock in profit. If the price action is consistently establishing lower lows and lower highs, it is time to exit the trade.
4. Risk Management Criteria:
- Stop Loss: Always place a stop loss at around 2-4% below the entry point. For example, if entering at 0.30 USDT, set a stop loss around 0.29 USDT. This protects against adverse market movements.
- Position Sizing: Risk no more than 1-2% of your trading capital on a single trade. If the stop loss is triggered, the loss should be within your risk tolerance.
- Risk/Reward Ratio: Aim for a 2:1 risk/reward ratio. For example, if you risk 0.02 USDT (using the 0.28 stop), your reward target should be 0.04 USDT at a minimum (targeting 0.35-0.40 USDT).
5. Additional Considerations:
- Monitor Market Sentiment: Throughout December, keep an eye on general market sentiment and news around STEEM, Binance, and the broader cryptocurrency market. Positive news might strengthen your position, while negative news could cause significant volatility and influence your exit strategy.
- Use the Weekly Chart as a Backdrop: The weekly chart will dictate the long-term direction, ensuring you are in line with the overall trend. On the weekly timeframe, focus on the long-term target, while using the daily and 4-hour charts to fine-tune entries and exits.
Summary:
- Entry: Use breakout patterns and stochastic crossovers on the 4-hour chart. Enter above 0.30 USDT.
- Exit: Target 0.35 to 0.40 USDT, with trailing stops for further gains.
- Risk Management: Have stop losses 2-4% below entry, with a target of a 2:1 risk/reward ratio.
You will thus be able to construct an accurate and enlightened strategy for STEEM/USDT during the month of December, which will ride the trend and make profits at resistance levels with minimal risk and adjustment according to the phases of the market cycle.
Question 5: Mitigating Risks in a Volatile Market |
|---|
Mitigating Risks in a Volatile Market: Multi-Timeframe and Market Cycle Phases
Trading in volatile markets presents unique challenges, especially when combining multi-timeframe analysis with market cycle phases. The key to success is effectively managing risks and avoiding false signals that can lead to poor trades. Here’s how to approach it:
1. Understand Market Cycle Phases
The market moves through four primary phases: accumulation, uptrend, distribution, and downtrend. Knowing which phase the market is in helps set the stage for effective decision-making. For example, in an accumulation phase, the price may be moving sideways, and therefore prone to false breakouts. In contrast, uptrends typically have clearer buy signals, while downtrends favor shorting opportunities.
When using multi-timeframe analysis, it is important to refer to higher timeframes such as weekly and daily to understand the bigger market cycle. Once identified, use short timeframes such as 4-hour and 1-hour to time entries and exits more precisely within that cycle.
2. Avoiding False Signals
False signals often occur at a consolidating phase or in a strong rally, when it appears that the market is going to reverse. Here are a few tips to avoid them:
Confirmations Across Timeframes: a signal on a lower time frame, for example, the 4-hour time frame needs to be confirmed by the broader trend on a higher time frame, for example, on the daily or weekly charts. If the daily is in an uptrend and there is a potential pullback on the 4-hour chart, it presents a buying opportunity rather than a reversal.
Volume Confirmation: Breakouts or breakdowns without the significant volume often lead to false signals. Volume should complement price movements, especially on the lower timeframes. Ensure breakouts or reversals in the lower timeframes are accompanied by increases in volume for further confirmation.
Use of Indicators: Apply indicators such as RSI, MACD, or Stochastic Oscillator to confirm. If the price breaks above a moving average but the indicators are indicating a divergence or overbought/oversold, it's likely a false breakout.
3. Risk Management
Volatility requires extreme risk management techniques:
Position Sizing: Place only a small amount (1-2%) of your capital on a given trade. This prevents losses from significant, unexpected moves.
Stop-Loss Orders: Always apply stop-loss orders according to the market cycle. In an uptrend, position your stop loss below key support levels, while in a downtrend, position it above resistance levels.
Take Profit Strategically: Use multiple profit targets to lock in profits as the price moves in your favor. This reduces risk because you can get out partially if the market turns unexpectedly.
It thus becomes critical to understand the market cycle, confirm signals over a period of time frames, and apply robust risk management. With these steps, one would mitigate all the chances of getting into false signals and therefore, protect the capital.
kind Regards
@artist1111

Adieu, folks!
May the winds of fortune
carry you to greatness!
May the winds of fortune
carry you to greatness!
Hello friend greetings to you, hope you are doing well and good.
Your post is amazing as usual. Market moves in four phases and you have defined it very beautifully. STEEM's chart are extraordinary dear. I do focus on trend line and support and resistance levels if trading in the market.
I wish you best of luck in the contest dear friend. Keep blessing.
Downvoting a post can decrease pending rewards and make it less visible. Common reasons:
Submit
Hello dear friend, thank you for your kind words and support! I'm glad you enjoyed the post. Wishing you the best too!
Downvoting a post can decrease pending rewards and make it less visible. Common reasons:
Submit