Hello, everyone; I hope you all are doing well. I am here to share my participation in the Steemit Engagement Challenge season 20, week 4. This is gonna be a difficult but interesting topic to participate in. I hope I will fulfil all the questions demands according to the professors.
First I want to clear the concept of algorithmic trading this is also called as Black box trading and in this trading we use the computer programs to interpret trading which is implemented on already free define rules and regulation.
So basically these rule or algorithms are used for the technical analysis of market data and we can enhance our decision making capacity and then precisely accurately we can do trading.
Importance in market
Efficiency ability has been increased to avoid human error because this is an automatic trading.
Secondly within seconds algorithms can be made and speed is very much improved again due to its automatic programming. The most important thing is large amount of data is analyse within second in this way scalability is improved so much.
And for example if we have to hire so many people for trading so we have to give salary to each person but in this automatic trading there is less cost we use less manual labour cost. And this is dominating market competition trading.
Moving Average Crossover
We use two types of moving averages
SMA which is 50 period from its name it is predicted this is used for analysis of short term price movements.
Long-term moving averages this for 200 periods and this is a very important indicator for the long term price movements in the market.
Trading logic
Buy signal
So when SMA is crossing above the level of the long term moving average this is a signal for a buy signal
Sell signal
It is easy to understand when SMA is crossing below the levels of the long-term moving average, this is the indication of a cell signal. As I always mentioned, there are risks associated as well. For example, the market is always volatile, and there is the risk of flash.
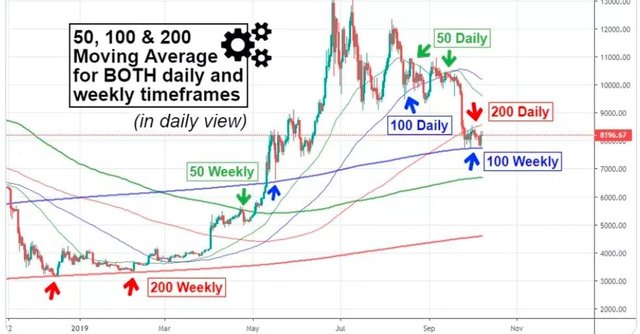
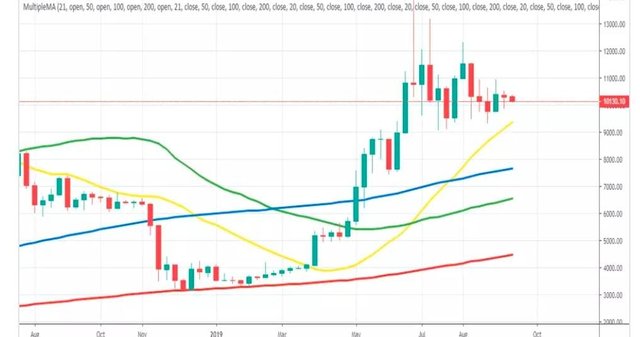
As I mentioned, it is automatic, so there are maybe chances of connectivity problems, or sometimes there may be technical issues. In this graph, the Ema weighty prices, which you can say is around 9.4k, are holding as support, which means BTC will increase.
So, I am using the moving average indicator analyser for 100, 50 and 200 days, and I am showing this on the same chart. What we can see from this chart is support and resistance lines that may be overlooked.
First, I will describe the term moving average. This is a technical analyser that gives us the average price of any asset during a specific period or set period. This is most commonly used because of its simplicity and loyalty.
For calculating the moving average, you need to know specific information about previous data. For example, let me give you an easy example: you want a 10-day moving average, and you need data for 10 days in the same way a 200-day moving average needs 200 days of data.
This provides the direction for any asset price and will let us know the indication for a trend change. There are many types of moving average
SMA
Simple moving average This is a very simple calculation of the average price of an asset in a given period. For example, to calculate the SMA for 40 days, you need to take the close prices of the last 40-day candle on a given one-day chart, and then divide by 40.
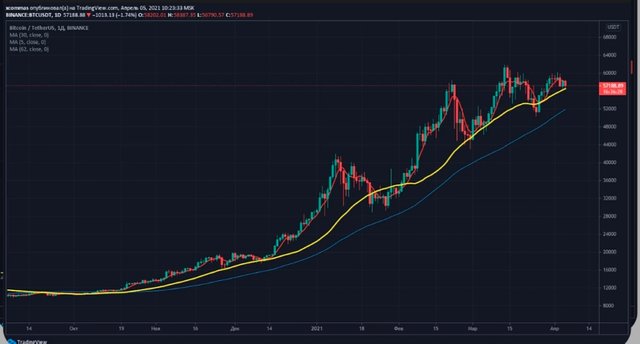
Now I am giving you an example of the chart of one day you will long the period of SMA, it is going to lag behind the price. For example 62 SMA from the recent price than the 30,5 SMAs. As I already mentioned, 62 SMA will add a closing price of the last 62 period, and then, we divide it by 62.
In the chart, we can see the upward trend, and this gives us a broader view and helps to get the price movement in the general direction.
Benefits and drawbacks
If I talk about the benefits and dropback of SMA this is very simple to use and it is very less responsive to price fluctuations
And drawback it is very very slow to be reactive to market price fluctuations another important thing to discuss his it is lagging behind the price movements
EMA
Exponential Moving Average
SME is easy because this gives us the Average of all prices in a specific period where, whereas EMA provides more weightage to recent period prices.
EMA = Closing × multiplier + Last day × (1-multiplier)
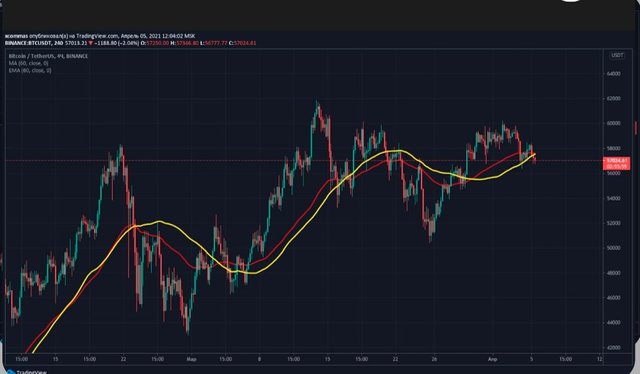
Let me elaborate more clearly: this is the charge of 4-hour Bitcoin and SMA 60 EMA 60.
Just look at the red line at EMA 60, which is very close to the price rather than the yellow line, so let's say if the trend changes, the EMA will change direction more quickly than the sma.
This is due to the reason I already mentioned EMA is gaining more weightage in the recent price, and it also protects you from the fake false signals which are used by the simple moving average.
Benefits and Drawbacks
This is very faster to respond to any market changes and this is more than Sensitive and more reactive to recent price changes
The drawback is I think sometimes we may attract false signals if we are using this for trading, and it requires strong parameters for reaction.
WMA
The last time is the weighted moving average. This is one line even faster than the EMA, and it provides us with higher priority indications than EMA, and it is the prediction of linear weighted prices to make sure of the most recent price.
Benefits and Drawbacks
This is a collaboration of benefits of both categories and this is also more reactive to recent price changes. It is very complicated, and its calculations are very difficult to calculate, and still,l, it is lagging behind the price changes.
What I am using
I am using the for-algo trading strategy the EMA. Because it is faster and this is, I think, faster to react to changes. Another thing is that it is very sensitive to the market's recent prices, and another thing is that there is a wide range of technical analysis to do trading.
SMA and EMA
So from my point of view, the EMA is always the best choice rather than the two others because it protects from fake signals, it protects us from the local trends which are going on, and there is a chance of getting significant profit when you are doing trading.
SMA is very simple but you may miss a lot of chances of getting profit. In this graph, we can see Ema's weighty prices, which you can say is around 9.,4whichit is holding as support, which means BTC will increase.
So another important question is the moving average crossover strategy for steem. So basically, we use this strategy. We are using two types of moving averages to predict the buy and sell signals. So we mainly see the crossing over the SMA (20 period) at Long-term MA (50 period). This is an indication that we are going to begin buying signals. And if the signal is vice versa.
Buy signal
As I already mentioned in my last question if the crossing over of SMA (20-period) is above the level of Long term MA (50-period). So we will see the price of the steem which is 200 period moving average.
Sell signal
If SMA (20-period) is going to cross over Above the level of long term-MA (50-period).
So we will see the price of Steem is going to be below the level of the 200-period moving average.
Risk solution rules
Stop loss
Stop loss should be 5 per cent under the entry price level. And profit can be up or below 10 per cent.
Backtesting
For an hour time frame, I select the data duration from 6 months to one year on finance by selecting steem/USDT.
So firstly, for this process, we need to calculate and collect all the previous historical background data, and then we need to do the application of MA after that, the technical analysis of signals. Then, we need to see the MA period selection of stop loss and profit.
For algorithmic strategies I would like to use there are so many but what I prefer is going to tell you.
Python
So there are so many good features of it for example pandas and scikit learns and due to its simple use I always prefer Python.
Trading view
This is another one of my favorites for getting graphical and technical analysis I always use this most of the time.
Meta trader
One of the best platforms for automatic trading.
Python is very simple to use and this is having the feature of versatility means it has the power of automation so that it can save your time whether you belong to any category for example technical data analysis something you are doing it provides you with a wide range of processing.
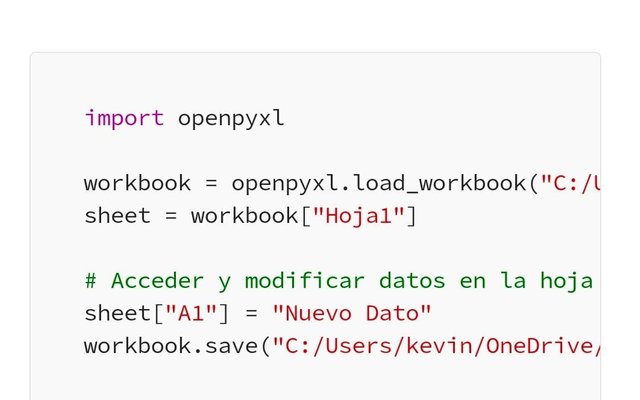
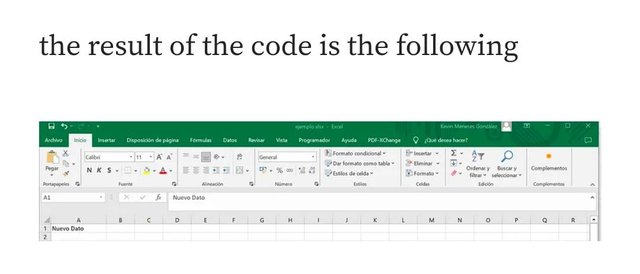
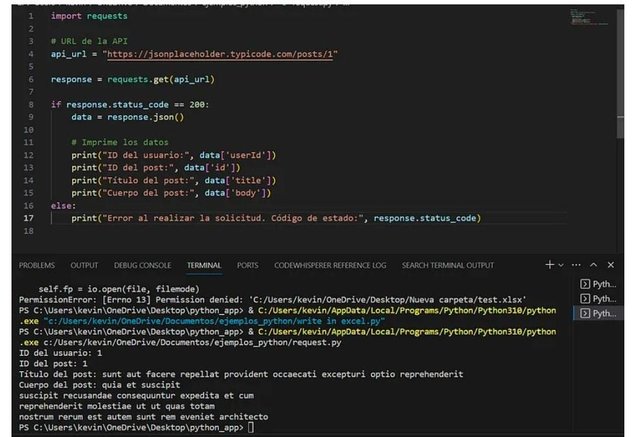
If your using the excel file and you want the automation for reading/writing data just use this.
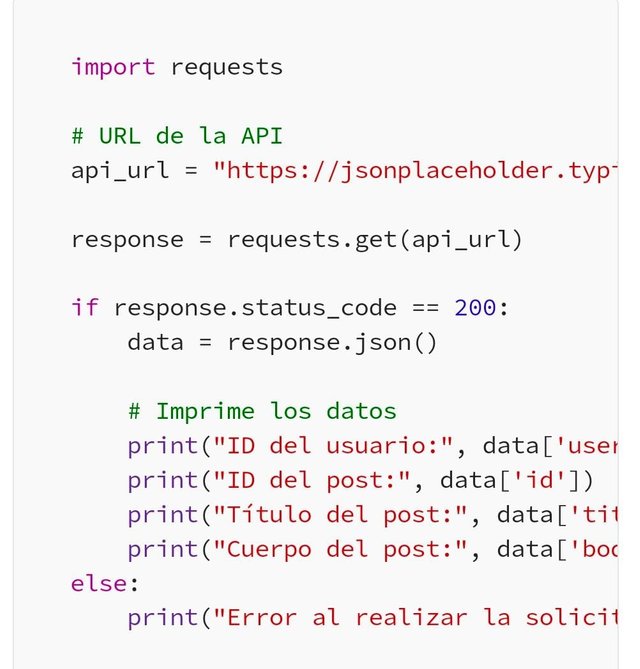
This is basically a request to recall any Url link you want to process it automatically or want to get online sources. To import requests this is code used.
In order to evaluate the performance of algorithmic strategy by use of Steem data. I am going to use the historical steem data from binance for the time frame one hour 2020-2022.
Backtesting
| Metric | Value |
|---|---|
| Sum up trading | 247 |
| Winners of Trading | 138 (53.5%) |
| Lose of trade | 111 (41.5%) |
| Profit/Loss ratio is in | 1.18 |
| Drawdown | 10.5% |
| Sharpe Ratio | 0.78 |
Market sceneries
| Market value | Profit and Loss Ratio | Winners Trading (%) |
|---|---|---|
| Bullish | 1.48 | 59.5% |
| Bearish | 0.78 | 43.5% |
| Sideways | 1.12 | 47.0% |
Calculation
Now I will tell you somehow about that technical analysis actually during the bullish market if I tell you about the ratio it was 1.48.
And the ratio of profit and loss during bearish was 0.78 and same for the sideways it was 1.12. The maximum drawdown was 11 percent sum up.
Improved solutions
We can do more stop-loss settings while the bearish trending markets. We should have keen eyes on the market volatility.
We should do analysis for many multiple time frames to prevent loss by rely on false signals. Should not use single signal should be used in addition of others for example Bollinger bands ,MACD.
This was all about my participation. I hope you all like it & share your valuable feedback. I would like to invite my friends @m-fdo, @goodybest and @pea07 to share their participations. Thank you.
Upvoted! Thank you for supporting witness @jswit.
Downvoting a post can decrease pending rewards and make it less visible. Common reasons:
Submit
Upvoted. Thank You for sending some of your rewards to @null. It will make Steem stronger.
Downvoting a post can decrease pending rewards and make it less visible. Common reasons:
Submit
Downvoting a post can decrease pending rewards and make it less visible. Common reasons:
Submit
Thank you.
Downvoting a post can decrease pending rewards and make it less visible. Common reasons:
Submit
Hi @ashkhan you have presented a good post related to algorithmic trading.
Algorithmic trading helps us to automate the trades in an effective way with Hugh precision. It automatically detected the buy and sell signals and proceed the trades in that direction.
Downvoting a post can decrease pending rewards and make it less visible. Common reasons:
Submit