This is the sixth week
of the Crypto Academy season 3 and I am thrilled to take part in this week's task by @asaj This is where the fun is and with this lesson, we are learning more about vortex indicators strategy. Let's get into it.

In your own words explain the vortex indicator and how it is calculated
Explain the Vortex Indicator
The function of this indicator is to present a technical analysis of the market which consists of a specific time. Its job is to predict the market price and it is very useful for traders.
Basically, this indicator consists of two lanes
- VI +, which represents a positive trend in the market
- VI -, which represents a negative trend in the market
Calculation of Vortex Indicator
Actual Range calculation: This can be calculated by subtracting the current lowest price from the current highest price and then subtracting the current close price from the current highest price. And similarly, in the end, the previous closure is subtracted from the current low value to estimate the actual True Range. For example
Actual value = Current High – Current Low
Actual value = Current High – Previous Low
Actual value = Current Low – Previous Low
Calculate the upward and downward trend:As we know, the distance between the previous low price and the current high price is considered an upward trend, and similarly, the distance between the current low price and the previous high price is considered a downward trend. For example
Upward movement = absolute value of current high – previous low
Downward movement = absolute value of current low – previous high
Decide on a parameter length: These indicators are usually measured by the length of 14 for example 14 minutes, 14 days, and 14 weeks. For example, if I add up the actual limit prices for the last 14 days, I get the length of the actual limit parameters for the last 14 days. For example
Sum of the last 14 periods True Range = SUM TR14
Sum of the last 14 periods VM+ = SUM VM14+
Sum of the last 14 periods VM- = SUM VM14−

Is the vortex indicator reliable? Explain
As we have seen many indicators in the crypto market, each indicator has its own characteristics. Each indicator predicts traders by reviewing the previous movement record of the market. Sometimes the gesture is wrong.
That is why traders should use two indicators at a time to know the market situation. If one hint provides incorrect information, the other can avoid this misinformation. This process can save a lot of money for traders.
If we talk about whirlwinds, I think they are very reliable. This can be very useful for traders if they know how to use it properly.
I have already said that we would like to use two indicators at a time which will give us an idea of the right direction of the market and similarly we should use the MACD indicator with Vortex which gives us ample market. Provides accurate analysis. Will be able to
Let me now tell you the market trend of MACD indicator and vortex charting together. And I see that they are useful at the same time. It is not and they will know which index provides the correct information.
.png)
(Ada/Tether 4H Chart)
This Chart shows that MACD gave a clear buy signal on April 5, and Vortex gave a buy signal a day later on April 6. This clearly shows that the MACD is faster than the vortex. works
.png)
If we look at this chart, the MACD signals us to sell on June 4, and the vortex signals to sell to us a few moments later. From this, we can conclude that we need to know the true meaning of market trends. So we want to use two indicators at a time so that we can trade in the best way.

How is the vortex indicator added to a chart and what are the recommended parameters? (Screenshot required)
First of all, go trading view, there I opened my account and I select to pair with Ada/ Usdt
.png)
- I clicked on ''Fx''.
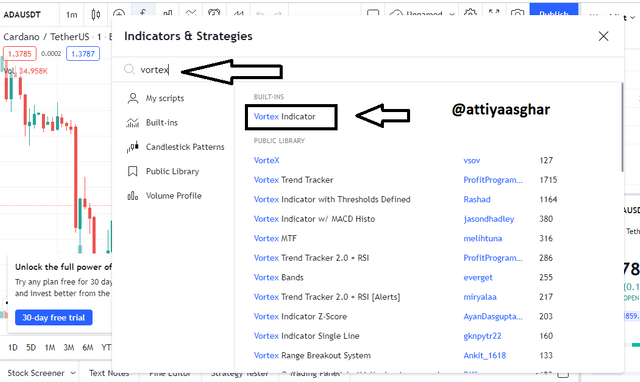
- Then I typed "vortex" and the "vortex indicator" appeared in the search bar and then I selected it.
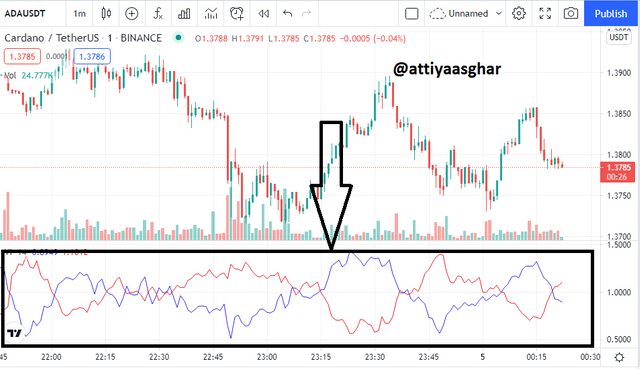
- As you can see, the vortex indicator appears on the chart.
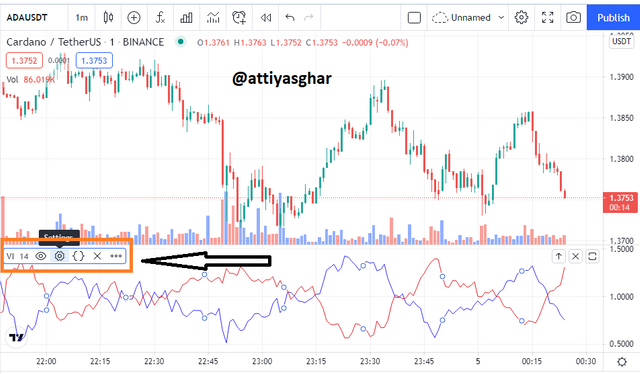
- To the left side of the indicator you will see a setting button, when you are press that new pop will appear
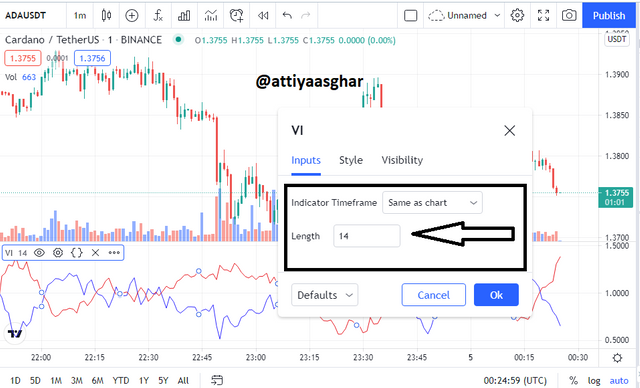
- When you open it, you will see three sections, Input, style, and visibility.
- First I will open the input and set the pointer length to 14 periods. Because by default it consists of 14 periods, I will leave it as is.
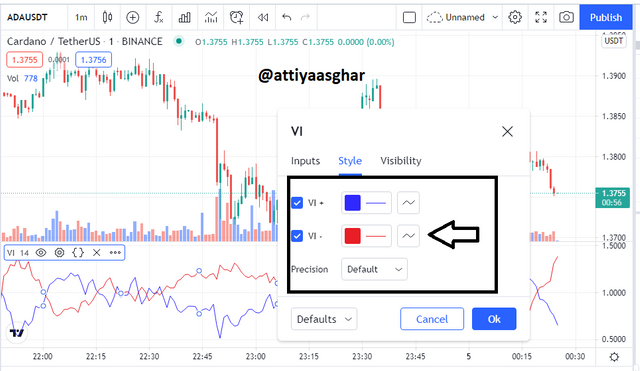
- I open second section "style" here you can see +VI is by default color is blue and -VI color is red, and also I will leave so it is
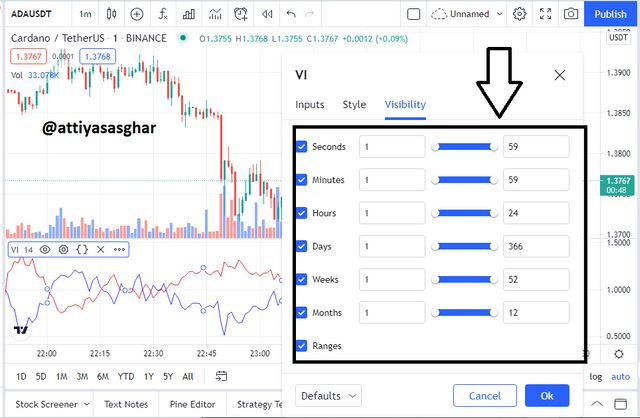
- That is the third and last ''visibility" here you can see many options if you want to change then you will change it but in my case, I also leave as it is
what are the recommended parameters?
These indicators are usually measured by the length of 14 for example 14 minutes, 14 days, and 14 weeks or 14 months. you can change parameters according to your trading style but I think we should follow the parameter that Jay Weld Wilder made because we have the potential to get better results in this parameter.

Explain in your own words the concept of vortex indicator divergence with examples. (Screenshot required)
Bearish divergence
.png)
If you look closely at the chart, the value of the bitcoin is constantly rising, but if we look at the VI + line, it is going down. There is a clear deviation here, so we need to avoid such deviations. We want to use two indicators at a time.
Bulish divergence
.png)
As you can see the price of bitcoin is going down and the VI + line is going up. From this, we can infer that there is a deviation here too so we have to be very careful in using these indicators.

Use the signals of VI to buy and sell any two cryptocurrencies. (Screenshot required)
Bitcoin Buy signal
.png)
(Btc/Usdt)
.png)
I am using a 1-minute chart you can see in the chart when the VI + line crossed -VI then I bought a 1 bitcoin for $ 40637 and I have lost $476 and I hope after some moment it will be converted into profit
Sell Bitcoin
.png)
.png)
As you can see, I bought a 1 bitcoin at $40637 a day ago, that time I just waiting, when vortex gives me a selling indicate signal then I will be sold it. you can see in the chart almost after 2.30 hrs vortex giving me a clear selling signal. that time I sold the 1 bitcoin I got a $368 profit.
it's a good trade for me and I get a good profit, again I want to inform you when you will be open trade at the same time you can watch a market movement from minimum two indicators it's giving you prefect result.
Vet Buy signal
.png)
(Vet/Usdt)
As you can see in the chart I have opened the five-minute graph and you can see very clearly in it that the blue line is crossing the red line which gives us a clear indication that it is time to buy.
.png)
And so when I got the purchase signal that time Vet price was $0.09048 then I purchased $1809 and I got 20000 coin
Sell Vet
.png)
(Vet/Usdt)
.png)
I bought 20000 Vet for $1809 and I sold on $18027 it is clear I got a profit of $ 18.61. if we read more about vortex indicators, then we will be able to make more profit, I already tell we must need to use two indicators at the same time, which is very important

Conclusion
This was a very useful lecture which helped us to know another clue. There are many indicators in the world of cryptocurrency but the vertical has a special identity.
Superb performance @attiyaasghar!
Thanks for performing the above task in the sixth week of Steemit Crypto Academy Season 3. The time and effort put into this work is appreciated. Hence, you have scored 8 out of 10. Here are the details:
Remarks
You displayed a good understanding of the topic.
Downvoting a post can decrease pending rewards and make it less visible. Common reasons:
Submit