Welcome once again to another wonderful episode in the crypto Academy community. Before I present my homework post, I would like to acknowledge the professors and the crypto Academy community for making such an educative lecture possible. Today the topic is all about trading.

Solana Trading
The Solana blockchain is the new blockchain network built by Anatoly Yakovenko in 2017. This innovation was built to solve blockchain problems. The project of Solana was to solve the scalability problems and improve transactions speed on the blockchain network.
Just like all other blockchain technologies, the Solana uses a consensus algorithm to function. However, the Solana combines both the Proof of stake and proof of history consensus algorithm. The Solana block uses about 200 nodes to complete over 50000 to 60000 transactions per second which makes it the fastest blockchain network currently. Solana has indeed solved the scalability problems of the bitcoin and Ethereum network.
Solana uses the proof of history consensus algorithm as the primary innovation. This consensus algorithm solves the scalability, transactions speed, security, and gas fees problems of other blockchain technology.
With the proof of history, Solana can complete over 50000 transactions within a second just with 200 nodes. Faster than both the bitcoin and Ethereum blockchain.
Moreover, Solana uses a cryptographic hash function alongside the proof of history algorithm to secure transactions on the network. These hash functions are in a form of super lengthy alphanumeric characters which focus on the security of transactions.
The Solana blockchain technology uses the proof of history algorithm to store all the historical records of all the previous transactions by lightening the load of the nodes to improve scalability.
current price data of Solana
.png)

Technical Analysis of solana
Good traders always start analyzing the longer timeframe. No traders would like to trade against a trend. A good trader taking buy signals in a bearish market could cause more harm than good. Hence, it is very advisable to start the analysis in a longer timeframe.
Analysis from the 1-day timeframe
Screenshot from Tradingview.com
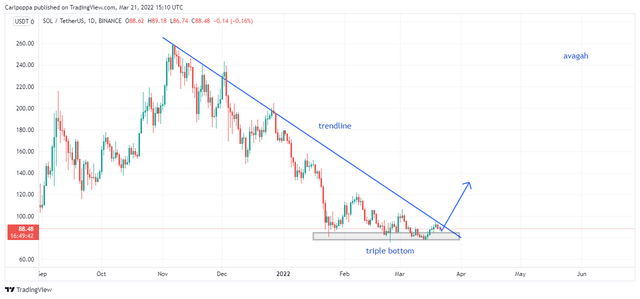
From the chart above, we realize the long trend was bearish the price was forming a series of lower lows and lower highs. However, the price has currently met a strong support level which is failing to break below the support.
The price has formed triple bottom which confirms a bullish trend reversal. Usually, double bottoms are enough for trend reversals however, when triple bottoms are located, it gives a very strong confirmation to the signal.
However, the price is still expected to break above the trendline for better confirmation.

Analysis from the 4-hour timeframe
Screenshot from Tradingview.com
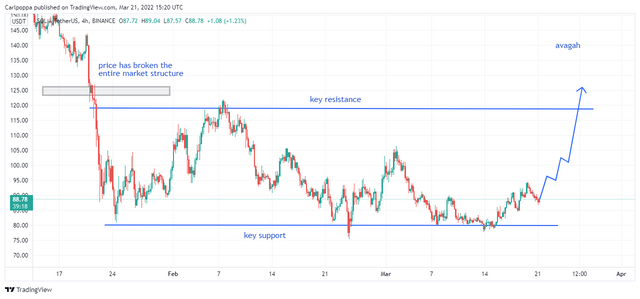
The four-hour timeframe shows that the price of the Solana is consolidating within the support and resistance level at the moment.
With support and resistance levels, we are all aware of the psychology behind it. The market is assumed to have balanced liquidity. When the price is near the resistance level, everyone would anticipate a sell likewise when the price is at the support level, traders would buy the asset.
Looking at the chart above, the price is currently at the support level which suggests a buy to the resistance level. In this case, we assume the market is currently bullish.
Just like I’ve indicated on the chart above, the price is expected to break above the resistance level.

Analysis from the 1-hour timeframe
Screenshot from Tradingview.com
Here, we would analyze the smaller timeframe to take our trade entries.
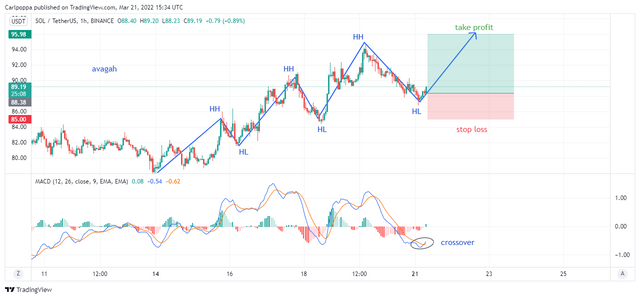
Just like the previous longer timeframe has shown a clear bullish trend, the smaller timeframe is equally confirming the trend.
As we can see from the chart above, the price is forming a series of higher highs and higher lows. This explains that the price is forming a bullish market structure.
To identify a perfect signal, wait for the market to break the previous high and allow the price to retest back forming a higher low before we enter the market.
The MACD indicator is also giving confirmations to the buy signal. The blue oscillating line crosses above the red oscillating line which means a buy signal.
I entered the market after identifying a clear bullish candlestick.
Set a stop loss and a corresponding take profit ratio.
it’s always advisable to use good risk management.

Real Transaction from my Exness broker account
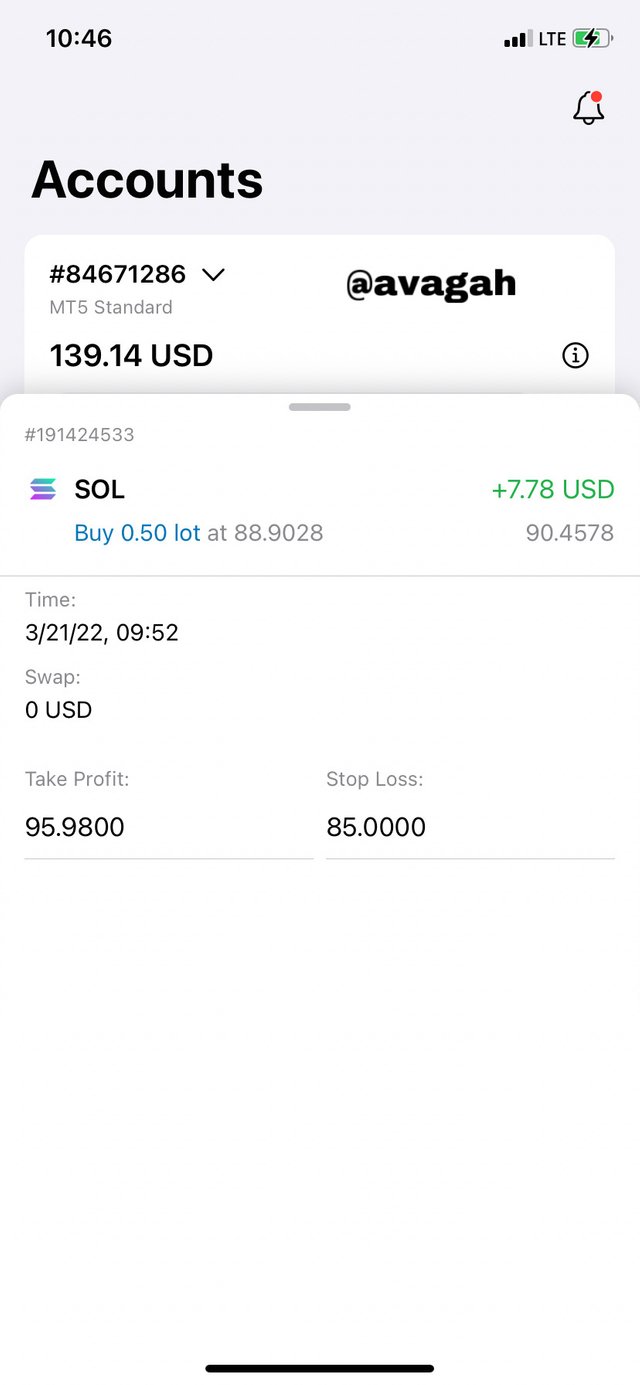
- I closed the trade after making some profits.
- Sometimes it’s not necessary to wait to take profits. For good risk management, it’s very advisable to take partial profits before final T.P.
I would recommend other traders to buy the asset because it has a very long way to go.

CONCLUSION
Trading is now the order of the day. Traders in the crypto ecosystem use numerous strategies to executed trades. However, I recommend everyone to master some 2 or three strategies which could be very profitable. Using different strategies every time would cause more harm than good.
Don't forget to use good risk management in trading. Always make sure your risk-reward ratio favors the profit. Do not risk money you are not willing to lose. Better still you can still use the 1% rule to reduce your risk.