
Welcome once again to another wonderful episode in the crypto Academy community. Before I present my homework post, I would like to acknowledge the professors and the crypto Academy community for making such an educative lecture possible. Today the topic is very technical Technical Analysis Using Fractals.
Without wasting enough time I would present my homework post systematically based on the questions from professor @reddileep

1- Define Fractals in your own words.

Trading is now the order of the day. Most people usually strategize different techniques to better their trading skills. Day in and day out, traders are learning more different strategies. Today we would discuss something very basic but not common to just any trader.
Fractals are repetitive price patterns that happen on the crypto chart. This is quite interesting how traders are advancing their knowledge with crypto price patterns. usually on the crypto charts, if not the same, very similar patterns occur. Traders in their knowledge have spotted the initial behavior of the price pattern which is about to repeat itself and trade with the idea that the previous pattern is certainly going to repeat. This is very interesting.
Fractals are very common on shorter timeframes. They occur as a result of some particular traders with a specific amount of volume. Let us assume Reddileep hold 8% of ETH, Avagah holds 3% of ETH and steemcurator02 holds 15% of ETH, when these three people sell all their assets one after the other, the structure of the price pattern would look similar when they sell the same asset at a different time. That's how the fractals work. Similar trades happening to cause similar price movements.

2- Explain major rules for identifying fractals. (Screenshots required)

Identifying fractals on the crypto chart requires some specific rules.
Rule 1
A valid Fractal should have not less than five (5) candlesticks. If the candlesticks are less than 5, the fractal is considered to be weak or an invalid fractal. Although some 3 or four candlesticks pattern can be very convincing to be a fractal, it is not advisable to trade when the fifth or confirmation candlestick do not form.
Rule 2
Since Either bullish or bearish fractals can be formed, we should always expect either one of the trends to occur. In that case, we would expect either the bullish fractal or the bearish fractal to occur when a clear fractal is identified in the market.
Rule 3
In case of a bullish fractal, we allow the third candlestick in the middle of the candlesticks to form the lowest low while the four other candlesticks at the sides of the third candlestick form higher lows. That's the third candlestick should strictly be lower than the other candlesticks.
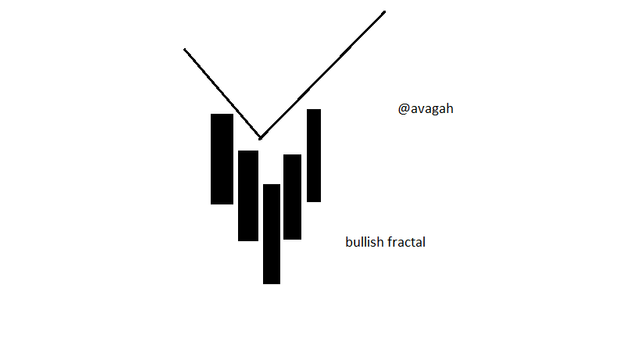
Rule 4
In the case of a bearish fractal, we allow the third candlestick in the middle of the candlesticks to form the highest high while the four other candlesticks at the sides of the third candlestick form lower highs. That's the third candlestick should strictly be higher than the other candlesticks.
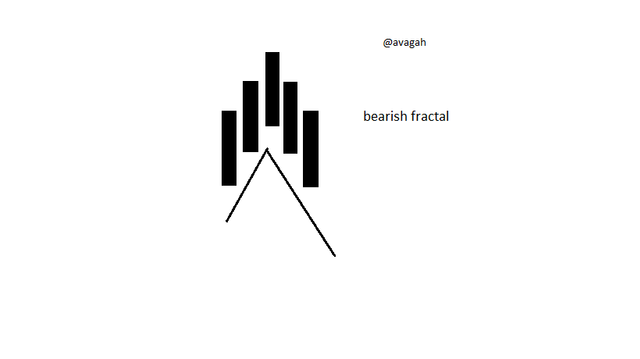

3- What are the different Indicators that we can use for identifying Fractals easily? (Screenshots required)

Fractals are very difficult to identify. Unlike other strategies like the market structure and trendlines which can be identified easily on the chart. However, there are numerous technical indicators developed by some technical analysts to aid traders who want to identify fractals for trading.
we would explore tradingview to see some of these technical indicators available to identify these fractals.
.png)
From the chart above, we can see clearly that, there are numerous indicators associated with fractals. We would explore some of these indicators to know more about how some of their works.
William Fractal Indicator
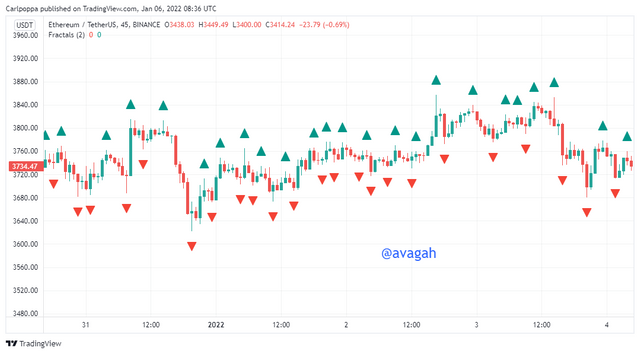
The William fractal is one of the most commonly used indicators which seem to identify fractals very frequently in the market. As we can all see clearly from the chart above, the indicator has identified numerous fractals in the market. The red and green triangular-shaped arrows from the chart signify buying and selling signals from the market. However, considering just these signals for trading would mislead us in the wrong direction.
Remember the indicator only identify fractals, that's previous price patterns that don't guarantee a perfect entry and exit point.
However, it is advisable to use this indicator alongside other technical strategies or other technical indicators for better trading results.
Fractal Support and Resistance
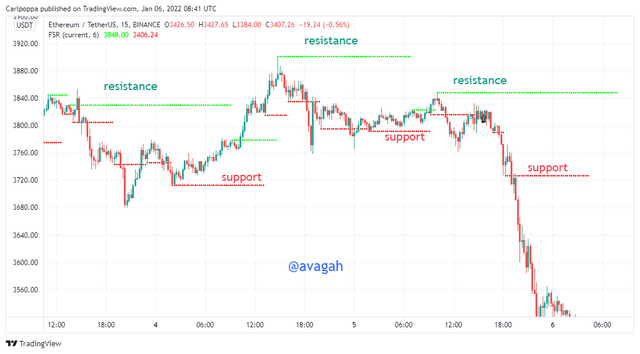
The fractal support and resistance is of the best fractal indicators. This indicator automatically identifies support and resistance levels in the market using the price patterns of the previous chart. As we are all aware, support and resistance levels in the market are strong levels where no one would like to trade against. This indicator uses green and red horizontal dots to represent the resistance and support levels respectively. When prices hit these levels, they seem to reverse back.
With the fractal support and resistance indicator, traders simply spot key points where the price reacts very strongly before they enter into trade. These points are strong liquidity levels where more orders are accumulated.
There are numerous fractal indicators that can be explored when using tradingview.

4- Graphically explore Fractals through charts. (Screenshots required)

Here, we are going to identify fractals on the crypto charts. Different forms of fractals can be identified on the crypto charts. The basic rule of identifying fractals is the five candlestick strategy. However, fractals go way beyond the five candlesticks strategy.
Here, we would identify both bullish and bearish fractals on the crypto charts.
Bullish Fractals
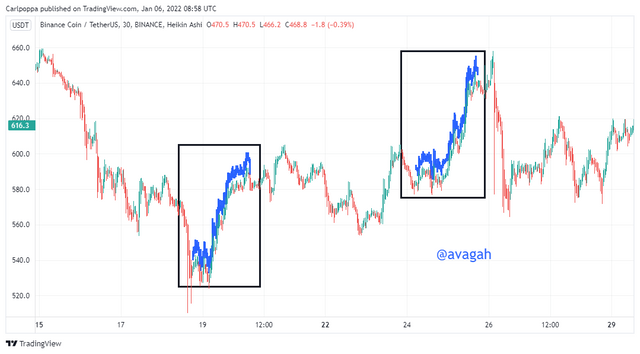
As we said earlier, for a bullish fractal, we allow the third candlestick in the middle of the candlesticks to form the lowest low while the four other candlesticks at the sides of the third candlestick form higher lows. That's the third candlestick should strictly be lower than the other candlesticks.
As said earlier, fractal patterns go beyond the five candlestick patterns.
I would show clearly how to use Tradingview to identify bullish fractals.
here, we would use the bars patterns to show how the fractals were formed.
.png)
- After selecting the bars pattern, we identify a clear fractal to confirm with the bar patterns
Bearish Fractals
Contrary to the bullish fractal, In the case of a bearish fractal, we allow the third candlestick in the middle of the candlesticks to form the highest high while the four other candlesticks at the sides of the third candlestick form lower highs. That's the third candlestick should strictly be higher than the other candlesticks.
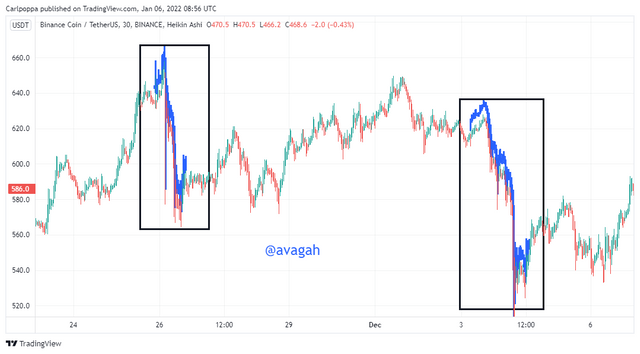
From the Charts in Figures x and y, we can see that the chart patterns in both cases are very identical. Identifying such patterns would be very relevant for trading. Fractals can be very advantageous if identified perfectly.

5- Do a better Technical Analysis identifying Fractals and make a real purchase of a coin at a suitable entry point. Then sell that purchased coin before the next resistance line. Here you can use any other suitable indicator to find the correct entry point in addition to the fractal.

Here, am going to make a technical analysis with a powerful strategy alongside the Williams fractal indicator.
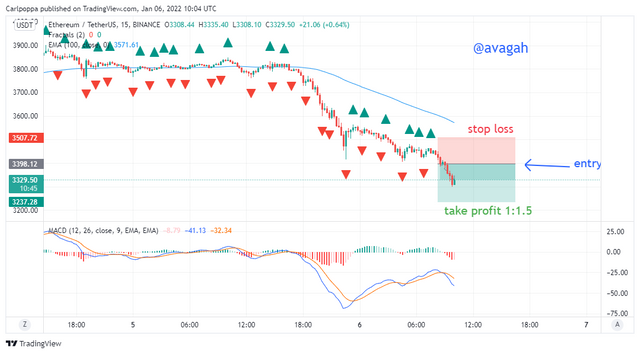
From the chart above, I used 3 different indicators to make the technical analysis.
First and foremost, I used the 100 lengths moving average. This is to identify the current state of the market. Usually, when the price is above the 100 or 200 moving average, it is not advisable to take a sell trade. On the other hand, when the price falls below the moving average, it is not also advisable to take a buy trade.
The reason is that, when the price cross above the 100 moving average, it is considered to be in an uptrend. And no one would like to trade against a trend.
After we saw the market is currently in a downtrend, we would be looking for a sell signal for a sell trade. Looking at the MACD indicator, when the blue oscillating cross below the red line, we know there's a sell signal for a sell trade. Moreover, we can also confirm with the sell signal from the William fractal indicator.
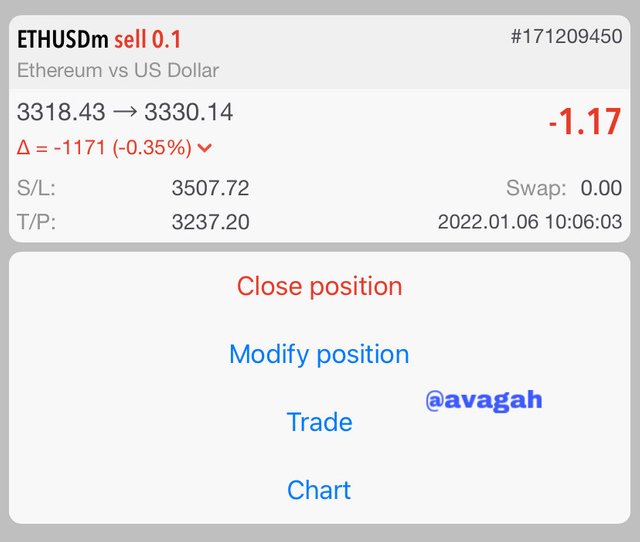
Afterward, we set a stop loss and a corresponding take profit ratio as well.

CONCLUSION
I would like to acknowledge @reddileep for such a wonderful lecture. Trading is very versatile and requires a lot of experience to be an expert.
I have learned a lot today. These fractals are very important patterns that usually occur on the chart very frequently but are not easy to identify if you do not know about them. I think identifying these patterns could be a very profitable tool for trading.
However, I think trading with only these patterns could cause great damage. This pattern could deceive a trader to enter into a wrong trade. So in my opinion, it would be very advisable to use this strategy alongside other strategies for better trade results.
@reddileep I think my post was skipped
Downvoting a post can decrease pending rewards and make it less visible. Common reasons:
Submit
Don't worry, I'm gonna grade it now.
Downvoting a post can decrease pending rewards and make it less visible. Common reasons:
Submit