
Welcome once again to another wonderful episode in the crypto Academy community. Before I present my homework post, I would like to acknowledge the professors and the crypto Academy community for making such an educative lecture possible. Today’s topic is simple Trading With BICHI Indicative Strategy | Introducing IDX
Without wasting enough time I would present my homework post systematically based on the questions from the professor @utsavsaxena11.

1. Give a detailed analysis of BICHI STRATEGY. Starting from introduction, identification of trends, trend reversal in market, entry, and exit from the market, one demo trade, and finally your opinion about this strategy. (Screenshot required). [4 points]

Every cryptocurrency trader is looking for the greatest setup, trading technique, and plan to earn from the market. Finding the right trading technique or indication to utilize in crypto trading can be difficult for some traders, however, the majority of professional traders employ a combination of fantastic indicators to achieve confluence and execute excellent crypto trade analysis. It's best to trade with confluence, thus combining many powerful indicators or two separate technical analyses, such as price action and market structure, is a smart approach to trade crypto.
To be successful in trading, a trader must have a sound strategy and be able to implement it. A good strategy has confluence. Trading with two excellent indicators will be extremely profitable.
The Bichi strategy is an excellent strategy with a good confluence of combining two indicators. The Bollinger bands and the Ichimoku cloud are two significant indicators that make up the Bichi strategy. Bollinger Ichimoku was the source of the name Bichi.
The Bollinger bands serve as support and resistance, while the Ichimoku cloud provides information about price movement. When these two factors are combined, an accuracy rate of roughly 80% is achieved.
Identifying trends using BICHI strategy
As a trader, you should be aware of price trends. In cryptocurrency trading, understanding the trend is crucial. It will assist you in understanding the market's main movement as well as certain minor movements.
The BICHI strategy can be used to spot trends.
Uptrend
In an uptrend, price must make higher highs and higher lows setup.
Spotting a trend using the BICHI strategy, we use the Bollinger bands indicator to identify the support of the asset. The price must break the Ichimoku cloud upwards and use the basis line of the Bollinger bands as support.
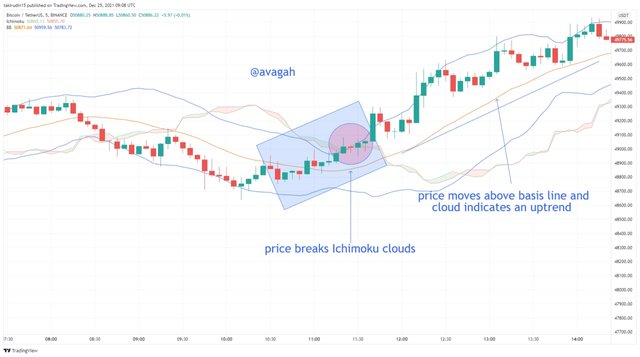
We can confirm it’s an uptrend after price broke the Ichimoku cloud upwards and used the basis line of the Bollinger bands as a support level.
Downtrend
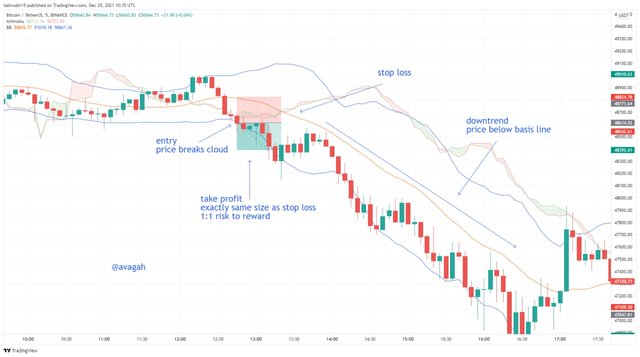
In a downtrend, the price must be giving a lower low and lower high formation. A downtrend can be identified with the BICHI strategy by waiting for it to break the Ichimoku cloud downward and trading below the basis line of the Bollinger band which will act as a resistance.
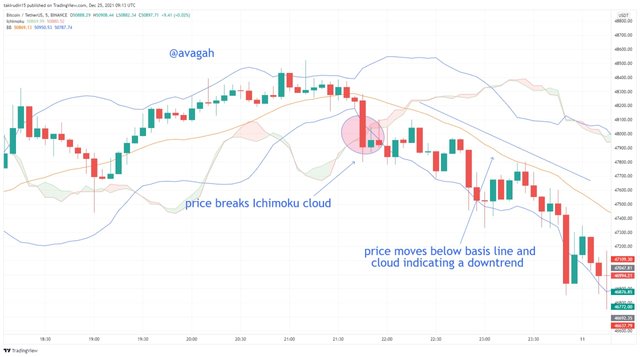
A downtrend happened after the price broke the Ichimoku clouds downward and was trading below the Bollinger band’s basis line.
identifying trend reversals
Trend reversals happen when the market structure is broken. In a case of an uptrend, the price breaks below the last higher low, and in a downtrend the price breaks above the last lower high.
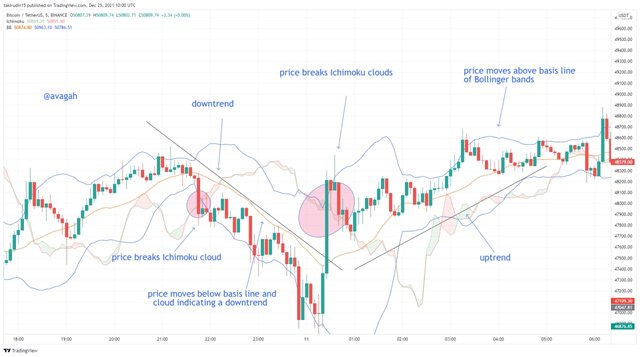
Bichi strategy can be used to identify trend reversals
The above picture shows how price initially broke the Ichimoku cloud and was moving below the cloud and the basic line of the Bollinger bands which indicates a downtrend. Later on, the bulls came in to move price to break the above the Ichimoku cloud and move above the basis line of the Bollinger bands. The change in trend from a bearish trend to a bullish trend is the trend reversal. BICHI strategy makes identifying trend reversals easy.
Buy Order
To make a buy trade, you always have to identify an uptrend where the price is trading above the basis line of the Bollinger band indicator which acts as a support.
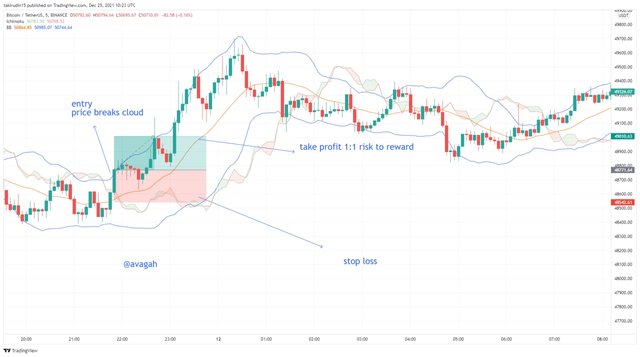
Now the price must break the Ichimoku cloud upward then we find our buy entry.
We make an entry on the candlestick after the breakout and put the stop loss at the Bollinger band which is acting as a support. Our take profit will be set according to our risk to reward which is proportional to our stop loss.
Sell order
To make a sell trade, you always have to identify a downtrend where price is trading below the basis line of the Bollinger band indicator which acts as a resistance.
Now the price must break the Ichimoku cloud downward then we find our sell entry.
We make an entry on the candlestick after the breakout and put the stop loss at the Bollinger band which is acting as a resistance. Our take profit will be set according to our risk to reward which is directly proportional to our stop loss.
Demo trade with BICHI strategy
In this section, I’ll discuss how to make a live trade using the Bichi strategy
The picture below it shows price breaks the Ichimoku cloud to the upside and also breaks the Bollinger band
Upward.
Once price breaks the basis line of the Bollinger band and the cloud, we now can take our trade.
A buy trade
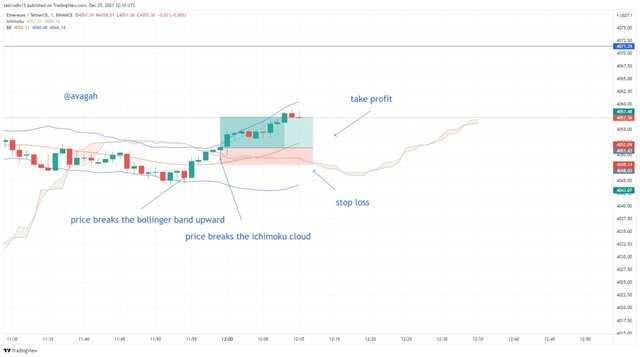
The picture above is the 1minute chart of Ethereum.
The stop loss was placed at the baseline of the Bollinger band and the take profit was twice the stop loss. The entry was on the candlestick that break through the Ichimoku cloud.
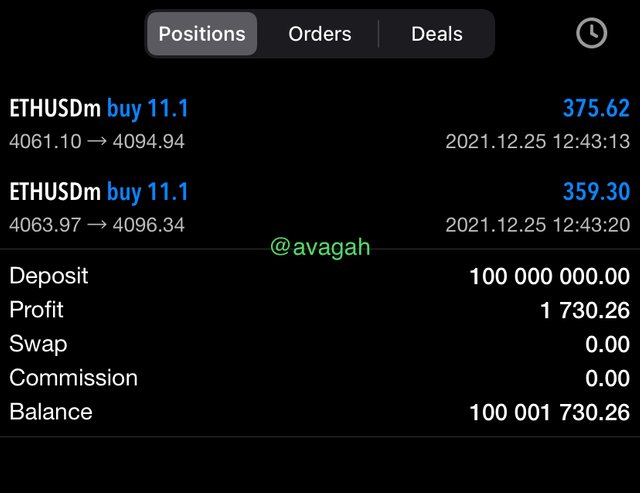
This is the profit I made from trading with the Bichi strategy
Opinion
I backtested this strategy and had a winning rate of not less than 80%
This strategy is easy to use and identify on the charts
This strategy can be used to scalp and swing
This strategy can be identified on smaller timeframes as well as the bigger ones

2: Define briefly Crypto IDX and Altcoins IDX. What is signal prediction trading. Is it legal or ill-legal in your country. (Explain briefly) [2points]

Crypto IDX
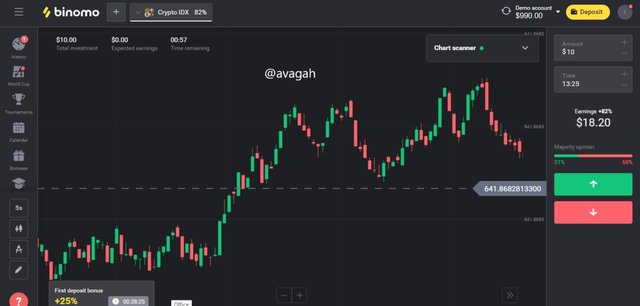
In trading, Indexes are the combination of assets. The crypto IDX is an index that is a combination of 4 cryptocurrencies (Bitcoin, Ethereum, Zcash, and Litecoin).
The index shows the average of all 4 assets with their demand and supply. Some traders use their direction bias on this Index to make their analysis when trading any of the 4 assets. This index is an asset of Binomo.
This is index is only available on the Binomo platform. Software is used to calculate the average of the 4 cryptocurrencies.
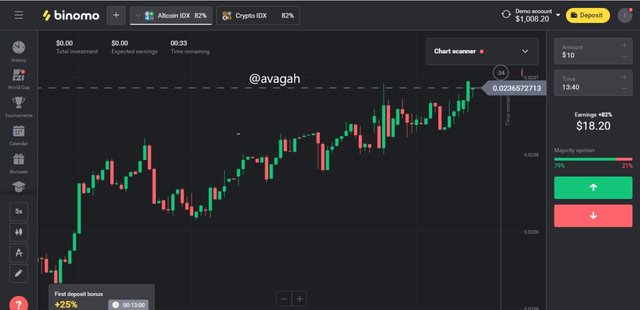
Altcoins IDX
Similar to the crypto IDX, Altcoin IDX is an index that combines 4 cryptocurrencies. This index finds the average of the combination of all four coins.
Altcoin IDX combines four which are **Ripple, Ethereum, Moner, and litecoin.
This also has software that calculates the average price of the four coins.
Signal prediction trading
Signal prediction trading unlike another form of trading where we buy an asset and hold to make a profit from price difference is a form of trading where we predict the price of an asset in a given period. We have to predict whether price will go up or down then make a profit if our prediction is right
Legal or illegal
Crypto IDX an index on the Binomo platform which combines cryptocurrencies is legal in my country Ghana. People in my country can use the Binomo platform anytime they want to make a profit.
Crypto trading has been something most Ghanaian youths are considering and it’s great to be able to use the Binomo platform which can help them have access to the crypto IDX. Having legal access to the crypto IDX will impact the trading in my country positively.
I’m glad to say Binomo and crypto IDX is legal in my country Ghana.

3. If you want to create your own penny IDX, then which 4 penny assets will you choose, and what is the reason behind choosing those four assets. Define Penny currencies. (Explain, no screenshot required). [2points]

Penny Cryptocurrency
Penny Cryptocurrency is coins that cost less than $1 similar to penny stocks. They are cheap and have the potential to grow very big.
If I’m creating my own penny IDX, I will choose four great penny cryptocurrency which is available in most exchanges and has good volume.
I will choose Dogecoin (DOGE), Stellar(XLM), Ripple (XRP), and VeChain(VET).
- Dogecoin
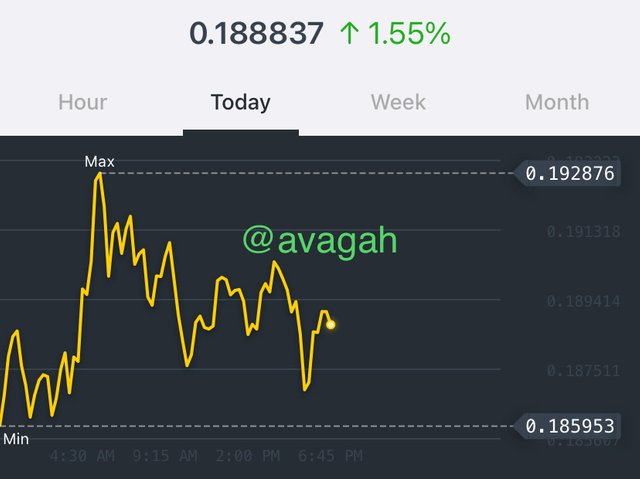
Dogecoin is a cryptocurrency established by Billy Markus and Jackson Palmer, who wanted to make a payment system a joke. The current price of Dogecoin is approximately $0.189. I will choose Dogecoin in my Penny IDX because of how cheap it is and its availability on most exchanges.
- Stellar Lumens (XLM)
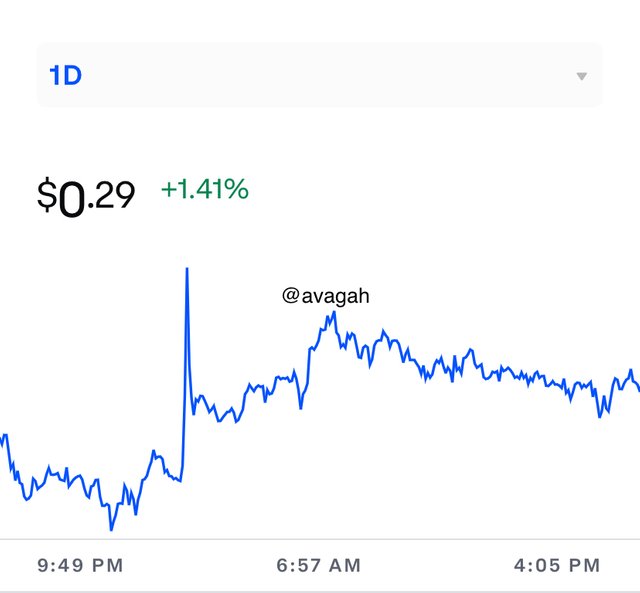
The second cryptocurrency I’ll add to my Penny IDX is the stellar Lumens. Stellar is a decentralized digital currency with a small cost of the transfer. Stellar is available in most popular exchanges. The current price of XLM is $0.29.
- Ripple (XRP)
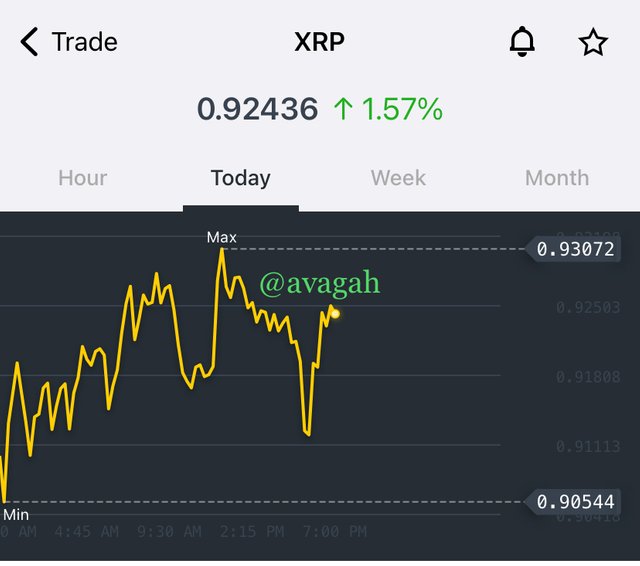
Ripple is a digital currency for making payments. It has one of the fastest systems which can process more than 1000 transactions per second. XRP has good liquidity and is available on popular exchanges. The price of XRP is $0.924
- VeChain (VET)
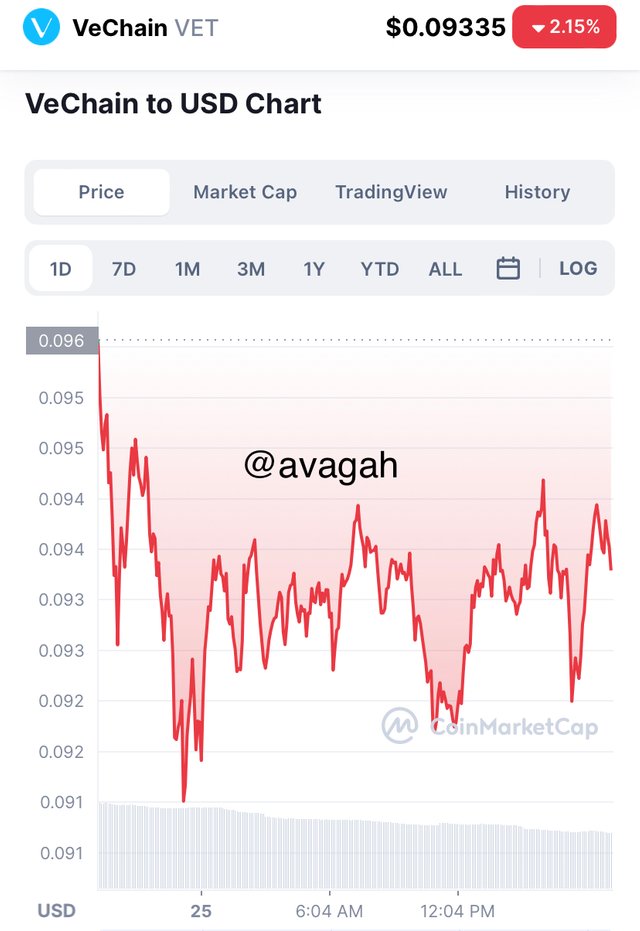
VeChain generates value from the activities of members within its ecosystem and also solves real-world economic issues. The current price of VET is $0.093.
The vet is available on the most popular exchanges.

CONCLUSION

Bichi Indicative Strategy was studied and tested. Bichi strategy combines Ichimoku cloud and Bollinger bands to trade. Bichi strategy is a great strategy to use in trading cryptocurrency because it has a good win rate of more than 80% and it can fit into any form of trading, whether swing, scalp, or day trading. Bichi strategy can be used in any timeframe too to get a trade, identify trends and trend reversals as well.
Crypto IDX was studied too. Crypto IDX is an index of 4 cryptocurrencies combined by software that calculates the average price of these 4 assets. Crypto IDX is available on the Binomo platform. Similar to the Crypto IDX, the Altcoin IDX combines 4 altcoins by finding the average of the prices of the assets.
Professor @utsavsaxena11, thank you so much for this fantastic lecture.