Welcome once again to another wonderful episode in the crypto Academy community. Before I present my homework post, I would like to acknowledge the professors and the crypto Academy community for making such an educative lecture possible. Today’s topic is simple Trading with median indicator.
Without wasting enough time I would present my homework post systematically based on the questions from professor @abdu.navi03.

1-Explain your understanding with the median indicator.
Just like many other technical indicators, the median indicator is one of the most common indicators used by experts in the crypto ecosystem. The median indicator is trend-based technical indicators Which seem to identify trends and spot trading signals as well.
As the name suggests, the median indicator estimates the mean price of the asset and places the indicator around the mean value to identify whether the price moves above or below the median line. This strategy is used to identify the current trend in the market and the volatility of the asset as well.
Although the median indicator is trend-based, the indicator seems to focus more on the volatility of the asset.
The indicator comprises three oscillating lines. The upper, lower and middle bands. These bands are used to determine the volatility of the price in the market. When the price is highly volatile, the price move closer to the upper and lower bands.
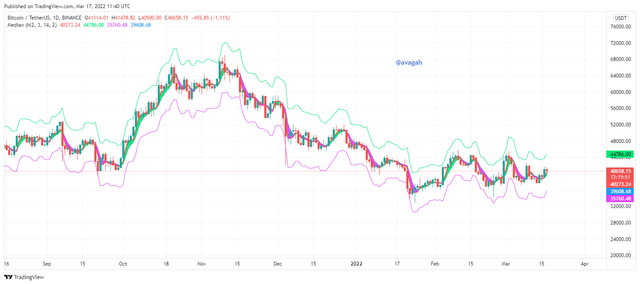
Screenshot from Tradingview.com
2-Parameters and Calculations of Median indicator. (Screenshot required)
I would demonstrate how to add the median indicator and reveal the best parameters for the indicator.
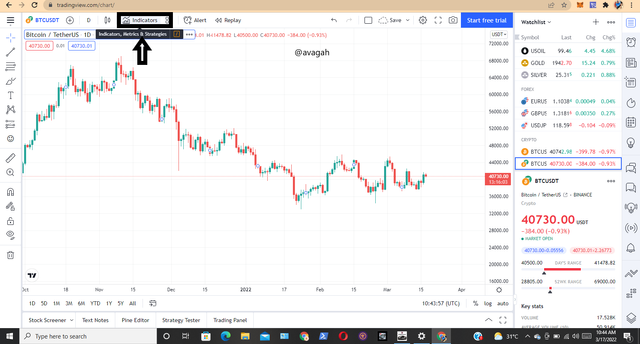
- Here, we open tradingview.com
- After opening the platform, we click the indicator search bar at the top.
.png)
Screenshot from Tradingview.com
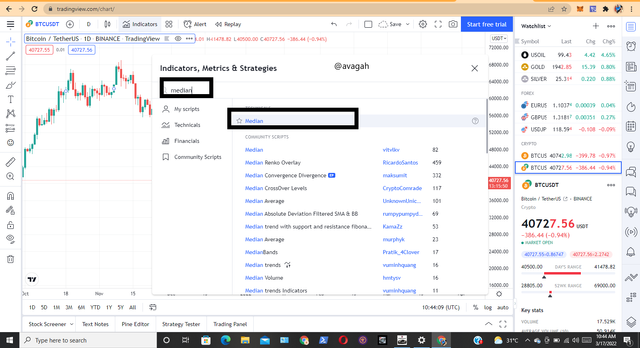
- Click on the indicator search bar at the top and search for the median
- The median indicator would be displayed as the first option.
- Click on the median indicator to add to the chart.
.png)
Screenshot from Tradingview.com
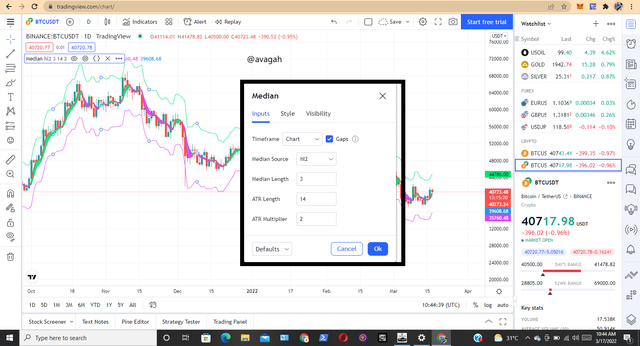
- After adding the indicator, click on the indicator setting to view the settings.
- Here, we can alter the parameters of the indicator.
.png)
Screenshot from Tradingview.com
- From the chart above, we can see the parameters of the median indicator on default.
- However, we prefer the default setting.
Calculations of the median indicator
The main formula for the median indicator is given by
MI = ATR %change ( median value, EMA )
w- Where,
- median value is (High price + Low price)/2
- EMA value is closing price x ATR multiplier + EMA ( previous day ) x ( 1- ATR multiplier )
- When the Median percentage Change is greater than the EMA value, the cloud turns purple
- When the Median percentage Change is greater than the median value, the cloud turns green in color
- Upper band = Median length + (2ATR)
- Lower band = Median length - (2ATR)
3-Uptrend from Median indicator (screenshot required)
Identifying trends with the median I indicator is very simple. Just like many other trend-based indicators, the median indicator also seems to identify signals for trades as well. As we explained earlier in our calculation, the median value and the EMA values help to identify trends with the indicator.
In case of an uptrend, the first instinct of traders is to be looking for an uptrend reversal, in case the market was in a downtrend or a bullish trend continuation. In any case, the median indicator would confirm the uptrend signal.
The cloud of the indicator turns green in case there's an uptrend. While the price stays above the cloud. This is a very simple strategy to identify trends with the median indicator.
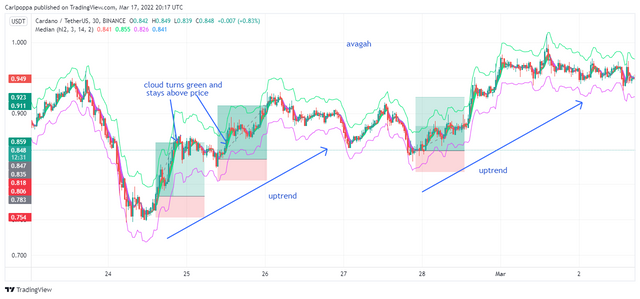
Screenshot from Tradingview.com
From the chart above, we used the median cloud to identify bullish trends. As we can see, whenever there’s a bullish trend, the cloud turns green as the price also stays above the cloud.
4-Downtrend from Median indicator (screenshot required)
Identifying trends with the median I indicator is very simple. Just like many other trend-based indicators, the median indicator also seems to identify signals for trades as well. As we explained earlier in our calculation, the median value and the EMA values help to identify trends with the indicator.
In case of a bearish trend, the first instinct of traders is to be looking for a bearish reversal, in case the market was in a bullish trend or a bearish trend continuation. In any case, the median indicator would confirm the downtrend signal.
The cloud of the indicator turns purple in case there's a bearish trend. While the price stays below the cloud. This is a very simple strategy to identify trends with the median indicator.
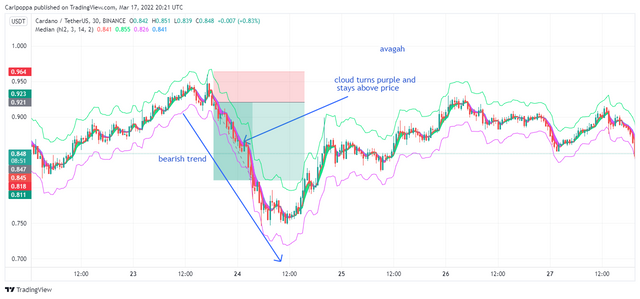
Screenshot from Tradingview.com
From the chart above, we used the median cloud to identify a bearish trend. As we can see, whenever there’s a bearish trend, the cloud turns purple as the price also stays below the cloud.
5-Identifying fake Signals with Median indicator(screenshot required)
As we are all aware, false signals are very common on crypto charts due to the volatility in the market. The whales usually manipulate the market with their huge volumes.
Inexperienced traders are always trapped by false signals. These signals may look very tempting to experienced traders as well due to how obvious the signals may look.
That’s why it’s always advisable to filter out false signals before trading. Trading may look very simple due to how obvious the chart may be presented. But without good risk management, a good technical analysis would always yield losses.
Moreover, we all are aware of technical indicators and their drawbacks. Some technical indicators confirm signals very late other provides numerous false signals as well yes technical indicators are certainly not 100 percent efficient.
Here, we would combine the RSI with the median indicator to filter out some false signals from the median indicator. The RSI indicates overbought and oversold sold regions with the 30 and 70 readings. Where the overbought region indicates downtrend reversal while the oversold region indicates an uptrend reversal.
However, on lower timeframe charts, the RSI signifies downtrend continuations when seen in the oversold regions and uptrend continuation at the overbought region.
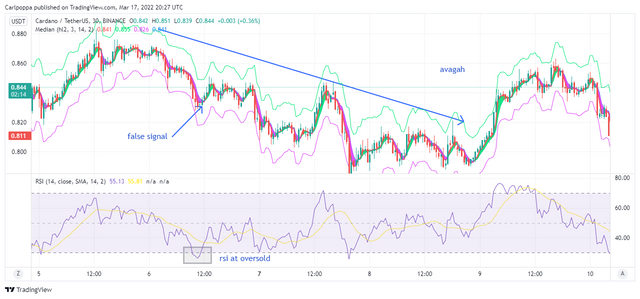
Screenshot from Tradingview.com
From the chart above, the RSI is at the oversold region which indicates a downtrend continuation. But the cloud of the median indicator turns green and stays below the price which means bullish trend reversal or a buy signal.
However, we can identify it as a false signal since the RSI is still oversold.
6-Open two demo trades, long and short, with the help of a median indicator or combination that includes a median indicator (screenshot required
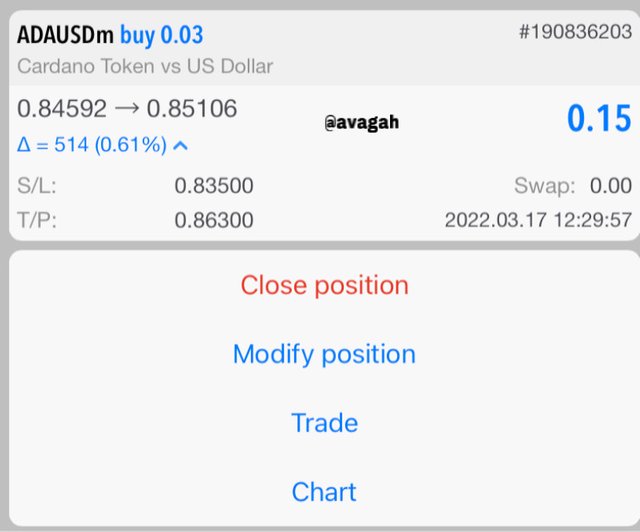
Buy trade with Median indicator
- Here, I would execute a simple buy trade with the median indicator,
- To trade with the indicator, identifying the whole momentum of the market whether it’s bullish or bearish.
- Here, we realized the whole momentum was bullish.
- Now we place the median indicator on the price and allow the green cloud to drop below the price.
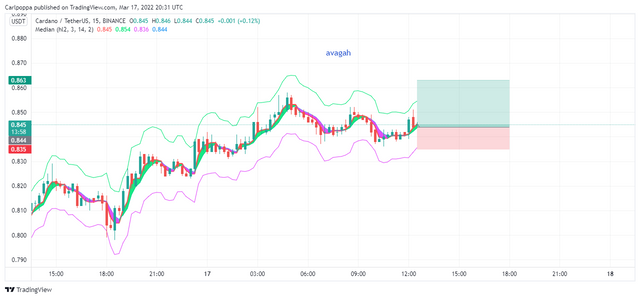
Screenshot from Tradingview.com
We placed a stop loss and corresponding takes profit ratio.
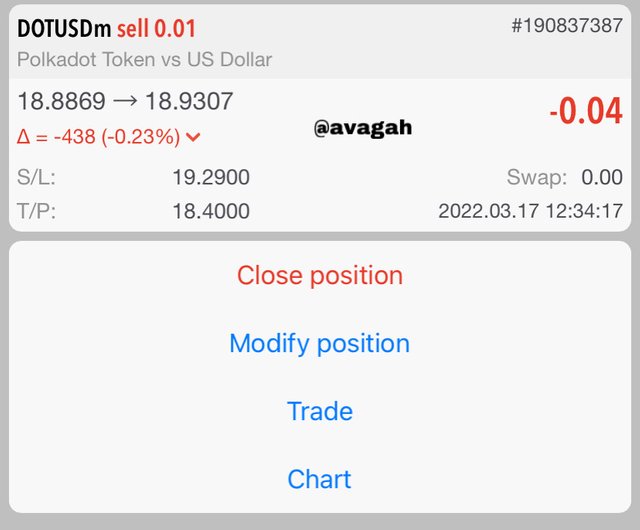
Sell trade with Median indicator
- Here, I would execute a simple sell trade with the median indicator,
- To trade with the indicator, identifying the whole momentum of the market whether it’s bullish or bearish.
- Here, we realized the whole momentum was bullish and there’s a possible reversal since the price has reached a key resistance level.
- Now we place the median indicator on the price and allow the purple cloud to move above the price.
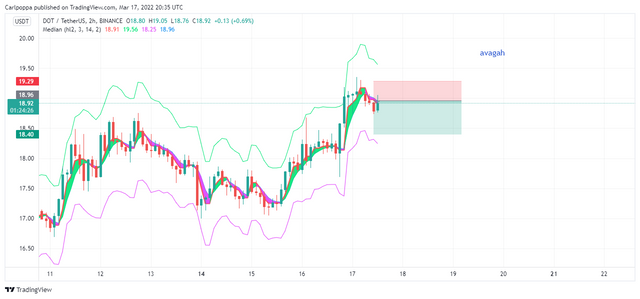
Screenshot from Tradingview.com
CONCLUSION
Trading is now the order of the day. Traders in the crypto ecosystem use numerous strategies to executed trades. However, I recommend everyone to master some 2 or three strategies which could be very profitable. Using different strategies every time would cause more harm than good.
Don't forget to use good risk management in trading. Always make sure your risk-reward ratio favors the profit. Do not risk money you are not willing to lose. Better still you can still use the 1% rule to reduce your risk.