Welcome once again to another wonderful episode in the crypto Academy community. Before I present my homework post, I would like to acknowledge the professors and the crypto Academy community for making such an educative lecture possible. Today’s topic is Candlestick Chart
Without wasting enough time I would present my homework post systematically based on the questions from the professor @reminiscence01.

1(a) Explain the Japanese candlestick chart? (Original screenshot required).
(b) In your own words, explain why the Japanese Candlestick chart is the most used in the financial market.
(c) Describe a bullish and bearish candle. Also, explain its anatomy. (Original screenshot required).

(a) Explain the Japanese candlestick chart? (Original screenshot required).
The Japanese Candlestick Chart
Generally, crypto charts refers to the graphical representation of the price behavior of an asset. As we are all aware, crypto currencies are highly volatile and as such, the price of the assets fluctuate every time. However, the price of the asset is represented in a form of a chart to allow people in the crypto ecosystem to read the price of the asset at any period.
Just like many other charts, the Japanese candlestick chart is used to represent the price behavior of an asset graphically. As the name implies, the Japanese candle stick chart was invented by a Japanese trader Munehisa Homma in the 1700s to describe the price behavior in the stocks market.
Unlike many other charts, the Japanese candlestick chart provides depth description about the price behavior of the asset. This candlestick charts does not just graphically represent the price behavior of an asset but helps to predict price and trends. In crypto trading, experts use the Japanese candlestick chart to make some technical analysis to be able to predict the prices of the asset before trading.
Considering a typical situation, the without the Japanese candlestick chart traders cannot uses the Break Retest Break (BRB) and the (MSB) strategies since they require some information on the candlestick charts. There are numerous technical strategies enhanced by the candlestick charts to predict price during crypto trading. Moreover, technical indicator are enhanced by the Japanese candle stick charts.
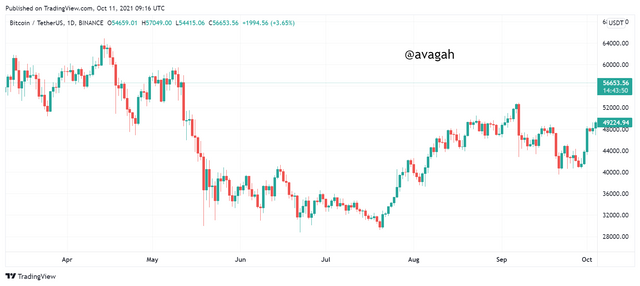
Japanese candlestick chart Describing price behavior of the Bitcoin

From the screenshot above, we can clearly see that, the Japanese candlestick chart has both green and red candlesticks. The red candlestick and green candlestick represents the bearish and bullish candlesticks respectively. However, they both have similar components (open,close,high and low) which would be discussed in detailed in this presentation.

In your own words, explain why the Japanese Candlestick chart is the most used in the financial market
As I said earlier, the Japanese candlestick chart is not just to graphically represent the price behavior of the crypto asset but also helps to predict trends and price behavior of assets. The candlestick charts gives precise details about the price behavior of an asset. Comparing to other charts like the line charts and the bar charts, the Japanese candle stick charts gives better approximations of the price within a specific period.
As I also said earlier, the Japanese candlestick charts are used by expert traders to make some technical strategies before trading. Technical strategies like the contractile diagonals, BRB, MSB are all enhanced by the Japanese candlestick charts. Without the Japanese candlestick charts, all these strategies may not be efficient as it seems.
The use of technical indicators like the RSI, ADX, Vortex,William %R and the others are all enhanced, by the Japanese candlestick charts.
Basically without, the Japanese candlestick charts, crypto trading would be very difficult since trends and price predictions wouldn't be precise and reliable. Traders would find it very difficult to predict the (highest, lowest, open and close price) within the a period of time.

Describe a bullish and bearish candle. Also, explain its anatomy. (Original screenshot required)

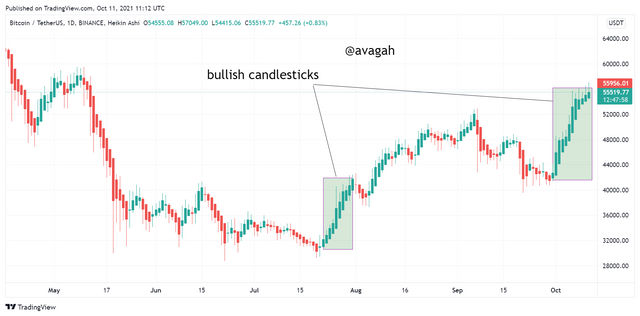
Bullish Candlestick
From the image above, the green candlestick represents the bullish candlestick. The bullish candlestick in the chart is used to represent uptrend or bullish trend in the price behavior of the asset. When the price of the asset increase or moves within a particular period, the bullish candlestick describes the uptrend movement with the bullish candlestick.
Components of the Bullish Candlestick
Open
This component refers to the opening price of the asset within a particular period. Let's consider a bullish candlestick of BTC within 5 minutes duration. The very first price within the 5 minute duration refers to the open price which is indicated on the candlestick as open.
Close
Contrary to the open price, the close component refers to the last price where the bullish candlestick jumps to another candlestick. Let's consider a bullish candlestick of BTC within 5 minutes duration. The last price within the 5 minute duration after which the candlestick jumps to the next candle stick is the close price which is indicated on the candlestick as close.
High
High simply refers to the highest price recorded on a particular candlestick within a specific time. Let's consider a bullish candlestick of BTC within 5 minutes duration. The highest price recorded within the 5 minute duration refers to the highest price which is indicated on the candlestick as high.
Low
Contrary to the high , the low refers to the lowest price recorded on the candlestick within a specific period. Let's consider a bullish candlestick of BTC within 5 minutes duration. The lowest price recorded within the 5 minute duration refers to the low price which is indicated on the candlestick as low.


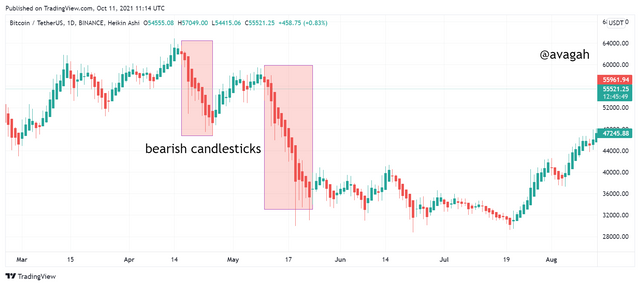
Bearish Candlestick
The Red candlestick represents the bearish candlestick. The bearish candlestick in the chart is used to represent downtrend or bearish trend in the price behavior of the asset. When the price of the asset decreases or drops within a particular period, the bearish candlestick describes the downtrend with the bearish candlestick.
Components of the Bearish Candlestick
Open
Just as explained earlier in the bullish components, the open in the bearish candlestick also marks the beginning of the bearish trend within a particular period.
Close
Similar to the bullish candlestick, the close in the bearish candlestick marks the close price of the bearish trend within a particular period of time.
High
This component refers to the highest price of the bearish candlestick within a specific period of time.
Low
Contrary to the high component, the low represent the lowest price of the bearish candlestick within a specific period of time.


CONCLUSION
In my opinion, I think the Japanese Candlestick chart is the most important tool on the crypto chart. Without the Japanese candlestick chart, Traders in the crypto ecosystem would find it very difficult to trade without those information. Technical strategies and technical indicators would probably be of less value without the candlestick chart.
Thanks once again for such a wonderful lecture.