
Welcome once again to another wonderful episode in the crypto Academy community. Before I present my homework post, I would like to acknowledge the professors and the crypto Academy community for making such an educative lecture possible. Today the topic is all about trading.

Polygon (matic) Trading
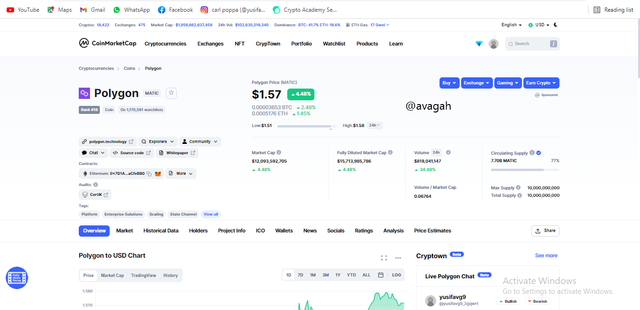
The polygon is one of the most renowned blockchain technologies which was built byJaynti Kanani, Sandeep Nailwal and Anurag Arjun, and some blockchain developers in 2017.
The main aim of the project was to solve blockchain problems. The ETH blockchain network and the bitcoin blockchain seems to complete transaction very slowly and charge huge transaction fees as well. However, the polygon improved on both the scalability and transaction fees problem. Moreover, the polygon provided better security to transactions as well. This has prevented double spending which was previously common on the ETH and Bitcoin blockchain network.
The Matic being the native token on the polygon blockchain network was initially built to be used as a transaction fee. Just like many other native tokens on other blockchain networks. However, the polygon blockchain has been able to solve many problems and has widened its use cases. Due to its performance, the Matic token has increased tremendously over the past few days.
The Matic can complete 65,000 transactions within a second which proves to be one of the fastest blockchain networks among the old blockchain networks. Moreover, Matic makes blocks confirmation in less than 2 secs.

Technical Analysis of Polygon
Good traders always start analyzing the longer timeframe. No traders would like to trade against a trend. A good trader taking buy signals in a bearish market could cause more harm than good. Hence, it is very advisable to start the analysis in a longer timeframe.
Analysis from the 1-day timeframe
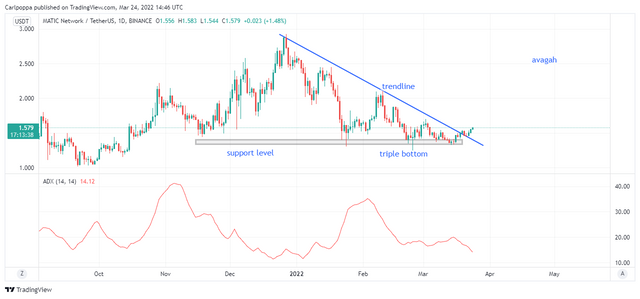
Analysis from the 1-day timeframe shows a breakout of a new bullish trend. In my opinion, this is a new beginning of a whole new market structure.
Identifying the point of reversal on a long-term trend is not an easy task. There would be a lot of false signals which would be very difficult to identify. Sometimes, traders need to be very careful and patient as well.
The price of the Matic is currently around a strong support area which suggests that the price is most likely to reverse.
However, the ADX reads below 25 which suggests that there’s no trend currently available. This could be an indication that the price could still move bearish again to hit the support before it reverses. But in any case, where would be a reversal.

Analysis on the 4-hour timeframe
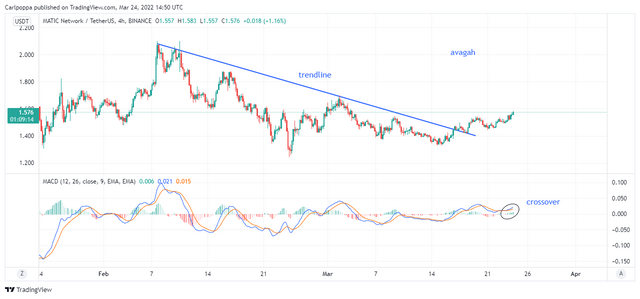
The 4-hour time frame looks similar to the 1-day timeframe. Both trends are bearish and there’s a reversal signal at the end of the trend.
Looking at the chart above, the breakout wasn’t very strong as a good breakout is supposed to be. Furthermore, concerning the breakout, the price is still consolidating without a strong movement.
The MACD indicator also confirms the presence of the uptrend with the crossover. But looking at the crossover, the cross seems to be very weak as well. There’s no strong momentum with the crossover.
Hence, the bullish market structure is not vividly confirmed.

Analysis on the 2-hour timeframe
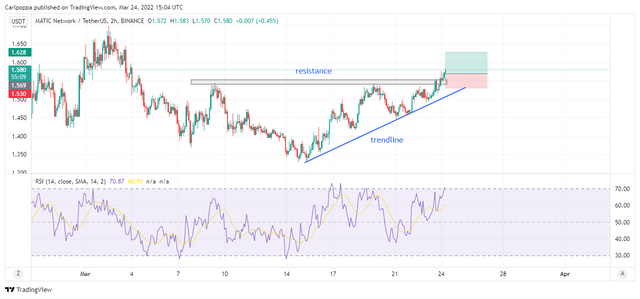
Here we would take trade entries.
The chart shows ascending triangle which mean when the price break above the resistance line, we take buy entries.
From the chart above, the price of the Matic has broken above a new resistance level. This means the resistance has now transformed to a new support level.
Here, we can comfortably place our stop loss below the new support level. And place our take profits somewhere above the support with good risk management as well.
The RSI also confirms the signal since it stays above the 50 levels.

Real Transaction from my Exness broker account.
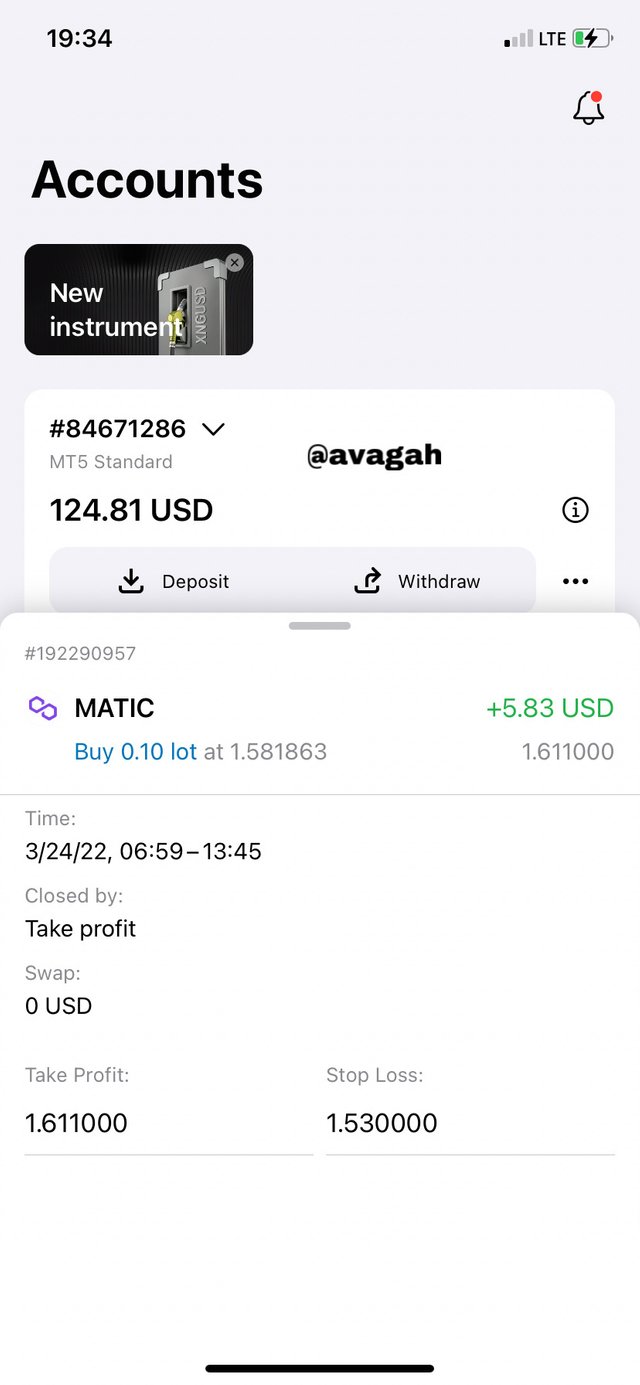
- Today I allowed my trade to hit tp without taking partial profits.

CONCLUSIONS
Trading is now the order of the day. Traders in the crypto ecosystem use numerous strategies to executed trades. However, I recommend everyone to master some 2 or three strategies which could be very profitable. Using different strategies every time would cause more harm than good.
Don't forget to use good risk management in trading. Always make sure your risk-reward ratio favors the profit. Do not risk money you are not willing to lose. Better still you can still use the 1% rule to reduce your risk.