
Welcome once again to another wonderful episode in the crypto Academy community. Before I present my homework post, I would like to acknowledge the professors and the crypto Academy community for making such an educative lecture possible. Today’s topic is simple TRADING STRATEGY WITH RSI + ICHIMOKU
Without wasting enough time I would present my homework post systematically based on the questions from professor @abdu.navi03.

1-Put your understanding into words about the RSI+ichimoku strategy

Trading is now the order of the day. Traders in the crypto ecosystem devise their special strategies to aid in trading. Usually, the technical analyst uses price action (the use of technical strategies and indicators) to make an analysis. In my opinion, every trader should have some specific strategies for trading. If not for general stocks, you can have different strategies for different kinds of stock (forex, crypto, indices, synthetics, etc).
Today we have combined two different indicators to make our analysis. The RSI+ichimoku strategy. Most traders may have encountered these two different indicators separately. If not the Ichimoku indicator, the RSI is very common to most traders.
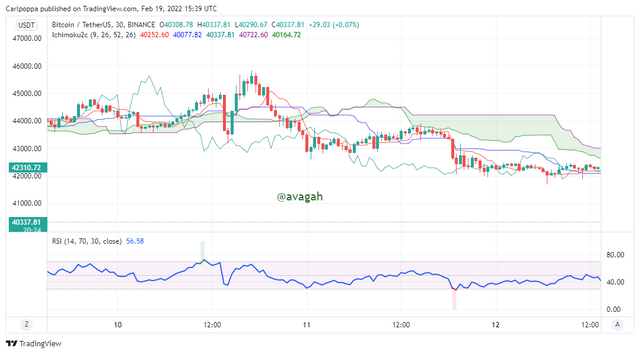
The RSI indicator is a momentum-based indicator that is used by traders to identify signals for trading. The RSI can be used to identify trends, oversold and overbought regions, divergence in price, and spot trade signals as well. This indicates that the RSI indicator can function effectively alone.
However, the Ichimoku indicator is also used to identify key liquidity levels and spot trade signals as well. These Indicators are used alongside one another to perfect trades. As the saying goes "Two heads are better than one". Using two different indicators is certainly better than just using one.
The RSI focuses on identifying signals while the Ichimoku focuses on identifying the trading opportunities or trade signals.

2-Explain the flaws of RSI and Ichimoku cloud when worked individually

As we are all aware, the stocks market can be very deceiving. The market can communicate trend reversal but the actual trend is a continuation. Market structure can act like it's broken but the structure still holds.
That brings us to the saying that "No strategy is perfect". Yes, technical strategy can be very efficient but there will still be some drawbacks with the strategy.
Drawbacks of RSI Indicator
The major problem associated with the RSI indicator is trend identification. Usually, on the shorter timeframe chart, identifying trends with the RSI is very difficult. They tend to produce false trend signals.
The RSI turns a blind eye to the volume in the market. Volume is a very delicate feature to be observed by traders. Usually, when the volume of the asset is huge, the market tends to be more volatile. Hence, it is very necessary to identify whether the volume in the market at that particular time is huge. The RSI doesn't give priority to the volume. The RSI can read overbought with should indicate a bearish trend reversal but the price would still move in a bullish trend continuation.
These two major drawbacks lead to false trade signals. Most scalpers usually find the RSI to be a trash indicator. The RSI can enter the oversold region a couple of times before it reverses back. Inexperienced traders would also find the indicator as a trash indicator since most of its signals in a shorter timeframe are false signals.

Drawbacks of Ichimoku Indicator
The Ichimoku indicator uses historical data to make an analysis. Although this data can be very profitable, current data doesn't solely depend on previous records. The use of historical can produce more false signals.
The indicator looks cumbersome on the chart. Unlike the RSI indicator that uses only one oscillating line to represent the whole indicator. An amateur trader would find it very difficult to understand the Ichimoku chart.
Just like many other technical indicators, the Ichimoku indicator seems to identify trends very late. Most traders would like to maximize their profits by identifying signals from the early stage. scalpers find it very difficult to use only the Ichimoku indicator to identify signals for trading.

3-Explain trend identification by using this strategy (screenshots are required)

Just like many other technical indicators, the RSI+ichimoku can also be used o identify trends. Identifying trends is the top priority of every trader. I would demonstrate how to identify both bullish and bearish trends using the RSI+ichimoku strategy.
Identifying Bullish trend With the RSI+ichimoku Strategy
Identifying bullish trends with the strategy is very simple, Usually, the 70 and 30 reading on the RSI indicates the oversold and overbought regions.
The overbought regions usually should indicate a bearish trend reversal while the oversold region should indicate a bullish trend reversal.
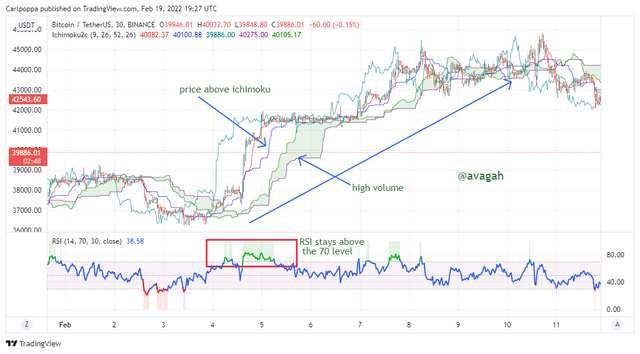
However, the RSI stay in the overbought region during a strong uptrend movement. Usually, on the shorter timeframe chart, the RSI oscillates above and below the 70 regions or the overbought line.
During an uptrend, the price usually stays above the Ichimoku indicator. Moreover, the cloud on the Ichimoku indicator shows a wide expansion indicating a high volume in the uptrend.
Identifying Bearish trend With the RSI+ichimoku Strategy
Identifying bearish trends with the strategy is very simple, Usually, the 70 and 30 reading on the RSI indicates the oversold and overbought regions.
The overbought regions usually should indicate a bearish trend reversal while the oversold region should indicate a bullish trend reversal.
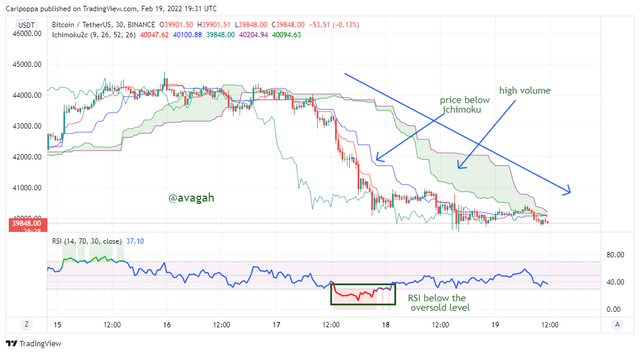
However, the RSI stay in the oversold region during a strong downtrend movement. Usually, on the shorter timeframe chart, the RSI oscillates above and below the 30 regions or the oversold line.
During a bearish trend, the price usually stays below the Ichimoku indicator. Moreover, the cloud on the Ichimoku indicator shows a wide expansion indicating a high volume in the bearish trend.

4-Explain the usage of MA with this strategy and what lengths can be good regarding this strategy (screenshots required)

Using the Moving average alongside the RSI+Ichimoku strategy is just like using three indicators at a time. In my opinion, Using more than three indicators to confirm a signal is close to perfection or impossible to fail.
Moving averages are used by many experts traders for trading. The long period moving averages like the 200 MA and the 100 MA is used to identify trends while the crossovers on the moving average are used to identify signals. Combining these three indicators would be very profitable.
Here I would prefer to use the 50 and 200 moving averages. The RSI+Ichimoku would be used to identify the trends while the 50 and 200 MA would be used to identify signals with the crossovers.
The 50 MA represents the fast-moving average while the 200 MA represents the slow-moving average. The 50 MA cross above the 200 MA in case of a buy signal. likewise, the fast-moving average cross below the slow-moving average in the case of a sell signal.
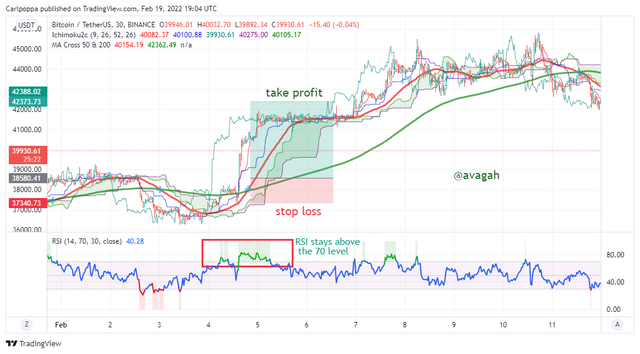
From the chart above, We can see clearly that, the RSI is in the oversold region which indicates an uptrend movement. Furthermore, the Ichimoku indicator is above the price which proves the uptrend is valid. The cloud shows high volume which indicates strong bullish momentum.
Above all, the crossovers of the MA show a clear buy signal since the 50 MA crosses above the 200 MA.

5-Explain support and resistancet with this strategy (screenshots required)

Identifying support and resistance levels with the RSI+Ichimoku is very simple. Here, we would demonstrate how to identify support and resistance levels in both a ranging and a trending market with this strategy.
Identifying support and resistance levels in a trending market involves the Ichimoku cloud while the sideways involve just the RSI indicator.
Identifying support and resistance levels in a bullish trend
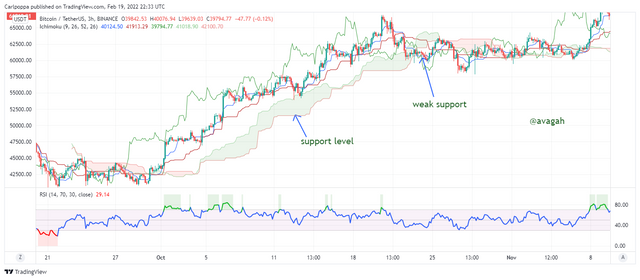
As I said earlier, identifying support and resistance levels in a trending market involves the use of only the Ichimoku cloud. During an uptrend, the Ichimoku cloud serves as the support level. The cloud has two colors, red and green. When the cloud turns green, it serves as a support to the uptrend. Price bounces off whenever the price reaches the support level.
Usually, the price stays far above the green cloud when the market is in a strong bullish momentum. When trends become very weak, price begins to move closer to the green cloud (support) which indicates a weak trend or a possible reversal.

Identifying support and resistance levels in a bearish trend
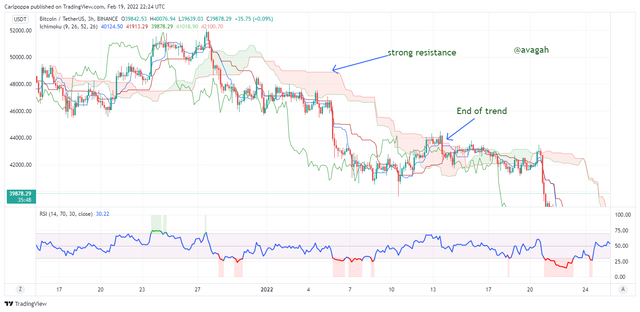
Identifying support and resistance levels in a trending market is very simple. During a bearish trend, the Ichimoku cloud serves as the resistance level. The cloud has two colors, red and green. When the cloud turns red, it serves as a resistance to the bearish trend. Price bounces off whenever the price reaches the resistance level.
Usually, the price stays far below the red cloud when the market is in a strong bearish momentum. When trends become very weak, price begins to move closer to the red cloud (resistance) which indicates a weak trend or a possible reversal.

Identifying support and resistance levels in a bullish trend
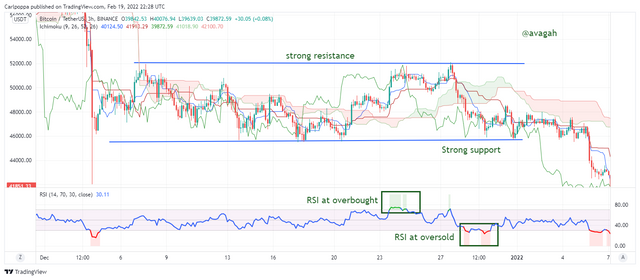
Identifying support and resistance levels in a sideways or consolidating market is very simple. As I said earlier, the RSI is used to identify these key liquidity levels. Since the price is consolidating, we can easily identify the peak in a ranging market with the RSI oversold and overbought reading.
When the RSI moves to the overbought region, the market is considered to be at the peak since the market is ranging and we consider the price at that level to be the resistance level. Likewise, when the RSI moves into the oversold region, we consider it as the key support level.

6-In your opinion, can this strategy be a good strategy for intraday traders?

I think this strategy is a very good strategy that can be practiced by any kind of trader. Both scalpers and swing traders can take advantage of this strategy.
The strategy seems to identify trends very easily and spot signals as well. Trading involves experience and strong psychology to back trade. Two different people can use this same strategy but one would yield more profits than the other. This is due to either inexperience or a weak mentality.
Talking from this strategy, scalper would require the use of one technical strategy like BRB, MSB, W, and M patterns just to perfect the trade. Fundamental analysis is also required to use alongside the strategy.
Sometimes, the strategy may seem very simple to comprehend but turns out otherwise.
Above all, I think this strategy could be very profitable if mastered and use proper risk management in trading. Yes, no strategy is 100% but this strategy could be a life-changing one if it is used the right way.

7-Open two demo trades, one of buying and another one of selling, by using this strategy

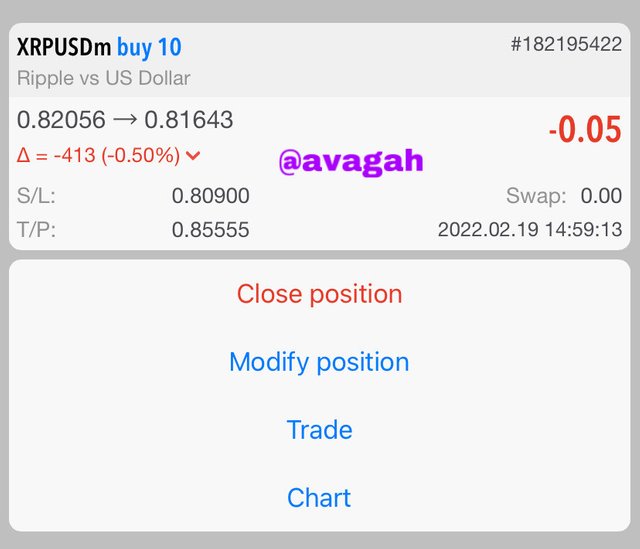
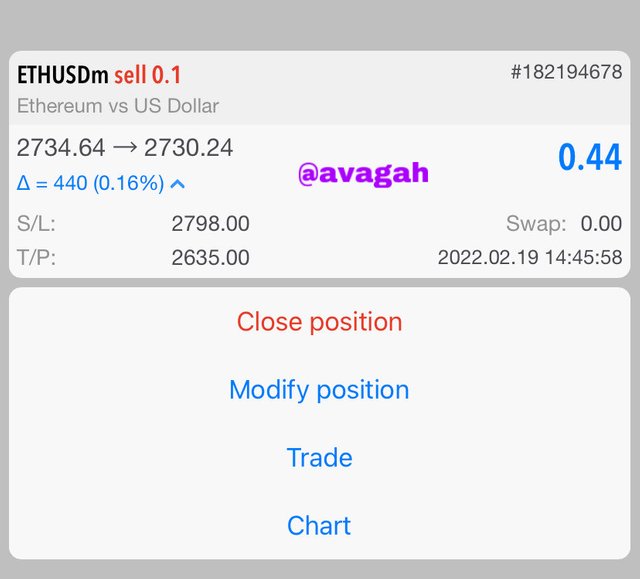
Here, I am going to execute two trades. One buys trade and one sells trade. I would demonstrate clearly how to trade with the RSI+Ichimoku strategy.
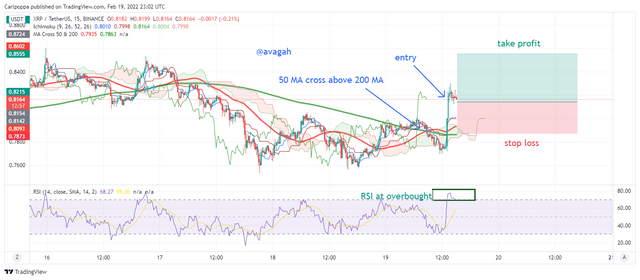
Buy trade of XRPUSDT using RSI+Ichimoku strategy
To execute a buy trade,
- Identify a clear bullish trend
- wait for the RSI to be in the overbought region
- Place a buy order above the cloud support level
- Set a stop loss and a corresponding take profit ratio.
- Use proper risk management
Trade in my Meta trader account

Sell trade of ETHUSDTusing RSI+Ichimoku strategy
To execute a sell trade,
- Identify a clear bearish trend
- wait for the RSI to be in the oversold region
- Place a sell order below the cloud resistance level
- Set a stop loss and a corresponding take profit ratio.
- Use proper risk management
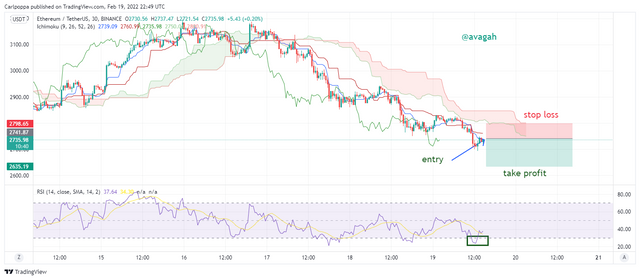
Trade in my Meta trader account

CONCLUSION
Overall, I would say great lecture. The RSI+Ichimoku strategy is one of the most effective technical strategies used by most expert traders. The strategy is very simple to use and effective as well.
However, I would recommend the use of both fundamental analysis and other technical indicators alongside this strategy. This is to increase the win percentage since no strategy is 100%.
From my experience in trading, I realized there are numerous strategies used by different traders. I would recommend any traders to stick to some 2 or 3 strategies and master the technique very well. It is very advisable to use good risk management as well. Do not risk money you are not willing to lose.
Bittorrent Golden Wallet Prizes
For steemit users prizes are distrubuted based on their profile reputation Point. Don't get behind Sign in Now CLICK HERE and claim your Prizes now
Reputation Point based Prizes:
Downvoting a post can decrease pending rewards and make it less visible. Common reasons:
Submit