Welcome once again to another wonderful episode in the crypto Academy community. Before I present my homework post, I would like to acknowledge the professors and the crypto Academy community for making such an educative lecture possible. Today’s topic is
Without wasting enough time I would present my homework post systematically based on the questions from the professor @lenonmc21.

THEORY
1. Explain and define in your own words what the “VWAP” indicator is and how it is calculated (Nothing taken from the internet)?

In crypto trading technical analysis, there are many trading strategies with some being more effective than others. In this section I’ll tell you more about one of the most effective ones and it’s an indicator called Volume Weighted Average Price.
The VWAP indicator (Volume Weighted Average Price) is a superb indicator that traders use to generate good profits on the market. The average price of an asset in a day is calculated using price and volume.
With only one line on the chart that moves with the price, the VWAP indicator is similar to the moving average indicator. When the price rises above the VWAP line, traders buy, and when the price falls below the VWAP line, traders sell. When the price is above the VWAP, the market is bullish, and when the price is below the VWAP, the market is bearish.
Also, When timeframe are adjusted, most indicators change shape, but the VWAP maintains its appearance, making it extremely effective. Most traders do multi timeframe analysis and having difficulties doing that with certain indicators but VWAP has that flexibility feature to adjust to multi timeframe analysis. A good indicator to use to make good profit.
CALCULATING THE VWAP INDICATOR
In calculating the Volume Weighted Average Price there’s 3 key things to consider.
- Price
- Volume
- Number of Candles per day
The VWAP is calculated by adding the price to the volume of money traded all divided by the number of candles per day.
VWAP= (price+Volume of Asset traded)/Number of candles per day.

2. Explain in your own words how the “Strategy with the VWAP indicator should be applied correctly (Show at least 2 examples of possible inputs with the indicator, only own charts)?

I'll show you how to use the VWAP indicator appropriately to make money on the market in this section.
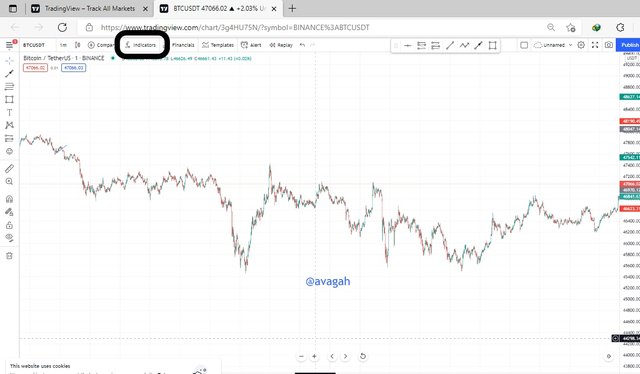
To begin, go to TradingView.com and add the indicator to your charts
When your trading view is opened, click on the indicator tool on top as I have highlighted in the picture below.
——
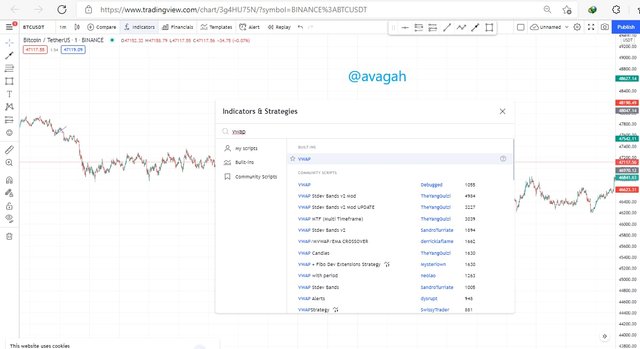
- click on the search to search for the indicator
- Type VWAP into the search tool
- Click on the indicator
Use the image below as a guide to this step
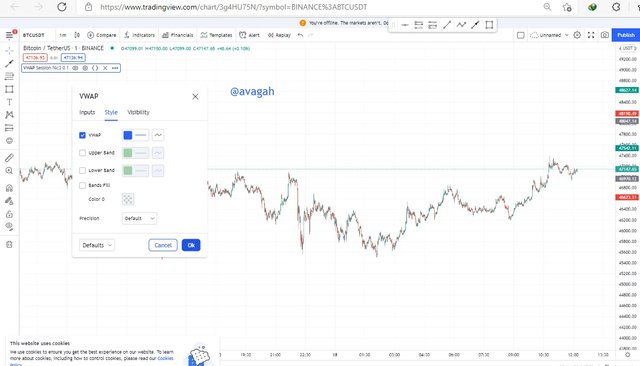
- After you add the indicator, click on the edit tool at the top left corner as shown in the image below
- switch to the style part an uncheck the Upper Band, Lower Band and the Bands fill
Use the image below as reference to this step
Then your indicator is now fully added
The image below shows how the indicator will look like on your chart
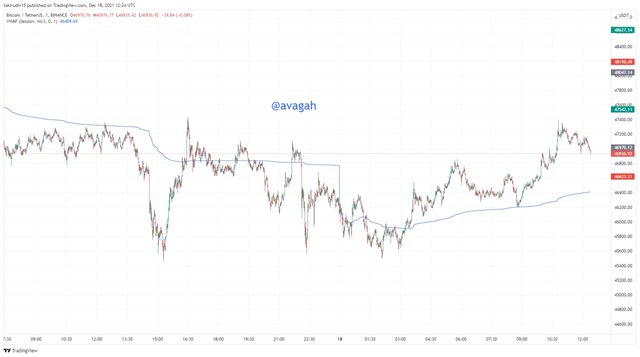
How to use the VWAP indicator correctly
Now that we know how to add the indicator to the chart, we have to know how to use it correctly to make money.
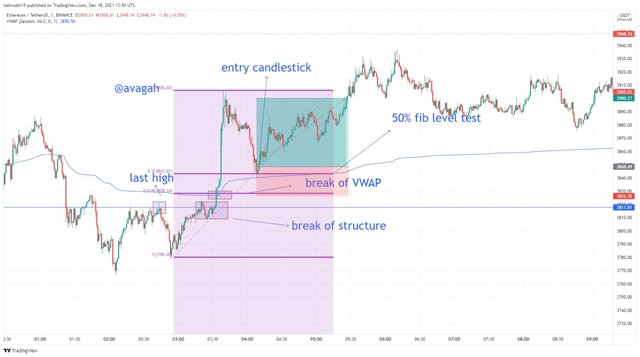
1.Break of market structure
To use this indicator, the first thing we look out for is market structure break. In a case of a bearish trend where there’s lower lows and lower highs structure, we will wait for the structure to break when the last lower high is broken above. This indicates a change in trend.
Also when there’s a bullish trend when the market is creating a higher low and higher high pattern and a break of structure happens which will take out the last higher low to indicate a change in trend.
There must be a break of the VWAP indicator to make it valid.
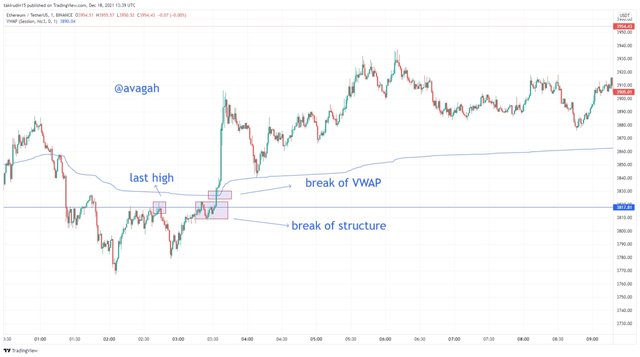
2. Retracement to VWAP using Fibonacci
The next thing to consider is the level of pullback. After the market make the move you have to now use your Fibonacci too to know how long the market will retrace. Fibonacci is having some key numbers that we are to take very serious. The 50% level and 61.8% level. We will use those levels as reference to make entry as price returns to VWAP.
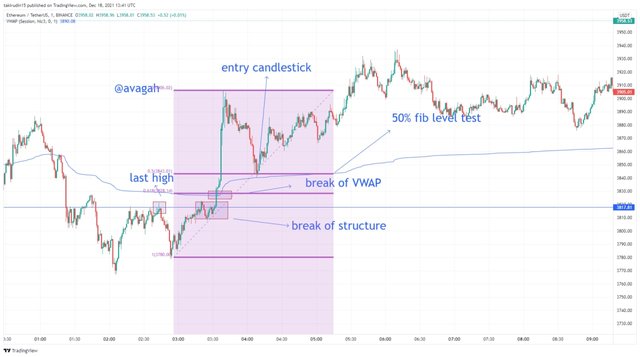
3. Risk Management (stop loss and take profit sizes)
The trade should be around the Fibonacci levels 50% and 61.8% and the stop loss must be slightly belwo the Fibonacci level of 61.8%. The take profit too must be 1.5 times the stop lows to have a good 1:1.5 risk to reward or a maximum of 1:2 that is making the take profit twice the stop loss.
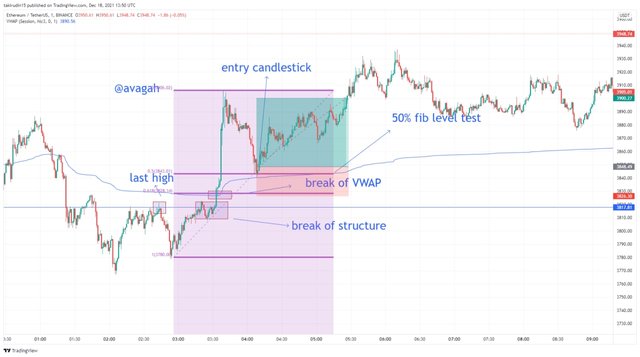

3.Explain in detail the trade entry and exit criteria to take into account to correctly apply the strategy with the VWAP indicator

In this section I’m going to talk more about the entry and exit criteria when using the VWAP indicator.
The first thing to consider is the market structure break. In a down trend where lower low and lower high structure is formed, the price must break above the last lower high to form a new trend and in an up trend when the market is forming a higher high and higher low structure, the price must break below the last higher low to form a new trend.
After the break of structure, the price must retrace to the VWAP line. While monitoring the retracement, you’ll use your Fibonacci tool to measure where that pull back will end then you enter the trade. The key Fibonacci levels to monitor are the 61.8% and the 50%.
Buy or sell when the price retraces to the VWAP line at the Fibonacci 61.8% and the 50% level.
Stop loss should be placed below the Fibonacci levels when buying and it should be above the Fibonacci levels when selling the asset.
Take profit must be 1.5 times the stop loss to get a risk to reward of 1:1.5.

PRACTICE
Make 2 entries (One bullish and one bearish), using the strategy with the “VWAP” indicator. These entries must be made in a demo account, keep in mind that it is not enough just to place the images of the entry, you must place additional images to observe their development in order to be correctly evaluated. .

In this section I am going to take a trade with the VWAP indicator
Buy Order
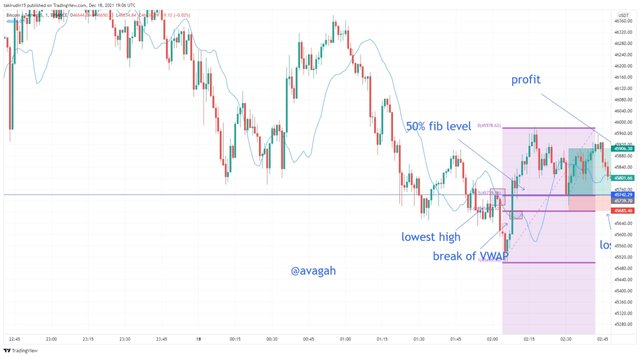
Screenshot of the chart below is BTCUSDT on the minute timeframe
The price broke the lowest high of the down trend and I used the Fibonacci tool to measure the level of retracement.
I watched price to move towards the 50% Fibonacci zone and waited to get my entry right. I placed my stop loss below the 61.8% Fibonacci level and take profit twice the stop loss to get a good 1:2 risk to reward.
- I placed my order on mt5
A buy order
Sell Order
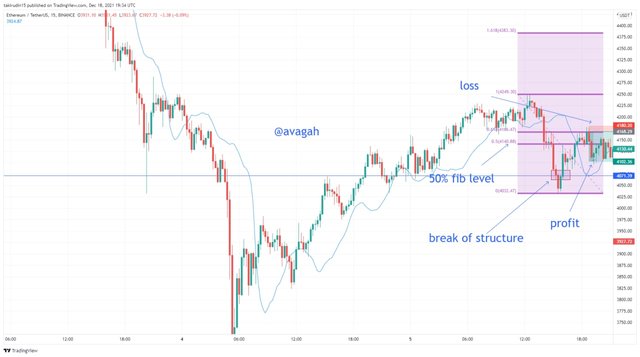
Screenshot below is a chart on ETHUSDT 15min timeframe
price was forming a higher low and higher high and it broke below the highest low making a break of structure
After the break of structure there was a pull back to the 50% Fibonacci level which I was monitoring
At the 50 percent Fibonacci level I sold ETHUSDT
placed my stop loss right under the level
My take profit was twice my stop loss making a good 1:2 risk to reward.
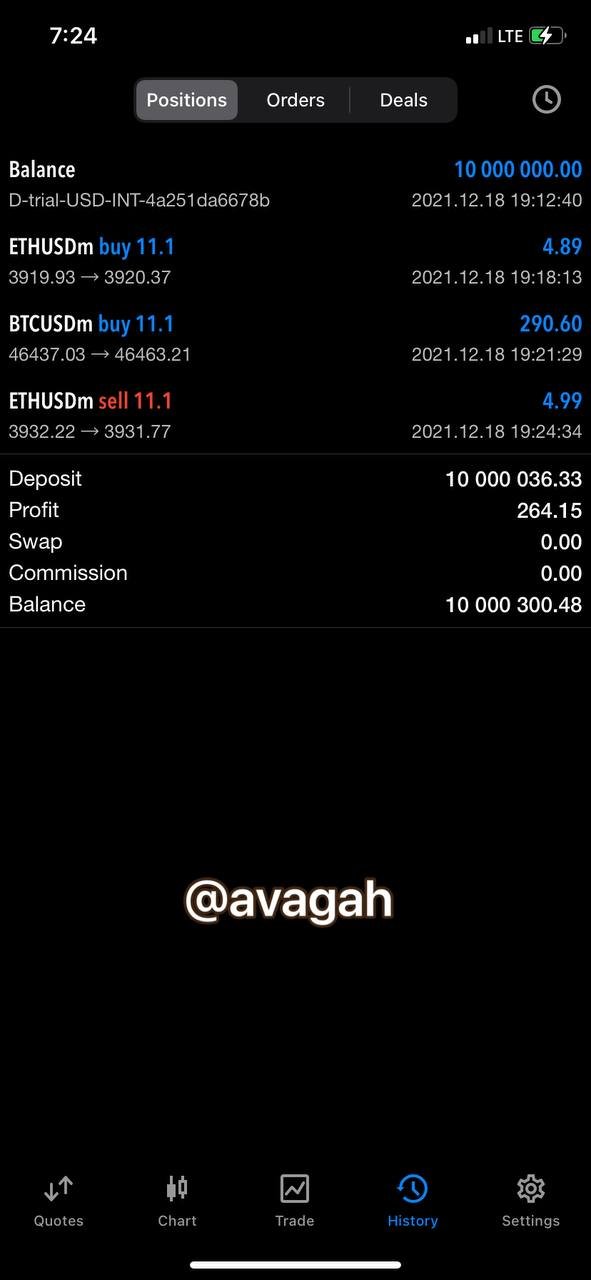
The image below shows the profit I made for selling ETHUSDT and buying BTCUSDT

Conclusion

Volume Weighted Average Price indicator is a great indicator that combines price and volume to make good predictions on the market. It’s an indicator that can adapt to multi timeframe analysis making the use of it very good and helpful.
To use the indicator you have to identify a break of structure and a pull back to the 50% and 61.8% Fibonacci level then you buy or sell based on the market structure break. VWAP is a great indicator to use.
Professor @lenonmc21 deserves much appreciation for bringing this great indicator.