INTRODUCTION
What an honour it is to be amongst the participants yet again of this great Steemit crypto academy contest, and explained below is my entry to this interesting and educative content, please follow along.
Question 1: Explain the Concept of Divergence in Trading
Divergence is a concept in the technical analysis that occurs when an asset’s price movement goes against the movement of a related momentum-based technical indicator, which may be the Relative Strength Index (RSI) or Moving Average Convergence Divergence (MACD) or a stochastic oscillator.
As the price action and the indicator movement starts to work in opposite directions, this kind of divergence appears. Take, for example, a situation where the price increases and makes higher highs while at that time an indicator like the RSI makes a lower peak; this dissimilarity between the price and the indicator means that the price movement is not in full force perhaps indicating that a change of trend may come soon.
Divergence is possible in both upward and downward trends, making it a possible indication of trend reversals or trend continuations. It is differences that are also useful in trading since the actual forces of price moves are brought to focus.
This is important because it reduces likelihood for illusions about the direction of price and the likely momentum of the asset. This enables traders to narrow down the perfect spot to enter or a position to exit.
There are mainly two types of divergence: regular divergence and hidden divergence. As a general rule, regular divergence is employed as a trend reversal signal and it takes place when the movement of a price is contrary to a momentum indicator. For instance, the scenario of bullish regular divergence – imagine the price creating a lower low but the RSI indicator being able to create a higher low.
This tells us that even though the price went and dropped further, the strength of the downward momentum is fading: a bullish reversal may be around the corner.
In the opposite situation, the price high (for a certain period) regular divergence will be where the price moves up, forms a new high, but there is supposed to be a momentum indicator which makes it a bearish divergence as it makes a lower high. Traders appreciate regular divergence because they are alerted that a trend may change soon.
This permits them to adjust their positions before it is too late, and their chances of profiting from the first phase of a new trend are certainly boosted as well. By identifying regular divergence, traders will not be surprised when a persistent trend begins to run out of steam. They can focus instead on likely turning points and protect themselves from exposure.
In comparison, hidden divergence can be used to seek continuation of the trend rather than reversal on the contrary making it dependable to traders who are trend followers. A hidden divergence takes place when the price and indicators are reversed to the extent of representing that the current trend still has sufficient strength left with it despite a brief dip or correction in the trend.
Applying this in a bullish hidden divergence model, the price will decline with a higher low than the indicator but this indicates a temporary bearish trend and that the uptrend is recurrent likely to continue.
In the same manner, in a downtrend, the prices show lower highs with the indicator registering higher highs in a bearish hidden divergence forming situation thus implying that the rallies will not be sustained and that the downtrend is expected to take over.
Hidden divergence thus aids the trend following traders in that there will be assurance of the trend protection and thus there will not be much possibility of leaving a trend that has already proven to provide profit. By identifying a hidden divergence, traders will know when to maintain or increase their position in the same trend which is confined to the same direction.
Simply stated, divergence is a helpful technique for knowing the key turning points in the market since it allows the trader to determine the late stage of the price action, making it also crucial in technical analysis.
The specialists in technical analysis employ Divergence signals to warn them of likely trend changes by concentrating on the gaps that exist between the price movement and the momentum, which are usually strong indicators of the strength or the weakness of a trend.
Regular divergence when applied in this manner but in reverse, will allow traders to enter or exit trades when risk is minimized as the trend is showing signs of weakness. Hidden divergence acts in the opposite sense to that – it confirms the trend so that any short-sighted corrections are unlikely to change the direction.
But it is necessary to remember that, despite its advantages, divergence is not the only indicator and it is strong when used together with other indicators and tools, such as integration with support and resistance, trend or moving averages, and even volume analysis.
All these factors ensure that false signals are avoided and the market as well as the many reversals that can potentially occur in the circuits gain clarity. For this reason, divergence can be called an analysis for traders which allows for more accurate interpretation of price movements and changes, both in the time frames of continuity and of reversal patterns.
- REGULAR DIVERGENCE:
Regular divergence is a more common type of divergence which depicts the potential reversal of the current trend. It occurs when the price of an asset heads one direction and such a momentum indicator as the RSI1 or the MACD indicator moves in the opposite direction. In reasonable bullish divergence the price makes a lower low, whereas an indicator displays a higher low.
Such difference between the price change and the change in the indicator suggests that selling pressure is fading out even though the price further goes down which might suggest higher prices soon. On the contrary, regular bearish divergence does occur when a price creates a higher high, an indicator creates a lower high.
This situation suggests that the buying momentum is decreasing although the price is heading even higher which may suggest further lows are around the corner.
Regular divergence can also enable the traders who have to trade at specific turning points of a particular trend to have an early information that such trend is likely getting exhausted.
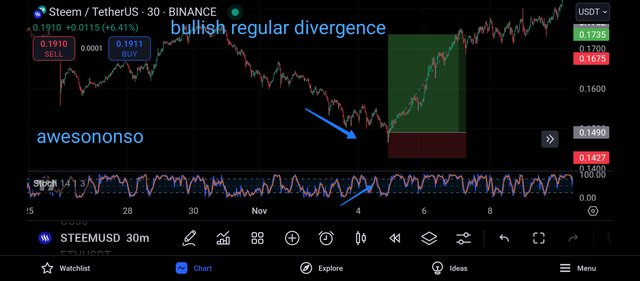
Regular divergence does exist regularly across various time frames, but it is usually regarded as reliable especially over longer time frames such as daily or weekly charts which demonstrates important change of the market’s direction.
The effectiveness of regular divergence as a reversal signal is further magnified when located close to significant support or resistance levels, to affirm the probability of a trend reversal. For instance, when regular bullish divergence develops around an important support level, it implies that the downward trend may be about to end since sellers are slowly losing the aggressiveness to push down the price.
The same can be said about regular bearish divergence where reasonable proximity to a resistance level can offer a strong signal that up trended is about to reverse as buying strength abates.
Traders can increase the reliability of the signals given by regular divergence by applying it to support and resistance levels when entering or exiting positions in anticipation of a trend reversal.
Still, regular divergence has its fair share of challenges. One issue is the fact that regular divergence does not give any specific time for the reversal to occur since the divergence signals can sometimes precede the trend reversal.
This uncertainty in time makes traders at risk of making early entries where they follow divergence for direction but do not look for additional confirmation.
For example, in a situation where there is a bullish regular divergence, the price of the stock may have continued to fall for a while even after the divergences have been formed, hence losses may be incurred if traders go in too early.
To enhance the efficiency of regular divergence, traders often search for related words in many other technical studies or in price action patterns and other indicators like moving average crossovers, candlesticks doji or hammer patterns, volume spikes which can give better reversals.
With these extra confirmations first, traders are able to prevent themselves from entering the trades too soon and consequently, lowers potential risks and enhances the effectiveness of their trading strategies.
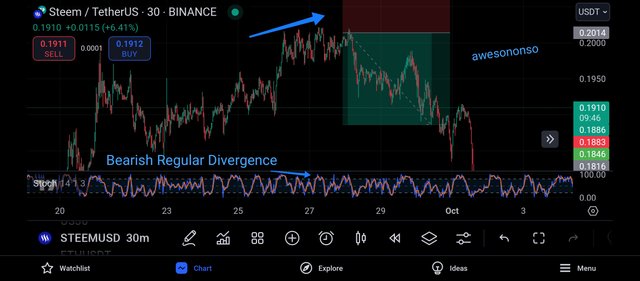
To conclude, regular divergence prove to be a good predictor of an impending trend reversal, thus enabling the traders to position themselves pending such a potentially magnitudinous market swing. It can help or protect the traders from losses especially in cases when, they enter the market near important support or resistance levels and its tells provide them with preemptive warning signs.
One must remember though, that regular divergence itself is never able to initiate a trend shift, nor do the regular divergences always have to be correctly aligned with the MoM momentum – they can appear randomly with no changes in trends following them, therefore other tools must be used in conjunction with it.
Putting this knowledge into practice, disciplined traders stand a better chance leveraging regular divergence to dictate alopolitique strikes, when to enter or exit a trade, whilst reducing their risk exposure to a change in the trend.
- HIDDEN DIVERGENCE:
Unlike regular divergence, hidden divergence usually indicates the probability of a continuation rather than a reversal. It occurs when a price and a momentum indicator diverge suggesting a possibility of the current trend continuing after a slight pullback or a slight rally. In a bullish hidden divergence for instance, price creates a higher low while the indicator creates a lower low.
This looks to mean that the recent price drop is just a correction which in fact has room for growth and therefore the price is likely to increase. Conversely, bearish hidden divergence emerges when the price achieves a lower high while the indicator achieves a higher high which implies the latest wheeling is weak and the fall will recover.
In this regard, Hidden divergence helps to ease the tension of trend-following traders and thus confirms to them that just like sticking to the trend rather than against it, is a good idea.
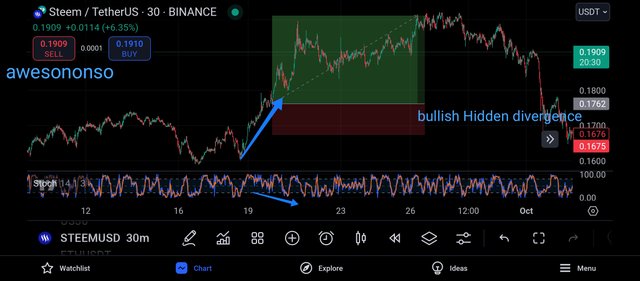
In a trending market, hidden divergence is particularly valuable, as it allows traders to find chances to re-enter or add to a position without waiting for a complete reversal.
For instance, in an uptrend, minor price retracements can be used to look for hidden bullish divergence which means that the overall uptrend is still active and conditions are ripe for buying or adding to long positions.
In a similar manner, in a downtrend, minor price advances can be used to confirm hidden bearish divergence which indicates that there is still adequate selling pressure and provides entry or add-on points for traders using short positions.
Even in the presence of counter trend attacks, hidden divergence allows traders to implement trend continuation tactics and smooth joins all without falling into the traps of many overbought and over-sold conditions in both upward or downward trends.
Traders who have grasped the concept of hidden divergence benefit in one major way - they do not exit a trend that has been consistently profitable due to the presence of temporary fluctuations.
In most cases a trend will undergo some oscillations and corrections along its course, making the trader question and even close their trades if they see a pullback assuming it to be the start of a new trend against the existing one.
Nevertheless, hidden divergence comforts the trades in a way that such corrections are only short-term trends within the primary trend. In this way, if a trader observes hidden bullish divergence during the period of an uptrend, it would mean that the uptrend still has enough strength and helps the trader avoid closing the trade position earlier than it was necessary.
Those who implement the aforementioned methods stand to benefit the most since it is important for a swing trader or a position trader to last within the scope of the trend for a reasonable period in order to maximize the profit potential.
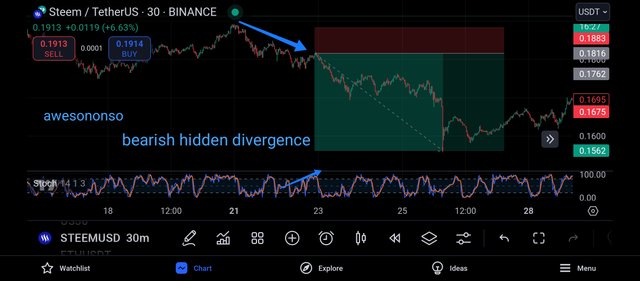
To sum up the views, it would be worthwhile to mention that hidden divergence is a useful tool
to use when confirming that a trend will continue. It keeps traders on the right side of the market, even when the price pulls back.
For instance, if there is a hidden divergence, it means that there are still active forces at play for the trend and the trader can either enter or add to their existing position which is inline with the trend.
This not only helps a trader but helps them to catch more waves in the market. Like any other type of divergence, hidden divergence should never be used in isolation, and other indicators like moving averages, or volume, should be taken into consideration to enhance its accuracy and the wrong signals provided.
All in all, in today’s world, hidden divergence presents opportunities for traders on the wrong side of a trend to be able to manage it better and prevent themselves getting on a chasing opportunity that’s almost impossible.
In trading, the bullish regular divergence is very useful because it indicates possible future reversals and helps traders who wish to profit from reversals of price action. Divergence exists when price movements in the market move in a certain direction while the price indicator, for example, an RSI and MACD moves in the opposite direction .
For example, if there was a high of the price above previous prices with the momentum indicator not supplying a new high, this should show that there is a waning buying power while the price itself is going up and it is hinting a reverse change.
This kind of divergence is valuable for traders in the sense that they are informed about the weakening of the trends, so, they are more prepared for the price reversals before they are able to see it on the price chart.
Regular divergence is most helpful in predicting trends that can lead to potential exhaustion and give signs to traders that this can be a good time to enter the market or leave the current one.
Since traders look to buy at wholesale prices and sell at premium prices, regular divergence is helpful in determining potential reversals even before they occur. This kind of advance information is critical for early vultures; it allows them to operate better than the rest of the players on the field.
Traders who are able to foresee regular divergence events before the trend reverses will be able to maximize their profits when they buy into the position at more advantageous times. There are specific instances for traders such as when they identify a bullish divergence and the price of assets in a certain trend pushes the trader to seek such opportunities.
For instance, a trader may observe a regular bearish divergence characteristics during the downtrend where price may drop lower than previously anticipated but the indicator shows an increasing amount of pressure. This indicates that possible stopper selling activity may be experienced therefore creating a good buying opportunity. It is very favorable for traders as it enables them to capture price movements.
Not only does regular divergence assist in identifying entry points, but it also comes in handy regarding managing risk and exit strategies. Usually, when traders have already entered a trend and later observe regular divergence forming, it should indicate a trend that is about to run out of steam.
It is likely that they will withdraw or cut their positions in order to protect profits. Let us take a situation where a trader has taken a long position and sees regular bearish divergence forming. The price reaches a higher high, but the oscillator price reaches a lower high, hence suggesting that the buying momentum is decreasing and a reversal is impending.
The trader is able to receive his profits since he managed to listen to the regular divergence signal, which would have otherwise dropped if the trader had not employed the divergence criteria.
This means that the trader is able to avoid losses since the trend has already reverted back to his opposition. In this manner, regular divergence gives the trader purchasing power and the ability to manage their trades in progress and focuses on managing exposure in almost perfect fashion.
Regular divergence, however, has its drawbacks. For example, divergence signals are sometimes given too early, sometimes days or even weeks before the potential trend change occurs. Therefore, if a trader relies only on a divergence for a trading decision, there may be a considerable risk of a false signal.
To mitigate this problem, many of them use regular divergence in conjunction with other techniques such as moving average crossovers or certain candlestick patterns to confirm the reversal of the trend before initiating their trades. With additional proof of a reversal, traders are able to avoid the danger of getting in too early, or being fooled by brief movements against the trend.
As a final point, although regular divergence is particularly important in the context of seeking out likely future reversals, there is a clear sense in which it is also advisable to incorporate other tools in order to provide additional confirmation.
This technique permits them to apply regular divergence effectively while diminishing the likelihood of backlash from early signals.
In contrast to regular divergence, hidden divergence supports trend continuation and provides the advantage that the current trend will not be adversely affected in the near term. There is, however, a need to underscore that it is possible to simultaneously have both price and momentum indicator move in opposite directions within and reinforce the strength of the trend.
For example, in an uptrend, hidden bullish divergence occurs when the price reaches a new low but the indicator makes a higher low. The pattern indicates, therefore, that the past bearish move is only temporary as the uptrend is relatively strong, making a return to the upward move likely.
All trend-followers are worried about the reversals of price exits, where they have negative consequences on positions because hidden divergence helps increase the duration of trend movements.
Since the trend is now always assured of having more space to run, it has makes it more favorable for trend-following strategies as they desired capturing all profits.
As they look for possible trends, traders can use hidden divergence to confirm and validate how strong the trend is so that they can take further action. It is a general feature of any trending market that the price would make weak retracements or counter trend activities every once in a while, creating a lot of uncertainty regarding the strength of the trend.
For traders, however, hidden divergence helps solve this problem by reinforcing the fact that the momentum in the present trend is sufficient to sustain it. For example, if the trend is down, and a trader notices hidden bearish divergence—in which the price goes down forming a new high while the indicator reaches a lower high—
It becomes a clear signal that the trend is under weakness, hence the downtrend would re-establish itself in no time. This type of understanding helps the trader to remain in the short trade and prevent himself from loss of any kind and in case he feels like adding more units will drive in more profit, he can do so as the trend is still strong.
As such, hidden divergence helps traders in holding the positions to coincide with the direction of the trend and towards the larger time frames to take advantage of the trend.
Hidden divergence is a key component in managing premature exits on trends, a persistent probelm for trend-followers. Trends undergo smoothening phases resulting in corrections and consolidations which create apprehension of trend weakening.
This issue is resolved by hidden divergence since it assures the trader that the trend is maintained but has moved away from price temporarily. For instance, during an upward trend, if a trader is long and observes a hidden bullish divergence, it naturally follows that such a divergence indicates a recent decline to be merely a correction, not a reversal.
As hidden divergence is confirmed, traders do not have to make losses by cutting a winning trend early, this also gives room for a longer holding period and larger returns if applicable. This confidence to remain in the trend is especially important for swing and position traders who aim at timed large shifts in the market and avoid getting blown by the short term noise.
In the same manner as regular divergence, hidden divergence should not be used alone rather it should be used with other technical indicators and tools for its most optimum efficacy.
Though hidden divergence is reliable in finding trend continuation it is not without its weaknesses, it may provide a few false signals especially during choppy bad market or where re-tracements could be more visible. To cope with this, most traders combine hidden divergence with other indicators or analysis such as moving averages, volumes or support and resistance levels to ascertain their analysis.
For instance, a hidden divergence with a moving average that has a negative slope in accordance with the trend will suggest that the trend will continue. By combining other tools with hidden divergence, traders enhance the strength of their trading strategy.
This makes it easy to determine what are the real continuation signals and what signals are just noise generated by the market. Therefore a hidden divergence is a powerful weapon to target trend-following strategies giving the trader more power to stay in accord with the trend and take more profits.
Question 2: Identifying Divergence with the RSI or MACD
In this section, we are required to identify divergence on the price chart and the only way I can do this is by applying the rsi to the price chart.
And to begin this, I visited the trading view app on my device and I immediately moved to the pair STEEMUSDT as my analysis is meant to be done on this pair.
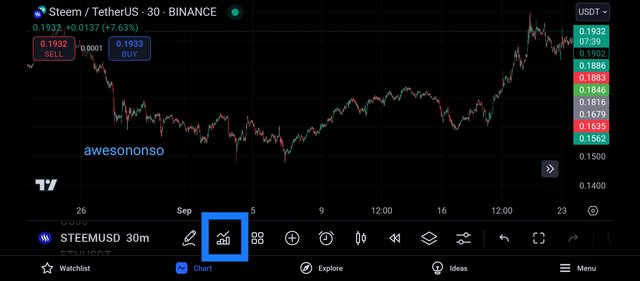
Moving to the trading view app, I decided to click on the indicator icon, as this icon is one responsible for all indicators found on the trading view app.
And clicking on this, the below appeared and I proceeded in applying the rsi to the price chart.
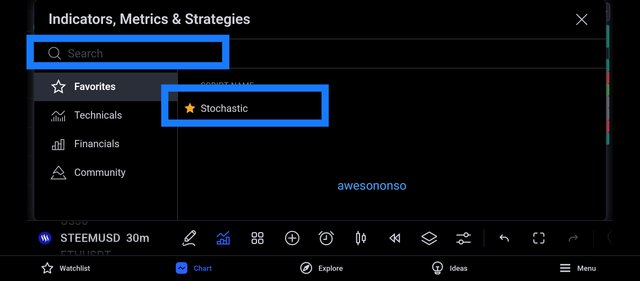
As seen above, I marked two areas, the one on top is used to search for the indicator that the trader intend to use.
And since I want to apply the rsi to the price chart, I proceeded to click on the rsi indicator and the below appeared.
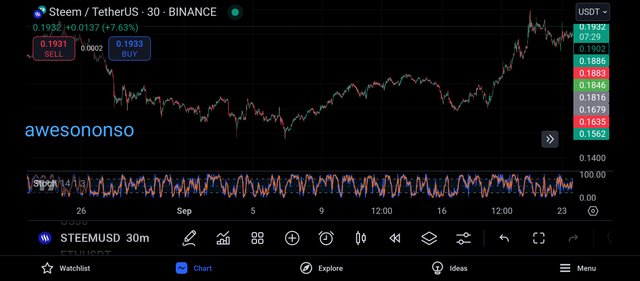
And from the image above we can see the rsi applied to the price chart, and then I can proceed to search for the divergence in trading and before that, I decided to check on the setting of the indicator.
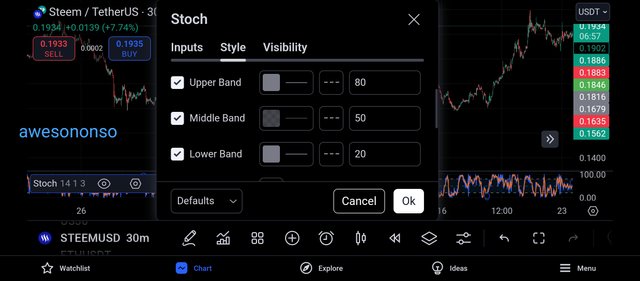
From the above screenshot, we can see that the rsi indicator is made of 3 parts, it is made of the upper band, the middle band and the lower band.
On a normal scenerio searching for overbought and oversold regions, the market is understood to be in an overbought region when it trades about the upperband and it is understood to be in an oversold region when it trades below the lower band.
The upperband of the indicator is placed on its 80% region as seen above and the middle band is placed on its 50% whereas the lower band is placed on its 20% percent, just as seen above.
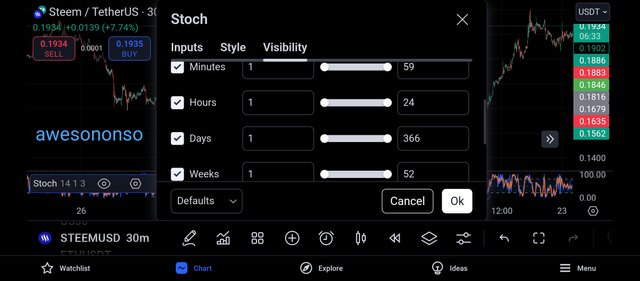
And going to the visibility feature, we can see that the rsi indicator is made visible on several timeframe, we can see that it is visible on the hourly, daily and the weekly timeframe.
This implies that when we move to these timeframe, we would be able to make use of the rsi indicator to carryout analysis.
Having successfully applied the rsi to the price chart, let's proceed to the identification of a bullish and bearish divergence of the market.
The bullish Divergence can be explained to be a trading technique that works with the use of both the rsi indicator and the candlestick in the prediction of the market price.
A bullish divergence is a trading signal that shows that the market is about to embark on or continue creating new highs, that is, the buyers in the market are becoming more strengthened than the sellers.
Whenever a bullish divergence is spotted on the price chart, it is usually accompanied by the formation of several bullish candles which indicates the presence of the buying pressure in the market.
The bullish divergence can be classified into 2, and we have the regular bullish divergence and the hidden bullish divergence.
- REGULAR BULLISH DIVERGENCE:
The regular bullish divergence is a special type of bullish divergence in the price chart that shows the strength of the bulls in the market.
In this form of bullish divergence, the market is usually in a bearish move prior to the formation of this trading signal.
For regular bullish divergence to occur, the price chart would create a new low in the market while the indicator will create a new high in the market, just as seen below.

The screenshot above shows a perfect example of a regular bullish divergence, and as seen from the price chart, the market created a new low while the rsi failed to create a new low but rather created a new high.
Ideally, a regular bullish divergence signals a trend reversal of the market, a bullish trend reversal to be precise, and this shows the weakness of the bears in driving the price lower and the strength of the bulls in driving the price upwards.
- HIDDEN BULLISH DIVERGENCE:
The hidden bullish divergence is another type of bullish divergence as its role is to indicate the strength of the buyers in the market.
The difference between the regular bullish divergence and the hidden bullish divergence is that the regular bullish divergence signals a bullish trend reversal while the hidden bullish divergence signals a bullish trend continuation of the price chart.
For an hidden bullish divergence to occur, the price chart will have to create new highs showing a bullish continuation while the rsi indicator will fail to create a new high but rather create a new low.

The screenshot above is a good example of an hidden bullish divergence of the price chart.
As seen above, the market has began it's bullish move already by creating new highs but the rsi indicator failed to create a new high but rather created a new low in the price chart.
An hidden bullish divergence is also a very effective trading strategy, as it signals a bullish trend continuation of the market.
The bearish Divergence can be explained to be a trading technique that works with the use of both the rsi indicator and the candlestick in the prediction of the market price.
A bearish divergence is a trading signal that shows that the market is about to embark on or continue creating new lows, that is, the sellers in the market are becoming more strengthened than the buyers.
Whenever a bearish divergence is spotted on the price chart, it is usually accompanied by the formation of several bearish candles which indicates the presence of the selling pressure in the market.
The bearish divergence can be classified into 2, and we have the regular bearish divergence and the hidden bearish divergence.
- REGULAR BEARISH DIVERGENCE:
The regular bearish divergence is a special type of bearish divergence in the price chart that shows the strength of the bears in the market.
In this form of bearish divergence, the market is usually in a bullish move prior to the formation of this trading signal.
For regular bearish divergence to occur, the price chart would create a new high in the market while the indicator will create a new low in the market, just as seen below.

The screenshot above shows a perfect example of a regular bearish divergence, and as seen from the price chart, the market created a new high while the rsi failed to create a new high but rather created a new low.
Ideally, a regular bearish divergence signals a trend reversal of the market, a bearish trend reversal to be precise, and this shows the weakness of the bulls in driving the price higher and the strength of the bears in driving the price downwards.
- HIDDEN BEARISH DIVERGENCE:
The hidden bearish divergence is another type of bearish divergence as its role is to indicate the strength of the sellers in the market.
The difference between the regular bearish divergence and the hidden bearish divergence is that the regular bearish divergence signals a bearish trend reversal while the hidden bearish divergence signals a bearish trend continuation of the price chart.
For an hidden bearish divergence to occur, the price chart will have to create new lows showing a bearish continuation while the rsi indicator will fail to create a new low but rather create a new high.

The screenshot above is a good example of an hidden bearish divergence of the price chart.
As seen above, the market has began it's bearish move already by creating new lows but the rsi indicator failed to create a new low but rather created a new high in the price chart.
An hidden bullish divergence is also a very effective trading strategy, as it signals a bearish trend continuation of the market.
Inorder to make use of the MACD indicator in identifying divergence, I decided to add the MACD indicator on the price chart, following the process below.
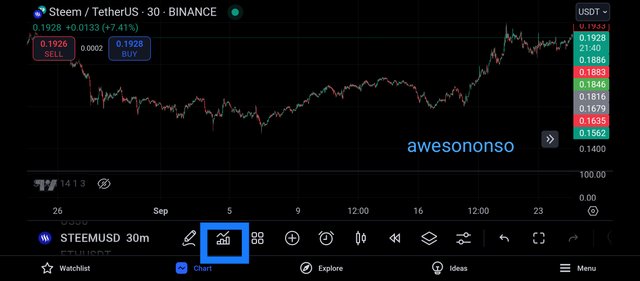
I moved to my trading view app as shown above and I clicked on the icon for applying indicator on the price chart, and the below image was displayed.
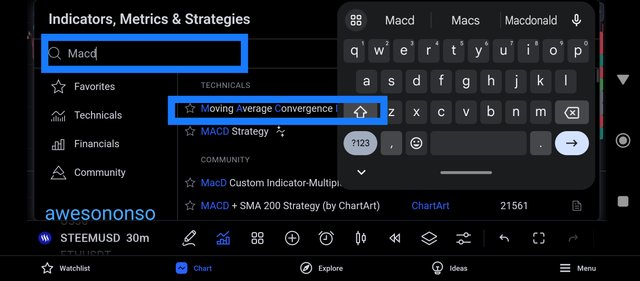
After which I moved to the search button to search for the indicator of my choice and since I was searching for the MACD indicator, I type macd on the search box and two types of macd indicator appeared.
And then I clicked on the MACD I intend to make use of and it was applied to the price chart as seen below.
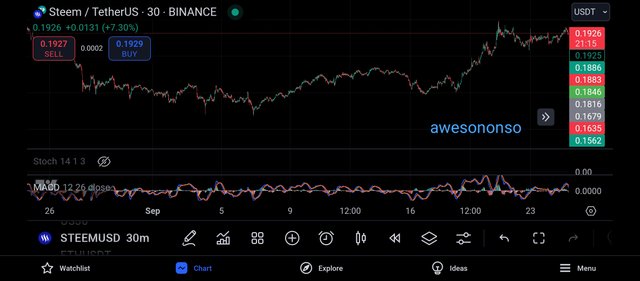
And then, I decided to search for the properties of the MACD indicator as this will help us understand it's component and how it operates.
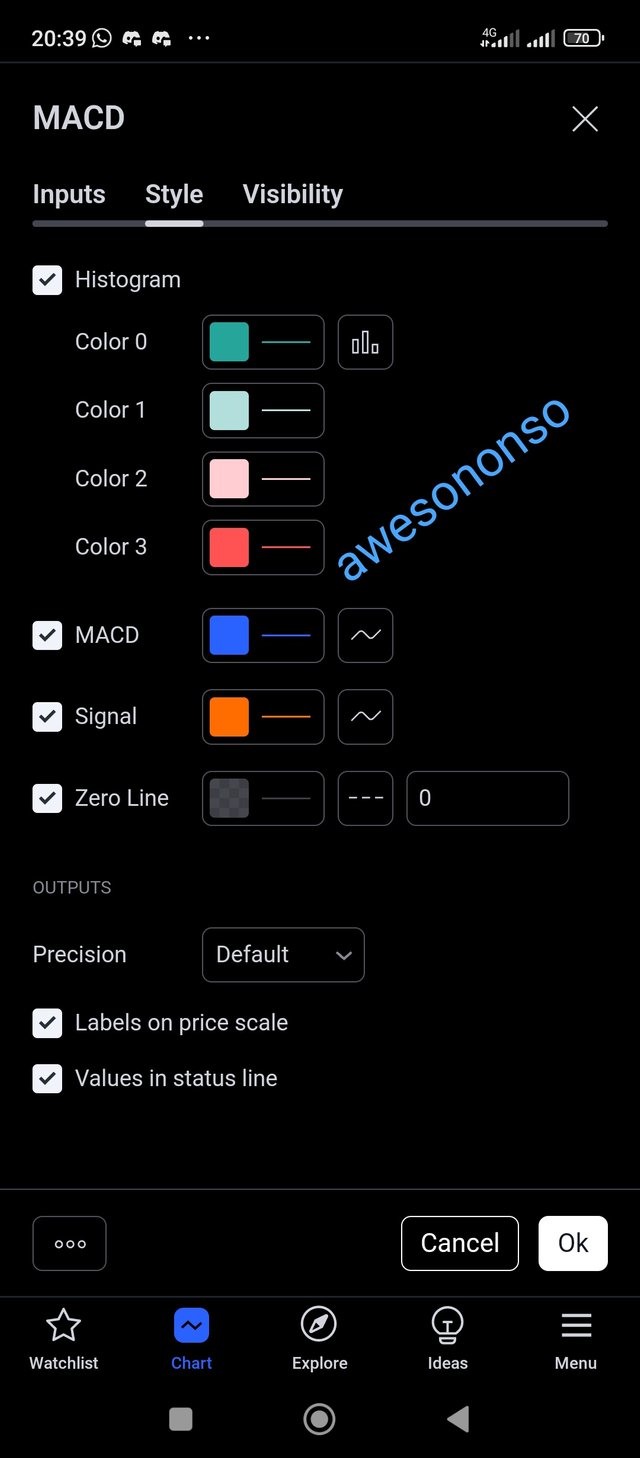
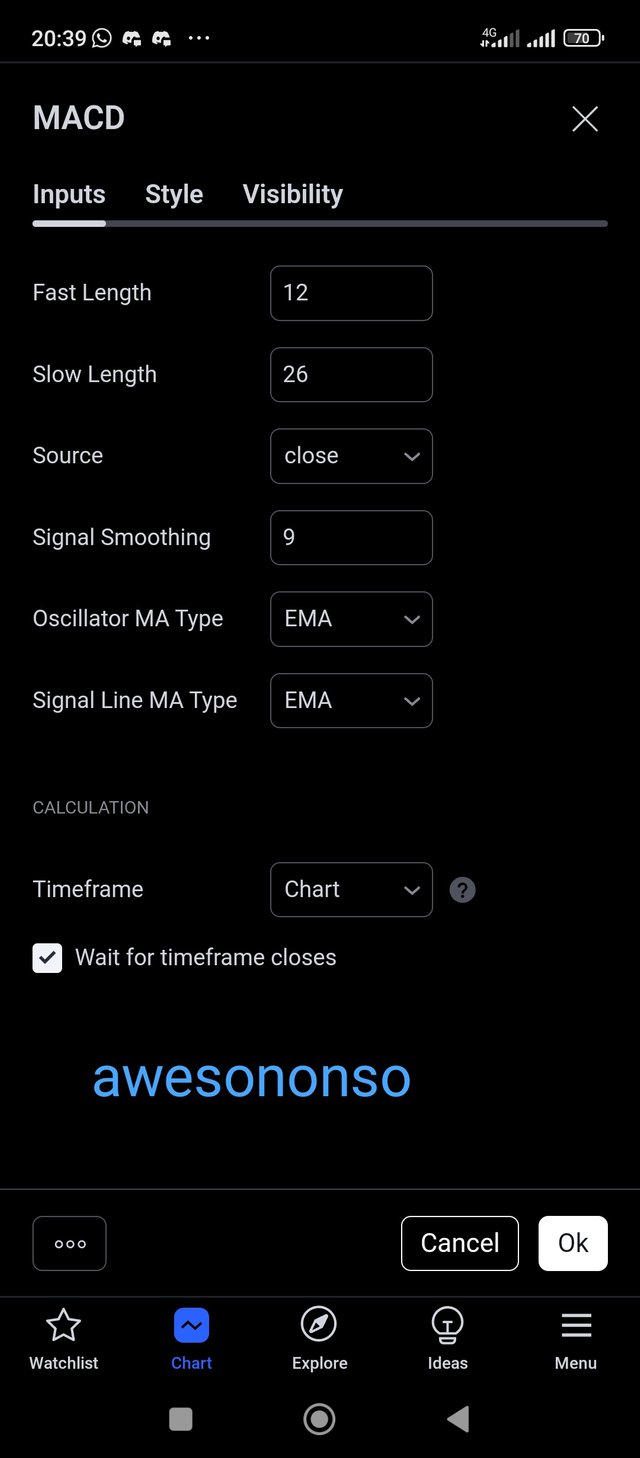
The full meaning of the MACD indicator is Moving Average Convergence Divergence and from the Above screenshot we can see the property of the MACD indicator.
On the left hand side which contains the input side of the MACD shows so many properties of the MACD.
We can see that the oscillator and signal line of the MACD indicator is nothing other than an exponential moving average, and also, the fast length of the indicator is 12 while it's slow length is 26.
And on the right hand side, we can see the difference kind of colour in the MACD indicator and they can always be adjusted to our preference.
The different types of divergence has been earlier explained, and here I will just be showing examples on the price chart.
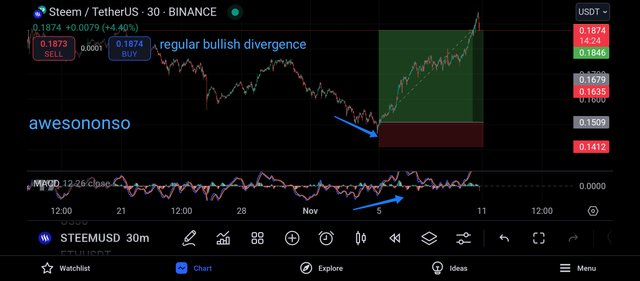
The above screenshot is that of a regular bullish divergence, and as earlier explained, it is signals a bullish trend reversal of the market.
From the screenshot above, we can see that the market created a new low whereas the MACD failed to create a new low but rather created a new high, which signals a divergence in trading.
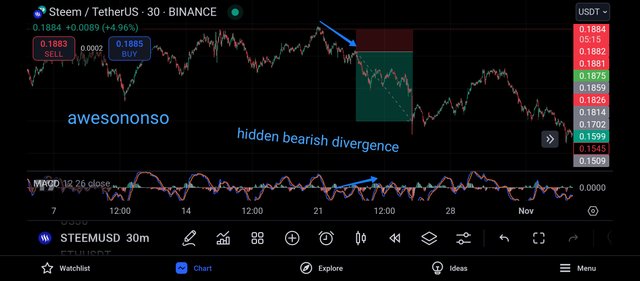
The above screenshot shows a hidden bearish divergence of the price chart.
From the above screenshot, we can see that the market had failed to create a new high, and has been creating several lows and the MACD indicator on the other hand failed to create a new low, but rather created a new high.
Explained above are ways to identify divergence using the MACD indicator.
Ideally, with the use of divergence in trading, there are basically two things we watch out for and they are the trend reversal and trend continuation, and I will be explaining them now.
- DIVERGENCE TREND CONTINUATION:

A trend continuation in the market can be understood to mean the continuous movement of the price chart in its present trend.
For example, if the market is in a bearish trend, a trend continuation will mean that the market continues creating new lows.
Divergence plays a very huge role in identifying trend continuation and this form of divergence is known to be a hidden divergence.
From the screenshot above, we can see how divergence played a huge role in identifying a trend continuation.
- TREND REVERSAL:
Trend reversal as the name implies refers to the change in the market current trend.
For example, if the market is currently in a bullish trend, a trend reversal will mean the change of that market trend from bullish to bearish.

The screenshot above shows a nice example of a trend reversal in the market, and we can see how this was identified using Divergence trading.
Divergence trading is very important in identifying trend reversal and trend continuation in the market.
Question 3: Combining Divergence with Other Indicators
Additionally, combining divergence with other technical indicators like the moving average, Bollinger Bands and volume analysis makes it easier to verify the signals and avoid false positives which creates a more effective strategy.
Divergence only, however useful, could at times be conceivably or prematurely even, misleading in the short run upon the occurrence of such volatility where price movements dominate momentum indicators. For instance, the amount of a trader’s analysis will be strengthened when a divergence forms while other indicators assists to ascertain whether the divergence formed is in the general direction of the main trends in the market.
As an illustration, it is common to use a moving average and divergence at the same time. For instance, a trader could be looking for regular bullish divergence where the price forms lower low but the indicator lower low, further supporting this assumption, when the price crosses over the 50 or 200 MA can suggest a bullish reversal accompanied by the divergence displayed.
Such a placement of indicators causes the trader’s confidence level that the price trends are about to change increases as the signals become more reliable due to confirming indicators. Such parameters of analysis shall ensure that traders are able to enter and exit tight positions as soon as possible thus limiting the opportunities for false trades or even early sign trades.
Bollinger Bands are yet another useful tool worth combining with divergence as they put into context how aggressive the price has been, enabling traders to suggest zones of extension and reversal. Furthermore, when the price is moving toward the upper or lower Bollinger Band, the existence of divergence around that area serves to confirm the signal as it suggests that the price is near its peak/bottom.
For instance, if a trader sees bearish divergence when the price hits the upper Bollinger Band, it suggests that the price is highly oversold and likely to go on a downward trend. Therefore, the use of Bollinger Bands and divergence can help improve trades by pinpointing the time when prices touch extreme levels and are likely to pull back due increase supply.
Similarly, when bullish divergence appears near the lower band, it may suggest that this retracement is not powerful enough to change the trend and more upward price movement may happen. Finally, with the input of divergence in the Bolligner Bands, the traders are able to look at the price action of the asset along with the volatility to time the trades better.
Volume analysis may also improve divergence based strategies as it demonstrates the power behind price. Divergence signals are always more stronger when volume is present. For example, regular divergence and volume show the capability of price increase along with the reversal signal.
If volume is decreasing while a regular divergence is forming, then it is expected that there are lower chances of reversal to the upside and it will imply lesser demand. In the same manner, hidden divergence and volume together can help in the determining the probabilities of trend continuation.
It can be observed in an uptrend, if a pullback on low volume occurs during a contentious period, this suggesting that the trend will proceed in the same direction as all other indicators suggest. Incorporating volume with divergence gives an indication on the strength of the price movements and enables greater measures in understanding divergence signals and minimize false trades.
Employing several technical indicators along with divergence creates a good trading strategy since it allows the traders to look at market trends in different aspects and improve the depth of their analysis. While utilizing divergence in conjunction with other indicators such as moving averages, Bollinger Bands, and volume, traders increase their chances to see the high-probability setups and refrain from reacting on glimmers of false signals.
Differently, moving averages serve to point trend direction, Bollinger Bands serve to needs of volatility while volume serves as the knife of the market strength. Along with divergence, these tools form a coordinated trading strategy that provides multiple layers of confirmation.
For example, if a trader spots regular bullish divergence, he may wait for the price to make an attempt to swipe over a moving average and close into the lower band while keeping watch of the volume and suspecting that the probability for a long lasting uptrend becomes stronger.
Such a strategy also protects the traders from being overly dependent on a single indicator as clear cut entry and exit points become apparent since several factors are combined.
Inorder to carry out this section with the needed screenshots, I will be making use of the ichimoku cloud indicator.
The ichimoku cloud indicator has 4parts the base line, the conversion line, the leading span A and the lagging span.
The base line and the conversion line play very important roles in identifying key support and resistance level on the price chart and I will be making use of this, and to do so, I applied the ichimoku cloud indicator to the price chart.
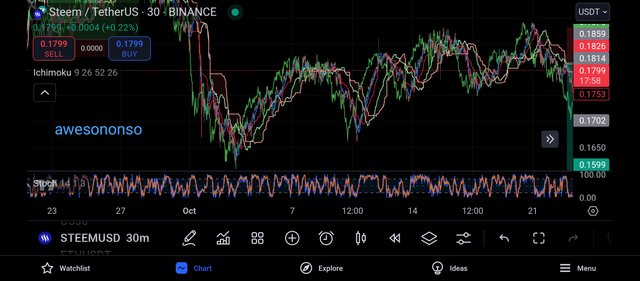
From the above screenshot, we can see that I have added the ichimoku cloud indicator to the price chart, but this indicator is looking noisy in the price chart and as such, I decided to minimise the noise by removing some parts of the indicator.
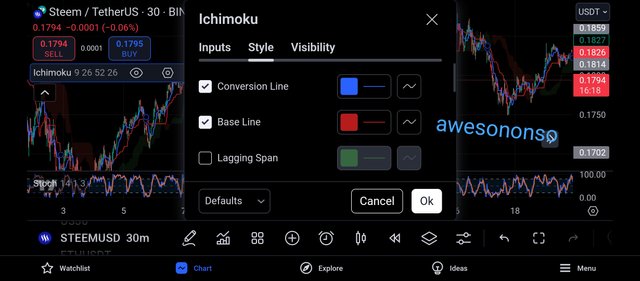
And moving to the settings, I removed the leading span A and the lagging span off the chart and I was left with the base line and the conversion line.
The baseline is the indicator with the colour red and the conversion line is the indicator with the colour blue, just as seen above.
Now the chart is easier to understand since I will be using the baseline and the conversion line as my support level and resistance level.
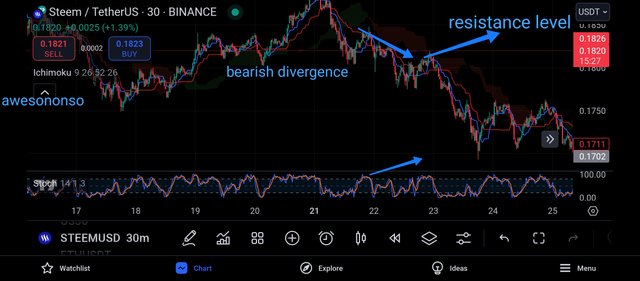
The above screenshot is one showing the formation of a bearish divergence on the price chart.
From the above screenshot, we can notice the divergence between the price chart and the rsi indicator which is not new to us.
And looking carefully, we would also realise that the market has traded toward the resistance level of the ichimoku cloud indicator, and as such, we can expect to see a bearish move in the market.
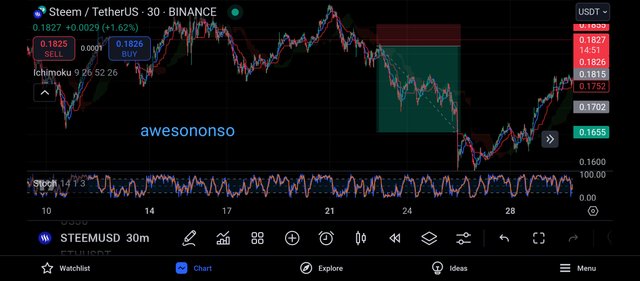
Here, we will notice that both the ichimoku cloud indicator and the divergence gives the same signal which is a bearish signal, and as such, we can refer to this signals as a confluence.
Then I continued my search and I came across a great example signalling a bullish move.
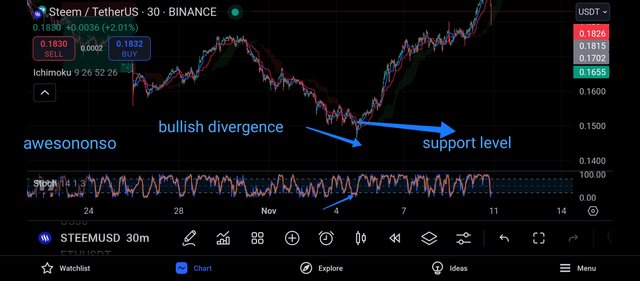
From the screenshot above, we can see the formation of a bullish divergence using the price chart and the rsi indicator.
And then looking carefully, we would realise that the market has traded towards the support level of the ichimoku cloud indicator, and this can be seen to mean a bullish move in the market.
Whenever the market trades towards a support level, it is expected to be rejected to the upside.
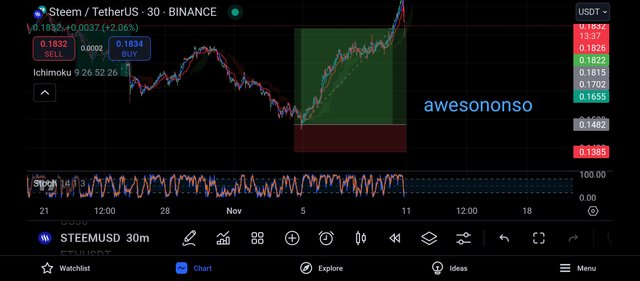
And then I can comfortably place my bullish entry on the market just as seen above.
This is one way in which this ichimoku cloud indicator can be used alongside the divergence of the rsi indicator.
Another very important indicator that can be used alongside divergence trading is the trix indicator.
The trix indicator is a very important indicator that is used to identify overbought and oversold regions in the market, and here, I will be using it as a confluence to my trade.
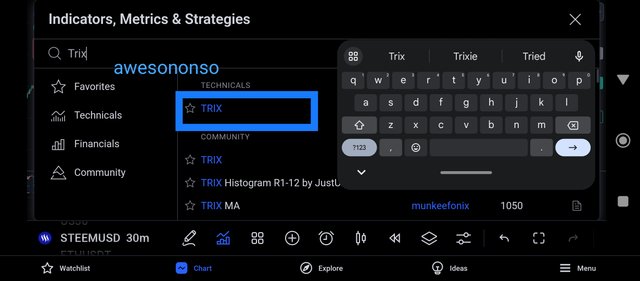
Without wasting much time, I immediately went to my trading view app and added the trix indicator just as seen above.
And then, I decided to use it as a confluence to my trade on STEEMUSDT.
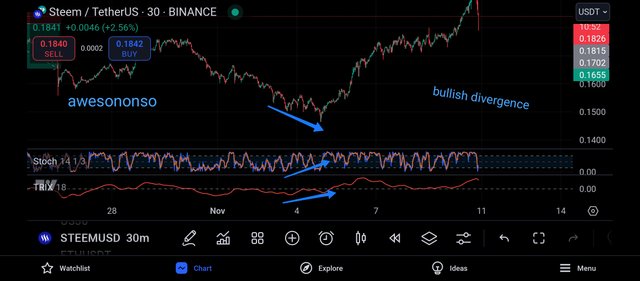
The above screenshot is that of STEEMUSD on the 30min timeframe, and from the screenshot above, we can see the application of the trix indicator alongside the rsi indicator.
And then I was able to identify a bullish divergence of the price chart, and looking carefully, we would see that both the rsi and the trix indicator gave similar signals.
While the price chart formed new lows, the trix indicator and the rsi indicator both failed to form new lows, rather they formed new highs in the market.
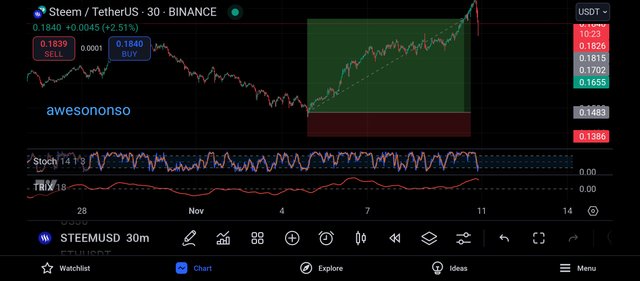
And with that confluence, I can proceed to place my bullish entry on the market..
And going further, I was able to make use of the the trix indicator as a confluence again to my trade, and this time around, I am in search of a bearish signal.
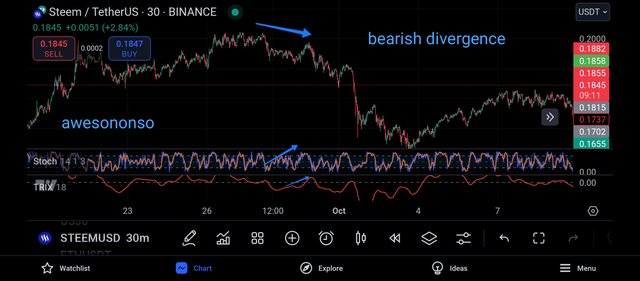
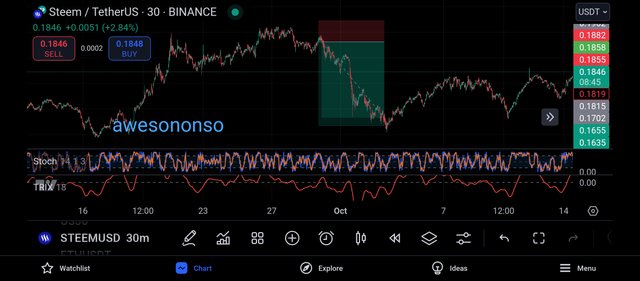
From the screenshot above, we can see the identification of a bearish signal using the divergence trading and the trix indicator.
We can see that the price chart formed new lows but the rsi and the trix indicator failed to form new lows, rather they formed new highs in the market.
And this is an indication of an hidden bearish divergence and as such, I can proceed to place my sell entry on the price chart.
Question 4: Developing a Divergence-Based Trading Strategy
To develop my trading strategy using divergence trading, I will take a lot of things into account and explained below are some of them.
- AVOID USING DIVERGENCE AS A STAND ALONE TOOL:
The first thing I will have at the back of my mind when making use of an rsi for divergence trading is that it is not advisable to make use of rsi as a stand alone tool for technical analysis.
Although, the rsi is a good tool for technical analysis, it should not be used as a stand alone tool as it can be manipulated by the market.
There are some instances when the rsi gives false signals, and as such, having a second analytical tool will help in filtering out this noise from the market.
- AVOID OVER TRADING:
While developing my divergence based trading strategy, I will ensure to avoid what is known to be over trading or revenge trading, I will be willing to accept any loss I encounter in the market and wait for another convenient time to trade.
Since the use of rsi for divergence trading is not 100% reliable, we should always be willing to let go of whatever loss we make in the market or we might be forced to make hasty decisions.
- MAKE THE TREND MY FRIEND:
Another thing I will have in mind is the overall trend of the market which is usually found on the higher timeframe.
The market tends to follow the structure it's creates on the higher timeframe than the structure it creates on the lower timeframe.
By making the trend your friend, you have decided to be profitable in the market, and making the trend your friend means that you do not trade against the market trend.
- THE USE OF MULTIPLE TIMEFRAME:
Topdown Analysis is very important in crypto trading irrespective of your trading strategy or style.
By beginning your analysis on the higher timeframe, you tend to understand the movement of the market, and getting a confluence on these timeframe using the divergence trading will increase my winnings in the market.
Instead of relying on a particular timeframe, it is advisable to carry out your analysis on multiple timeframe and each timeframe has its Overview of the market.
- RISK MANAGEMENT:
The importance of risk management in trading the crypto market cannot be overemphasized, as without proper risk management, a trader will leave his account exposed to several manipulation in the market.
And to manage my risk, I will ensure not to over trade, and I will risk only 10% of my trading capital, and as such, it will take 10 straight losses for me to loose my account.
And I will also ensure that the minimal risk: reward ratio of my trade will be 1:3 and any trade with lesser rewards will be forfeited.
- THE USE OF SUPPORT AND RESISTANCE:
Another strategy I will ensure to make use of is resistance and support strategy, as this will also be used to confluence the signals gotten from the divergence.
When divergence trading is confluenced with support and resistance strategy, it tends to produce more effective results and less risks in the market.
- AVOID THE NEWS:
News often has huge impact on the market and it's analysis, I will ensure to avoid trading the news as the market might go against my analysis at that specific point in time.
It is best to trade the normal trading activities of the market than to trade news as most times trading news without proper analysis can be likened to gambling in the crypto market.
Question 5: Limitations and Best Practices of Divergence Trading
Divergence trading is often applied for its usefulness in reversing trends or continuing them, however it does have its drawbacks which traders should be fully aware of to reduce the common mistakes that that they make.
One of the major disadvantages with this strategy is the high occurrence of false divergence signals especially in volatile or choppy price action where there is no visible directional trend to follow.
There will be divergence usually prior to a reversal, but this does not mean a reversal will come right after the divergence has been noticed. For example, regular bullish divergence may occur during a downtrend, indicating weakening momentum, but the price can and does often fall for a long time in spite of this indication.
This early divergence can cause traders to be too aggressive and open trades before the real trend has started which will only push them to make more losses as trend remains in the opposite direction. In order not to make this mistake, it is advisable to treat the divergence as an indication of a potential trend change and not a trigger.
Additional confirmation can include price breaks outs above resistance or crossovers on a moving average, and this can assist traders in not entering too early, thereby enhancing their trade accuracy.
Divergence trading also has its limits, in that its applicability is quite difficult in trade periods where, for the most part, a divergence type of signal is overshadowed by price momentum.
This is able to occur where there are strong uptrends or downtrends within the market where price movement is correlated with divergence of the momentum indicators from price action movements in the trend. It is not rare for a price that is in an uptrend to reach new highs while a momentum indicator establishes lower highs, signaling a normal bearish divergence.
A divergence does not mean that the trend will shift because it very well may be that the strong buying pressure allows for the uptrend to persist. Reversal of trend is a major expectation that traders hold on to these types of signals and in the end end up cutting their positions far too early.
This can be avoided when traders keep in mind the general context of the market and divergences where reversals are probable as being applicable near support or resistance zones or when a momentum trend begins to wane.
Traders can avoid self-inflicted losses by recognizing a strong trend and understanding that divergence is not meant to be a signal for exiting positions.
The issue of divergence signals as one of the weaknesses often faced is due to the ‘subjective’ nature of identifying divergences.
Divergence constitutes an analysis of price action in relation to an indicator, traders experiencing the same chart will quite often reach different conclusions, Some traders may identify divergence simply because of small changes in prices or movements of the indicator while others will want the divergences to be clearly pronounced.
Quite often, this degree of subjectivity would lead to inconsistencies and mistakes especially for the foreign traders who have just recently started employing analysis of divergences and often look at feeble pull backs as exaggerated divergences.
Also, it is feasible that there are situations in which various indicators yield contradictory information. For example, while an RSI divergence may indicate a reversal, a MACD divergence may fail to confirm it.
In order to prevent unfortunate mistakes in the analysis of the divergence phenomenon, traders should incorporate strict rules regarding the definition of divergence signals for example defining the minimum difference which should be present between the extreme points in price and the indicator in order for a signal to be issued.
To make sure that these signals are reliable the traders should be consistent in their application and since there is less subjectivity there is more accuracy in interpreting divergence signals, making sure that the problems of having different interpretations are eliminated.
To conclude, divergence trading does not work effectively when used as an independent strategy because it does not provide participants with a global understanding of the market, which is paramount for high-probability trades.
If divergence is used in isolation, it may create a fixation with momentum changing and overlook other key elements such as trend direction, volume, and volatility as well. It goes without saying that traders may overtrade or undertrade positions based on divergence without adjusting to these surrounding conditions.
To overcome this drawback, it is necessary for the trader to use divergence as a part of significant trading strategy employing several technical indicators or analysis too. For instance, if a trader uses divergence and moving averages together, the trader may be able to determine whether the present market price is consistent with the growth trend.
Likewise, looking at volume can help validate the actual strength of divergence and its ability to show market activity. When deployed as a component of broader analysis, divergence may assist traders in validating signals within the context of the market’s overall structure and thus obtain better insights and risk the act of being myopic on such signals.
This helps traders use divergence to their advantage in a more sophisticated manner thereby enhancing the precision of their trades while avoiding the drawbacks connected.
CONCLUSION
Divergence trading is a very effective tool used in analysing the crypto market but it should not be used as a standalone tool as it is not 100% reliable.
In this challenge, we have learnt about the types of divergence and how they relate to identifying trend reversal and trend continuation.
Overall this is a very great topic and I appreciate the host of this topic.

.
Downvoting a post can decrease pending rewards and make it less visible. Common reasons:
Submit