

Introduction

Before delving to a particular venture, it is important to learn the basics of the profession and get grounded in them. Trading Cryptocurrencies is not something that is learned in a day and obviously there are very basic concepts and practices every new trader should learn. The clear lesson by professor @nane15 explains a number of these concepts. Following the instructions given, I will attempt the tasks.

1. Explain your understanding of charts, candlesticks, and time frames. (Use your own words and put screenshots)

Charts
A Chart is basically a two-dimensional graphical representation of the vast activities in a particular market scenario. This tool takes the invisible and complicated data of an asset and makes a visual representation of these data in a manner that is easy for traders to understand. Some of these data include volume, historical price, support and resistance levels, current price movement and so on which are drawn against a particular period or in a given timeframe.
Without charts, technical analysis would be very difficult. Charts are the foundation of technical analysis and without the foundation, a structure cannot stand. If there were no charts, the visual data that help traders make rational decisions would not be readily available to them. For one, traders would not be able to know the market psychology and so would not be able to identify price patterns. Other important elements like volume and momentum would not be known and so traders would make more risky decisions.
Thanks to the fact that these charts are available, traders can carefully study them to understand how the markets function and how to take proper advantage of them to make decent profits.
There are different types of charts including Line Chart, Candlestick Chart, Bars Chart, Area Chart, Heikin Ashi and so on. I have given screenshots of the Line and Candlestick Charts.

In the image above, we can see that the price and he volume are drawn with values on the vertical axes against the timeframe which has values on the horizontal axes.

In the image above, the price and momentum are drawn against the timeframe.
Candlestick
The Candlestick chart is the most widely used chart of them all due to the fact that it present enough relevant data to the trader in a simple manner. This chart was developed by a rice trader known as Munehisa Homma and as the name implies, is made up of candles.
A candle has two parts which are the Real Body and the wicks. These parts sufficiently provide data on the psychology of other traders in the market and the asset price behavior. The length of the real body presents the real market bias in terms of the opening and closing prices. The wicks represent the highest and lowest price points that was attained in a given period. I have given an illustration of this below;
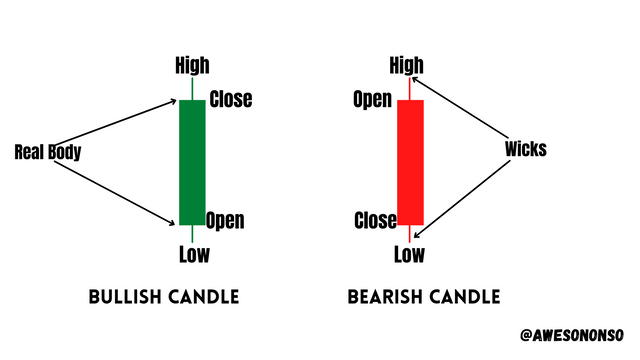
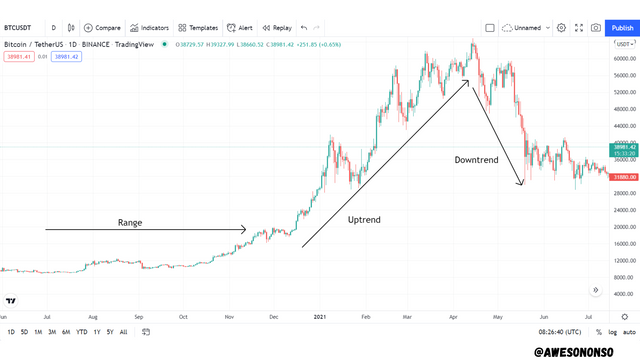
In the image above, I have given two candles which are Bullish and Bearish. A bullish candle is formed when the closing price of the current period is higher than that of the previous period. A bearish candle is formed when the closing price of the current period is lower than that of the previous period. More bullish candles would mean that the market is in an uptrend while more bearish candles would mean a downtrend. An equal composition would mean a range market. I gave illustrations below;
Time Interval
Time interval is simply the period of time represented by a single unit on the chart. For the Candlestick chart, the amount of time it takes for a single candle unit to form is determined by the time interval chosen. For example, a 5-minutes time interval would mean that each candle contains 5-minutes of data. An hourly time interval produces candles on an hourly basis while a daily time interval produces candles on a daily basis.
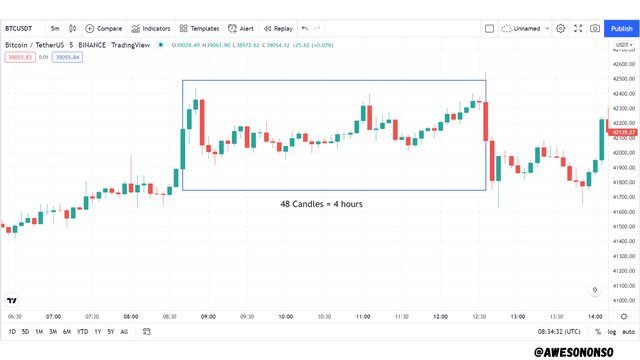
The candlestick chart above has a 5-minutes time interval. Each candle represents 5 minutes of data and so takes 5 minutes to form. The range highlighted contains 48 candles. Since these candles are 5 minutes each, 48 of them would make up 4 hours of data.

2. Explain how to identify support and resistance levels. (Give examples with at least 2 different graphs)

Support Levels
Support levels are areas on the chart where, during a downtrend, the price of the asset tends to struggle. These areas are characterized by high demand or buying pressure which oppose the market's downward movement. At these points, the price would either test the area and reverse or break through.
To identify a support level, we need to find an area where the price of the asset gets to and reverses multiple times (at least twice) during a downtrend. I have shown this below;
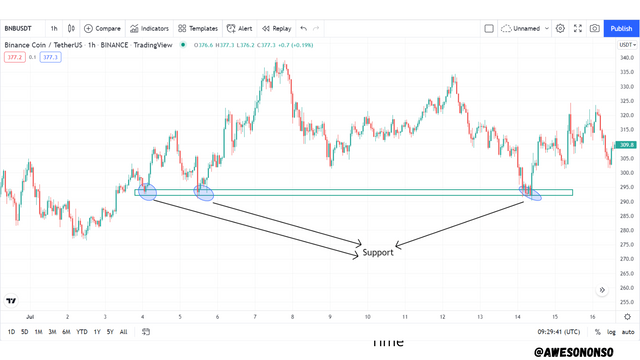
In the image above, we can see that the price of the asset had hit a given area multiple times and reversed. This area can be marked as a support area.
ResistanceLevels
Resistance levels are areas that are highlighted during an uptrend. When the price of the asset gets to these areas, it struggles due to the high amount of supply or selling pressure. The price would either reverse downward at these areas or break through.
To identify a resistance level, we need to highlight an area where the price would normally get to and reverse during an uptrend.
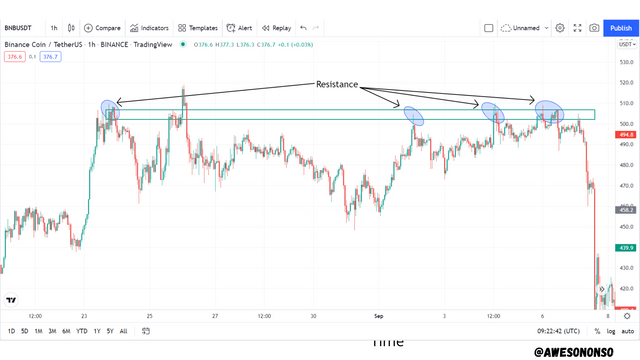
In the image above, I have highlighted multiple times which the asset's price got to the given resistance level and reverses.
Note:
It is important to remember that support and resistance are zones or areas and not just a single price point.

3. Identify Fibonacci retracements, round numbers, high volume, and accumulation and distribution zones. (Each one in a different graph.)

Fibonacci Retracement
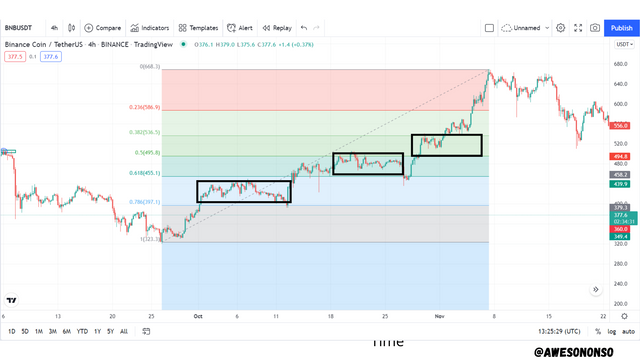
The Fibonacci retracement tool is a trading tool that was developed based on the Fibonacci ratios. These ratios are derived from the Fibonacci sequence. The sequence is obtained by starting with 0 and 1 and then adding the two numbers to give 0 1 1 2 3 5 8 13 21 34 55 89 till infinity. To obtain the ratio, we divide a number with the ones that follow it and we get 0.618, 0.382, 0.236 and 0.786. The ratio of 0.5 is also used because there tends to be some level of tension at the 50% level.
The Fibonacci retracement levels on the chart are drawn by measuring the given rations from a starting point. The levels obtained guide traders to where there could be possible support and resistance zones and help them prepare for retracements.
For an uptrend, we start at the last low to draw the levels. We draw it to the highest point and from the tool we can see possible resistance zones where the price would hit and retrace. I demonstrated this below;
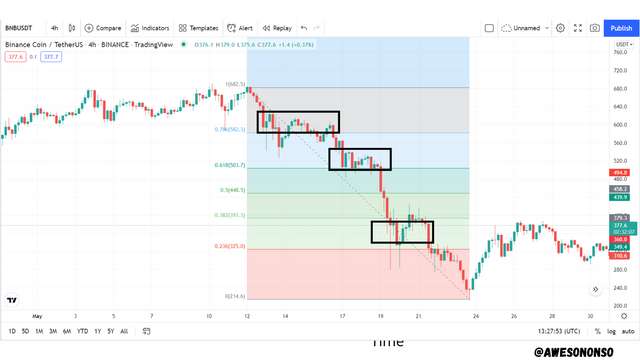
For a downtrend, we start at the latest high and draw the levels up to the lowest point. From there we can see possible support zones where the price could hit and retrace upward.
Round Numbers
Humans normally tend to avoid errors. This behavior is deep rooted in our psyche and affects many aspects of our lives. The use of Rounded numbers in trading is one of these aspects. Many traders depend on rounded numbers as an easy way to identify support and resistance levels. They would prefer rounded values such as 60, 250, 400, etc. to values like 54.6, 468.3, etc. because the price would seem much more balanced at these levels. This psychology affects the market when large trades are placed at these levels and we can see the prices react to them. Let's see this below;
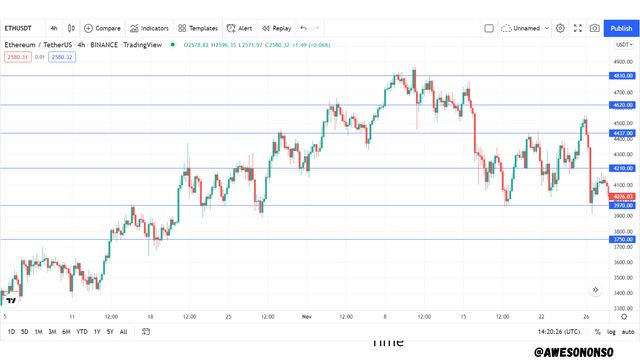
In the screenshot below, we can see that the price of the asset reacted to the various rounded figures highlighted.
High Volume, Accumulation and Distribution
Volume is an important factor to consider when trading because it is the measure of how much money is flowing into or out of a market. This volume factor is very crucial when identifying Accumulation and Distribution phases in the market.
Strong hands in the markets are always at play. During the Accumulation phase, large institutions or whales slowly and gradually buy and asset. By doing this, they pump money into the asset and this can be seen as spikes on the volume indicator.
Similarly, during the distribution phase, the large institutions have made their profit and begin to slowly sell their assets. When they finish, the demand reduces and the price starts to fall. Due to the fact that these large players take out a lot of money from the asset, we see an increase in volume in this phase as well.
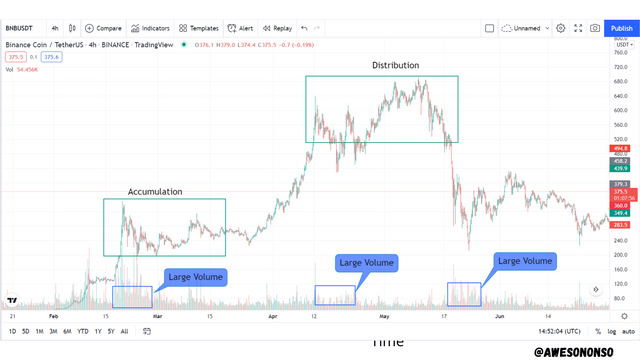
In the image above, we can see that large player gradually accumulated the asset as confirmed by the volume. After they had made their profits, the started to sell the asset gradually and in the end, the price fell back.

4. Explain how to correctly identify a Rebound and a breakout. (Screenshots required.)

When the price of an asset meets a support or resistance level, either a rebound occurs or a breakout occurs. I will explain these below;
Rebound
A rebound is a situation when the price of an asset gets to a resistance or support level and reverses its direction due to high selling or buying pressure at these zones. These rebounds are what make us aware of these zones to begin with. At resistance zones, the price of an asset would pause during its upward movement and reverse downward. At support levels, the price would pause during its downward movement and reverse upward.
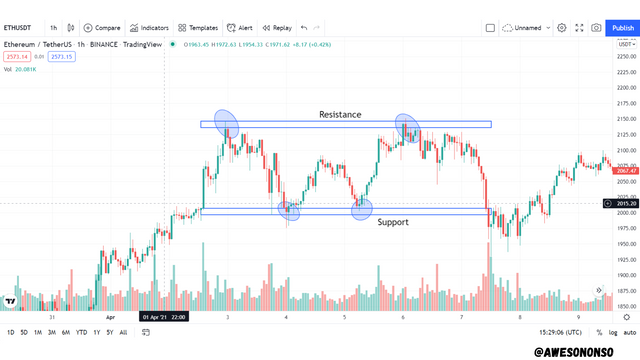
In the image above, we can see how the price of the asset got rejected at the support and resistance levels and got rebounded.
Breakout
A breakout occurs when the price of an asset gets to a resistance or support level and breaks through it. In this case, the support or resistance level does not reject the price rather the price closes below or above these levels. A breakout is associated with considerably higher volumes. When the breakout happens with enough momentum, it is confirmed that the market would continue in that direction and then the broken resistance level becomes a support level and vice versa.
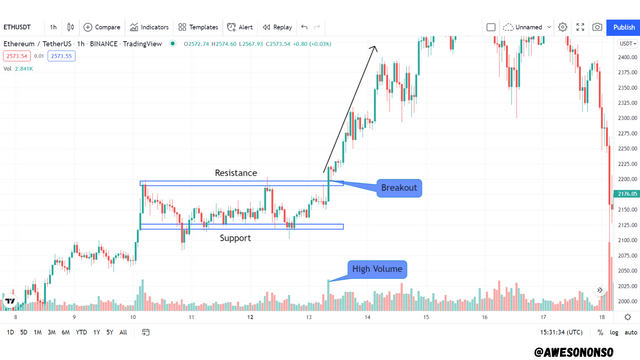
In the image above, we can see that the price had broken through the resistance and closed above it. There was enough momentum and so the trend continued causing the resistance to become a support level.

5. Explain what a false breakout is. (Screenshots required.)

A false breakout is simply a presumed breakout situation that fails in the end. It happens when the price of an asset closes above a resistance or below a support and returns to the range it previously was. This trading trap happens when there is not enough momentum for the trend to continue. Because of this, the pre-existing buying pressure at support or selling pressure at resistance acts on the price and pushes it back in the range.
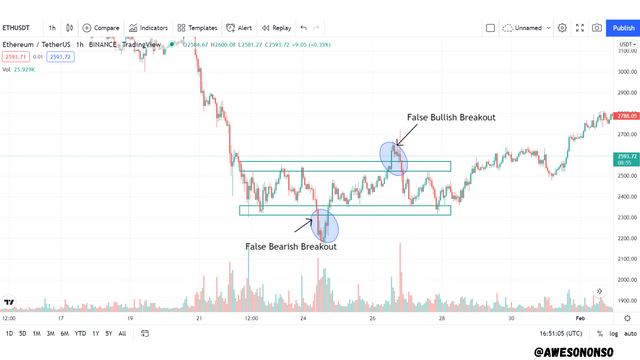
In the image above, we can see the point where the price of the asset closed above the resistance for a presumed breakout but returned back to the previous range. That situation is a false bullish breakout. The situation of a false bearish breakout is also given in the image.

6. Explain your understanding of trend trading following the laws of supply and demand. Also explains how to place entry and exit orders following the laws of supply and demand. (Use at least one of the methods explained.)(Screenshots required.)

Trend Trading following the laws of supply and demand
The law of demand and supply says that the higher the demand of an commodity when there is low or limited supply, the higher the price of that commodity. Conversely, when there is low demand for a commodity and excess supply, the price of that commodity will fall.
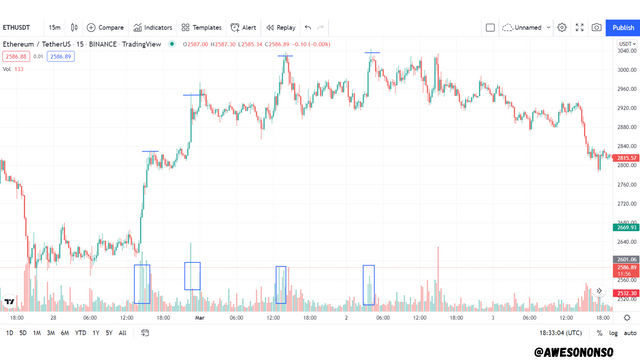
An uptrend is characterized by a continuous increase in the price of an asset. Given the fact that the price increases, we can say that the demand is more than the supply in the market. On the charts, the candles would form higher highs and the bullish volume would be relatively higher than the bearish volume. This means that buyers are buying more than sellers are selling. This has been shown below;
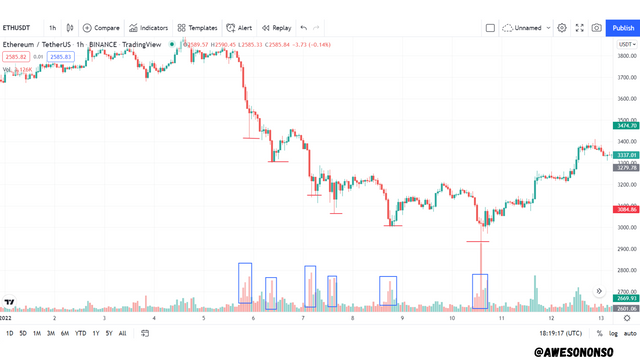
A downtrend is characterized by a continuous decrease in the price of an asset due to the fact that there is more supply than demand in the market. The Candles would form lower lows and the bearish volume would be relatively higher than the bullish volume. This means that the sellers are selling more than the buyers are buying. This is shown below;
How to place entry and exit orders following the laws of supply and demand
Entry after a Pullback
The trend of a market should correlate with the volume. A bullish market would have high bullish volumes while a bearish market would have high bearish volumes. Areas that have low volumes are associated with a sideways market or a pullback. We can wait for a pullback to end before opening a position in the market.
For example, if there is a pullback after a bullish market, we should expect to see the volume dry up during that pullback. If a high volume bullish candlestick forms after this pullback, then we should be ready to open a position. The entry point would be a bit higher than the previous peak. This would be similar for a bearish market but the entry point would be a bit lower than the previous lowest low.
I will illustrate this for a bullish market below;
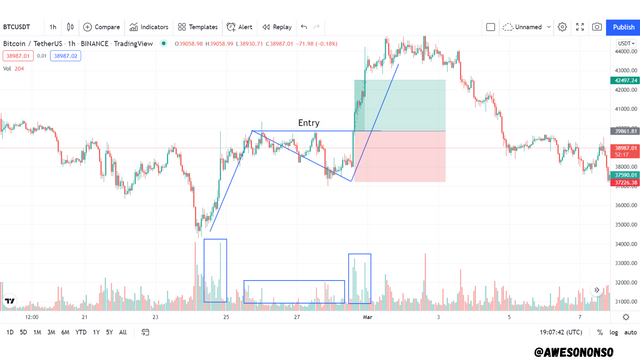
In the image above, an uptrend had begun and it was associated with high volume. Later, there was a retracement and the volume started to dry. After the pullback, there was a bullish candle with high volume. We can place an entry a little bit above the peak. The stop loss in this case is just below the lowest point and the take profit is at a ratio of 1:1 of the stop loss.

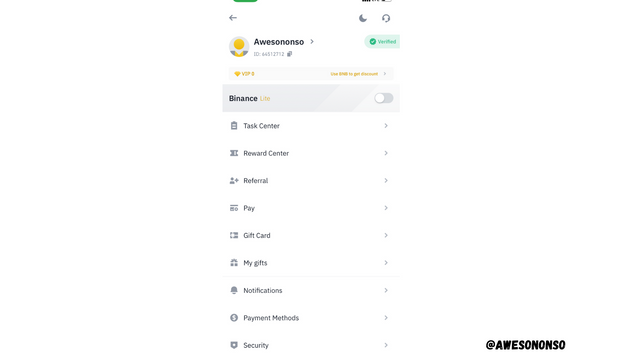
Open a live trade where you use at least one of the methods explained in the class. (Screenshots of the verified account are required.)

For this task, I will be trading the ETH/USDT crypto pair on Binance. I will use TradingView to analyze the chart.
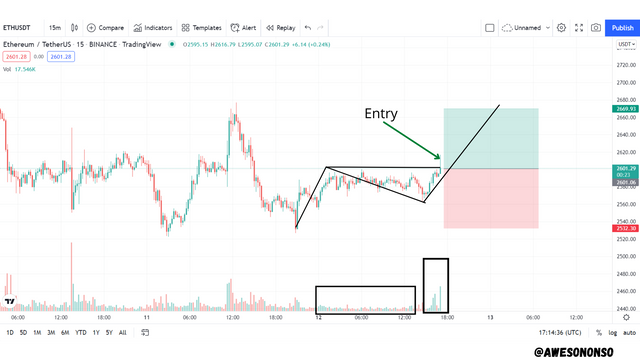
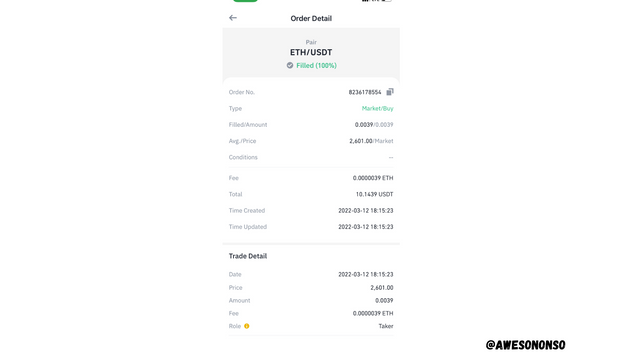
From the chart above, there was a little bit of upward movement on the chart after the price was rejected at the support level. After the upward movement, the market started to retrace and the volume dried up. A bullish candle with high volume formed later. I placed a buy order at the price of 2601.00 which is just above the latest peak. The loss is at the 2532.20 while the take profit is at 2669.93. Risk reward ratio is 1:1.

Conclusion

Crypto trading is an art that takes a gradual learning process and commitment to fully master. To avoid mistakes that could ruin a person's ambition, it is important to take the baby steps and learn from the scratch. The various concepts discussed in the class are just a few out of many things traders ought to know for a successful career.
You've got a free upvote from witness fuli.
Peace & Love!
Downvoting a post can decrease pending rewards and make it less visible. Common reasons:
Submit