

Introduction

In a bid to understand and gain from the crypto and financial markets, traders have studied and developed several helpful techniques for approaching these markets. Fundamental, sentimental and technical analyses are always employed when approaching these markets. All together, these analyses have been developed so much to include tools like on-chain metrics, technical indicators, etc. which provide information that make the trading process more bearable. Interpreting trading signals can also involve the use of something very basic such as Price Action.
In the lesson, professor @reminiscence01 has adequately explored the topic of price action and properly explained the necessary concepts. After going through the lesson, I will now attempt the tasks given.

1. Explain your understanding of price action.

An asset's price does not just come up arbitrarily. In reality, the price behavior of an asset is displayed on visible charts where the price is plotted against a chosen timeframe. The study of these charts brings about the concept of technical analysis in general. These charts provide historical and current data on price and volume of assets that help technical analysts make proper trading decisions.
Price Action is a very basic type of technical analysis. It simply involves the studying charts and making proper trading decisions with very little use of technical indicators. As the name implies, traders who use this strategy depend so much on the price charts when making trading decisions.
The price action technique has proven to be very effective due to the fact that the charts are basically a graphical representation of the market psychology. What this means is that when certain conditions are met, a particular outcome is expected to take place and this can be identified and exploited on the charts. For example, the psychology of traders have prompted the adoption of chart patterns like pennants, flags and wedges which when identified influence the decision of traders. Other price action tools include resistance and support lines, trend lines, volume and so on.

2. What is the importance of price action? Will, you chose any other form of technical analysis apart from price action? Give reasons for your answer.

Importance of Price Action
1.) It helps traders visualize the market psychology and emotions
I have already stated earlier that the charts are a graphical representation of the market psychology. The market psychology is simply the overall sentiment of the traders in the market. The price action technique can help us identify the prevailing psychology in the market and the emotion of traders at a point in time. This can be achieved with the help of chart patterns and resistance and support levels. For example, when a trader notices a triangle patter form on a chart, he can expect a breakout in the direction of the triangle and prepare to open a position accordingly.
2.) It reduces noise and makes technical analysis simpler
Thanks to the use of Price action traders do not need to overload their charts with so many indicators. Indicators can give off false signals or unnecessary noise and too much of them can affect a trader's decision negatively. Some of these indicators even lag and give off signals long before price action. By employing price action, we can get clear signals without complications from technical indicators.
3.) Good entry and exit points
The use of price action helps traders view the charts in different time frames and find the best entry and exit points. This helps traders maximize their opportunities properly.
4.) Identifying Support and Resistance levels
Price action can help traders identify arears of concentrated supply and demand. Areas of high demand where the price of an asset would hit during a downtrend and reverse upward are known as support levels. Similarly, arears of high supply where the price of an asset would hit during an uptrend and reverse downward are known as resistance levels.
5.) For identifying trends and trend reversals
Studying the general behavior of an asset's price, we can identify the trend direction of the market and know whether the market is bullish or bearish. Also, we can tell when there would be a possible trend reversal through the use of price action.
Will I choose any other form of technical analysis apart from price action?
Yes I would actually prefer to use technical indicators for technical analysis than strictly price action. I rely on price action but I like to combine it with the use of technical indicators. The things is that I really like to confirm my signals before making any trading decision. Technical indicators can give a lot of important information and help confirm signals from the price action.
When certain patterns are observed, the signal given can be confirmed by one or more technical indicators. For example, we can identify an M-top pattern with the use of the Bollinger Bands. When this pattern occurs, we can expect a bearish divergence signal on the RSI and so an eventual downtrend. Similarly, when a W-bottom patter occurs with the use of the Bollinger Bands and the RSI gives a bullish divergence signal, then we can expect a possible uptrend later. I will demonstrate these below;
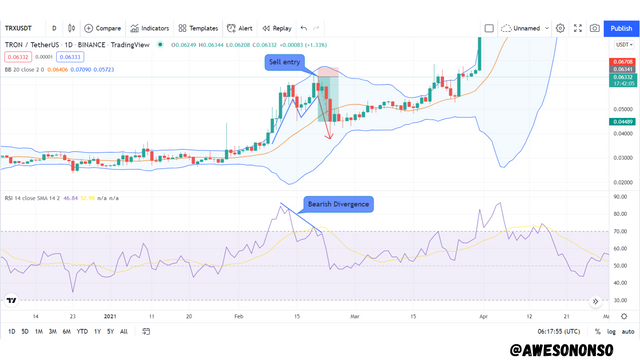
In the image above, we can see the formation of an M-top pattern on the Bollinger bands and a bearish reversal signal on the RSI. At the second top of the price action, we can open a sell position.
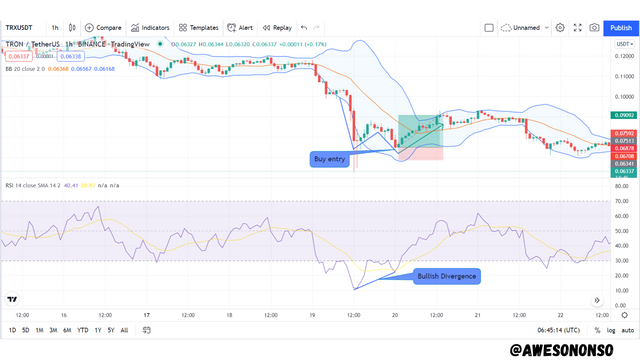
There is a W-bottom pattern on the Bollinger Bands in the image above. The RSI makes a bullish reversal signal at the second bottom. At that point, we can open a buy position.

3. Explain the Japanese candlestick chart and its importance in technical analysis. Would you prefer any other technical chart apart from the candlestick chart?

There are various types of charts used for trading which include Line Charts, Candlestick Chart, Bar Chart, Hollow Candle Chart, Heikin Ashi Chart, Renko Chart an so on. Among these, the Candlestick Chart is the most widely used.
The Candlestick chart system was developed in Japan in the 1700s when a Rice trader named Munehisa Homma discovered there was a relationship between the price of a commodity and the psychology of the market coupled with supply and demand. On a typical candlestick chart, there a basically two types of candles which are bullish and bearish candles. By default, bullish candles are green in color while bearish candles are red in color.
A candle is made up of the Real Body and the Wicks.
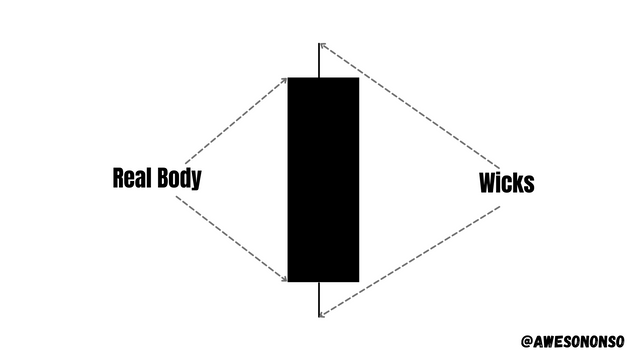
The top wick indicates the highest price an asset attained in a period while the bottom wick indicates the lows price. For a bearish candle, the price closes below the open of that period and so the close is at the bottom of the real body. For a bullish candle, the price closes above the open of the period and so the close is at the top of the real body.
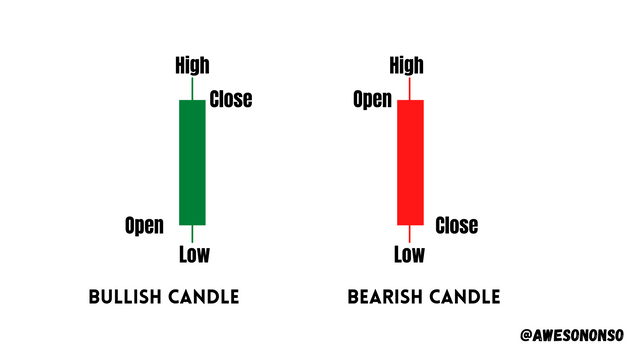
On a general outlook, the candlestick chart can be used to determine the direction of a trend. Individually, the size of the body and wicks of the candles that serve as very good indicators for the price momentum of an asset. The Candlestick chart can also give great signals when the candles hit support and resistance levels. Together with the use of patterns formed by the candles, the candlestick chart can properly show the prevailing emotion of traders in the market and help a trader make proper decisions.
Would I prefer any other technical chart apart from the candlestick chart?
No I would not prefer to use any other technical chart apart from the candlestick chart. This is especially because I do no know how to properly use other chart types. Also, the candlestick chart gives the trader a lot of data to work with when trading including price behavior and market psychology.

4. What do you understand by multi-timeframe analysis? State the importance of multi-timeframe analysis.

Multi-timeframe analysis is involves studying a single market or currency pair using different timeframes. To do this, we use the higher timeframe to determine the general direction of the market and the lower time frames to find good entry and exit points. For example, if a trend is identified using the daily timeframe, we can find a good entry position using the 4-hour timeframe. Similarly, if the 4-hour timeframe is used to identify a trend, we can find a good entry position using the 15-minutes timeframe.
Importance of multi-timeframe analysis
1.) For determining good entry and exit points
I have already mentioned this earlier. Going from higher to lower timeframes, we can single out a good entry point during a trade in order to maximize an opportunity. Also we can make our stop loss smaller and find the best point to place a take profit.
2.) For eliminating noise
Going from lower to higher timeframes, we can reduce the amount of activity on the chart and see a clear trend or pattern. A higher time reduces redundancy in analysis.

5. With the aid of a crypto chart, explain how we can get a better entry position and tight stop loss using multi-timeframe analysis. You can use any timeframe of your choice.

For this task, I will be using the BNB/USDT crypto pair on TradingView. The date for the illustration is 10th of May 2021.
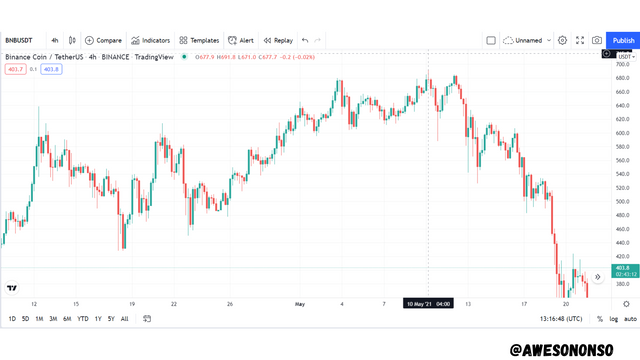
Looking at the 4-hour chart above, we can see how chaotic the price movement. To identify a clear trend, we need to switch to a higher timeframe.
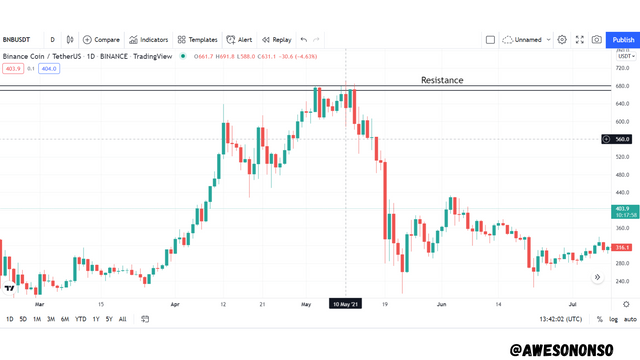
From the 1-day chart above, there was a clear uptrend before the 10th of May. Normally, I would want to place a buy order but I would also be skeptical seeing the resistance at the top. If we had placed a sell order at the close of the previous candle, the stop loss would be about 21 points.
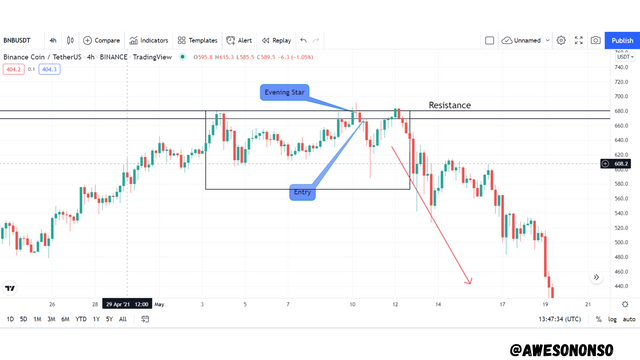
Going back to the 4-hour chart, we can notice an evening star pattern form. After the third candle confirms the pattern we place a sell order at the next candle. At this point the stop loss would be 15 points.

6. Carry out a multi-timeframe analysis on any crypto pair identifying support and resistance levels. Execute a buy or sell order using any demo account. (Explain your entry and exit strategies. Also, show proof of transaction).

I will complete this task still using the BNB/USDT crypto asset on tradingview.
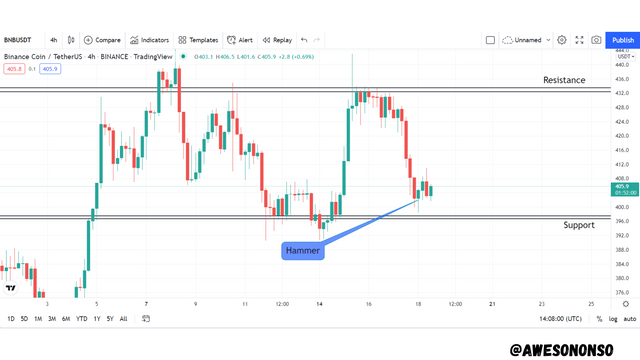
I started by loading the pair on the 4-hour chart as shown in the image above. Here, there was a Hammer candle formed. A hammer is usually a bullish signal but my stop loss here is at 7 points as indicated by the support.
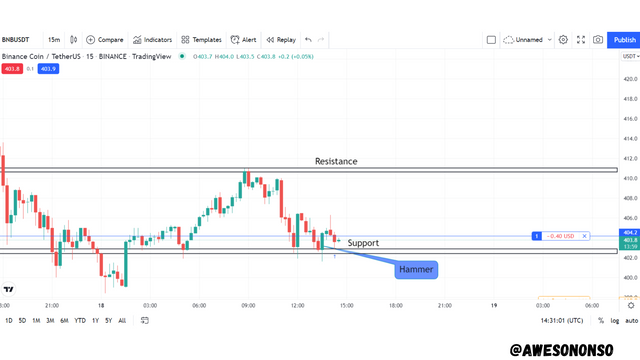
This screenshot of the 15-minute chart was taken after the trade was placed. We can see another hammer formed here. The stop loss is at 3 points. I can open a position here but I choose to use a smaller time frame.
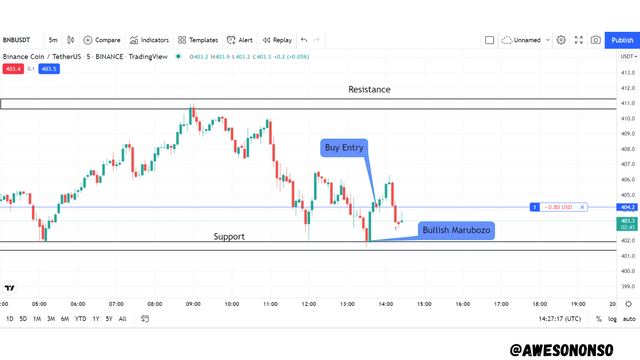
This screenshot was also taken after the trade was placed. Here I noticed a Bullish marubozu candle ( i.e a bullish candle without wicks) which is a strong buy signal. So, I placed the order using this timeframe with stop loss at 2 points.
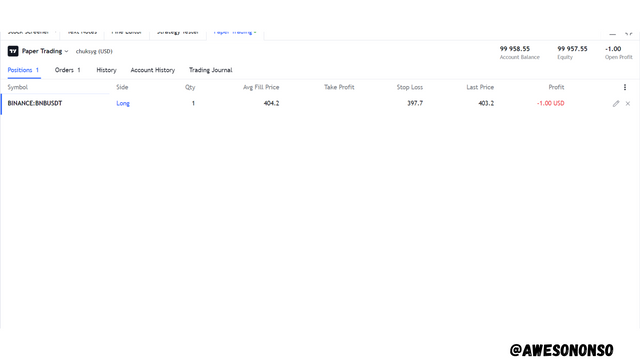
As we can see, the position is open above.
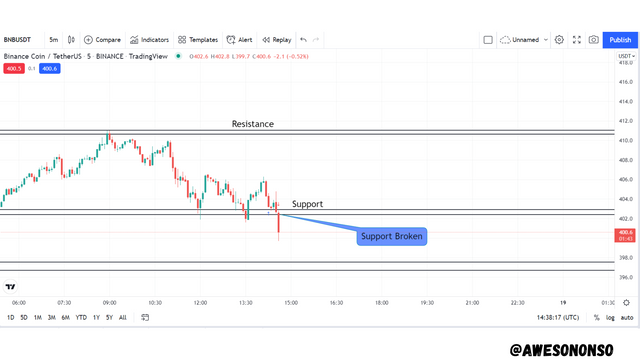
Unfortunately, the price broke my support violently. Maybe I should have placed by take profit lower than the indicated resistance level.

Conclusion

There are different ways of approaching the market as a technical analysts. Price action is a very effective method because it reduces noise whilst still delivering enough data to the trader. This method does not make crypto trading any less risky and so should be used with caution. Personally, I prefer to back it up with technical indicators.
Hello @awesononso , I’m glad you participated in the 2nd week Season 6 at the Steemit Crypto Academy. Your grades in this task are as follows:
Recommendation / Feedback:
Thank you for participating in this homework task.
Downvoting a post can decrease pending rewards and make it less visible. Common reasons:
Submit