

Introduction

On-chain metrics are just as important as technical analysis in the crypto universe. These metrics are very clear indications and measurements of the general use of a particular blockchain network which can help investors know just when to invest in a cryptocurrency.
With a number of On-chain metrics in use today, it is necessary we get to know most of them and how to use them. Professor @sapwood has properly been able to elaborate on some of these metrics in the lesson for the week. Today I will attempt the task given to the best of my abilities.

(1) What do you mean by Global In/Out of the Money? How is a cluster formed? Explain ITM, ATM OTM, etc with examples?

Global In/Out of the Money
Global In/Out of the Money (GIOM) is a type of On-chain metric that organizes wallet addresses of a blockchain in clusters based on a given range which the crypto asset of that blockchain is bought and held. With the range given, the average price of a cluster can be determine. The ranges are used to determine which clusters are in profit or loss according to what the price the asset was bought for.
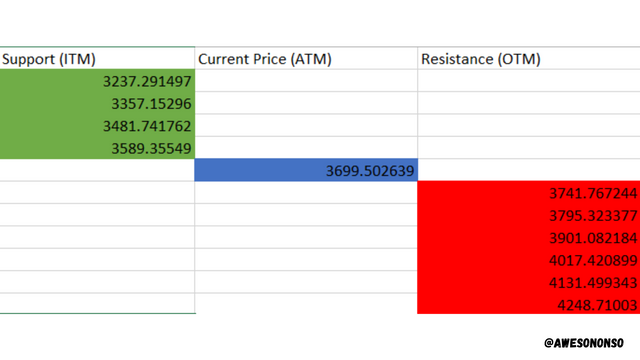
Data from the GIOM can be used to determine Support and Resistance levels of a crypto asset. The strength of a support or resistance level would depend on the volume of assets in the clusters that belong to that category.
The GIOM can also be used to determine the momentum of an asset. This is done to know if the momentum favors the buyers or the sellers.
How is a cluster Formed
Global In/Out of the money does not concentrate on a particular area rather, as the name implies, it considers the balances of all the wallets of a particular blockchain network around the world. To form a cluster, data is collected from all the wallets around the world and then the wallets are grouped in ranges according to what price the asset was bought and held by the wallet. The basic information we can find on a cluster are:
- Minimum price
- Maximum price
- Average price
- Total Volume
- Number of Addresses
Clusters can fall under the following categories;
- In The Money (ITM)
- At The Money (ATM)
- Out of The Money (OTM)
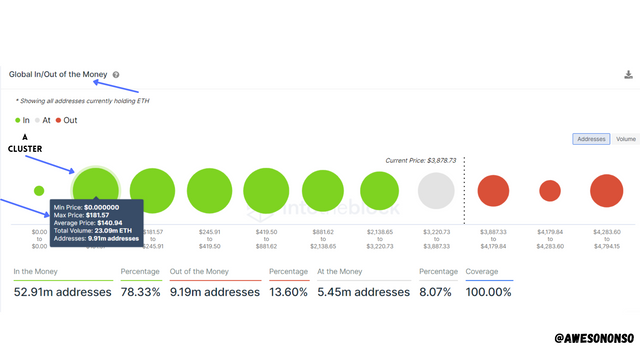
Explain ITM, ATM and OTM with examples
1. ITM
ITM is an acronym which stands for In The Money. It is used to describe clusters whose Maximum Price is lower than the current price of the asset in consideration. This would mean that the wallets that belong to those clusters are in profit. On Into The Block App, these clusters are tagged with a green color. Since the price is higher than the Maximum price of these clusters, they act as support levels for the price. I highlighted ITM in the image below;
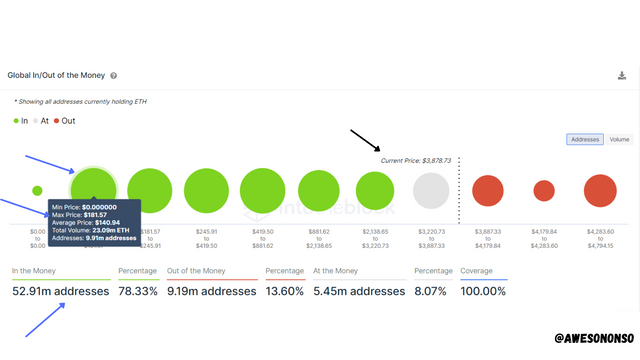
In the image above, the green clusters are the ones that fall under the category of In The Money. The highlighted cluster has a Minimum price of $0.00 and a Maximum price of $181.57. The current price of Ether is $3878.73 which is higher than the Maximum price of the cluster. Therefore, the cluster is in profit. There a total of 52.91 million addresses from different clusters that fall under ITM.
2. ATM
ATM in this case stands for At The Money. This refers to the clusters who have the current price of the asset within their range. The wallets in these clusters are at Break even point because they are neither in a profit nor a loss. On Into The Block App, these clusters are tagged with a grey color. I highlighted ATM in the image below;
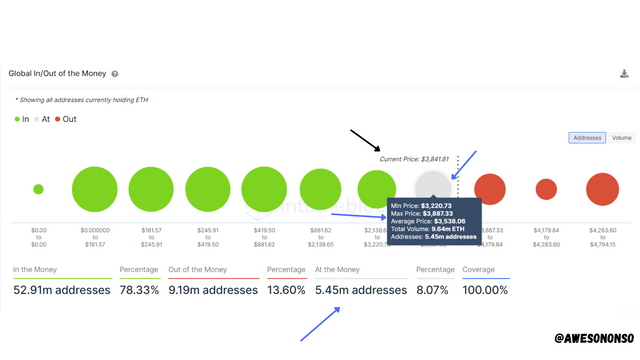
In the image above, the grey cluster that is highlighted falls under the ATM category. Its Minimum Price is $3220.73 while the Maximum Price is $3887.33. The current price $3841.81 and this falls within the range of this cluster.
3. OTM
OTM, which stands for Out of The Money, is used to describe clusters whose Minimum price is higher than the asset's current price. The wallets that belong to these clusters would be in a loss in this case. Since the price is lower than the Minimum price of the ranges of the clusters, the clusters would act as resistance levels in this case. On Into The Block App, these clusters are tagged with a grey color. I highlighted OTM in the image below;
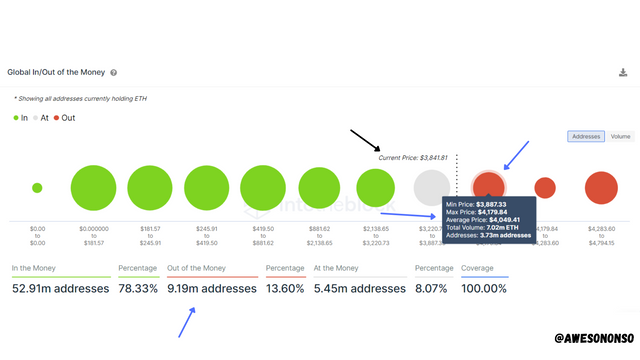
In the image above, the red clusters are the ones that fall under the category of Out of The Money. The highlighted cluster has a Minimum price of $3887.33 and a Maximum price of $4179.84. The current price of Ether is $3841.81 which is lower than the Minimum price of the cluster. Therefore, the cluster is in a loss. There a total of 9.19 million addresses from different clusters that fall under OTM.

(2) Explain about Large Transaction Volume indicator with examples? What is the difference between Total and Adjusted Large Transaction Volume? Examples?

Large Volumes play an important role in the movement of the markets. Due to this fact, the Large Transaction Volume Indicator was developed.
The Large Transaction Volume is an on-chain metric indicator that records large transaction of a crypto asset that are more than or equal to $100,000. Such large transactions can either come from individual whale accounts or large institutions.
When large volume transactions occur, the indicator spikes indicating that whales or large institutions have bought or sold off the asset. This affects the price accordingly depending on the direction of the flow. If the indicator does not spike or remains at a base level, it means that whales and large institutions are currently uninterested in the asset.
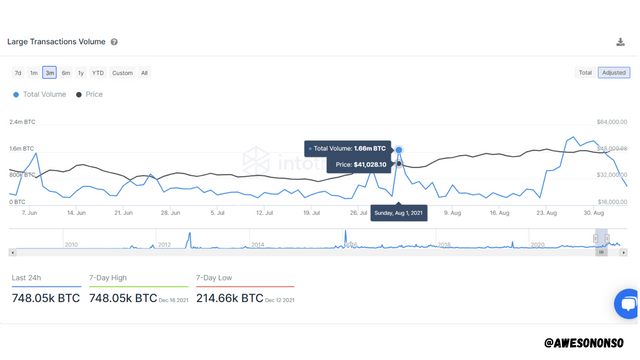
From the image above, the indicator is set to 3 months. There was a spike in volume on August 1st by 1.66 million BTC. After the spike, the price of BTC began to rise.
Difference between Total and Adjusted Large Transaction Volume
Total Large Transaction Volume
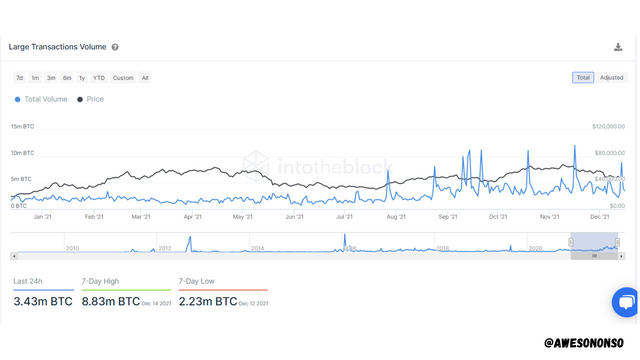
The Total Large Transaction Volume considers every single transaction of $100k and above no matter the if it is into or out of a wallet. This means that if I make a transaction of $100k worth of BTC and that amount is returned to my address, the Total Large Transaction Volume will track these separately. Below is BTC analysis using Total Large Transaction Volume:
Adjusted Large Transaction Volume
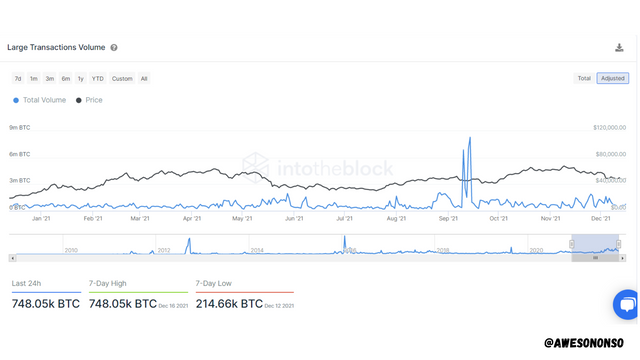
Unlike the Total, the Adjusted Large Transaction Volume does not simply consider every transaction worth $100k and above. The Adjusted Large Transaction Volume considers the address of origin of the amount when tracking transactions. This means that if I make a transaction of $100k worth of BTC and the amount is returned to my address, the returning transaction would not be considered.

(3) Analyze a crypto asset(other than BTC) using on-chain metric: GIOM, and Adjusted Large Transaction Volume? Ascertain whether it supports a Bullish or Bearish bias or Neutral? How do you find the support and resistance using GIOM? How do you ascertain the upside/downside momentum using GIOM? Use InTotheBlock app or any suitable app? (Examples/Screenshots)?

Analyzing Ether with GIOM
For this, I will be using IntoTheBlock app.
Bullish or Bearish in the Short-run
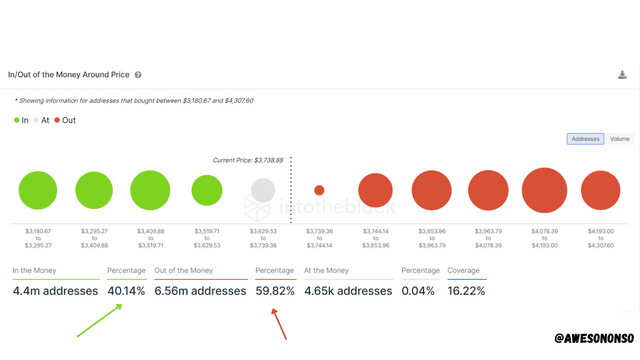
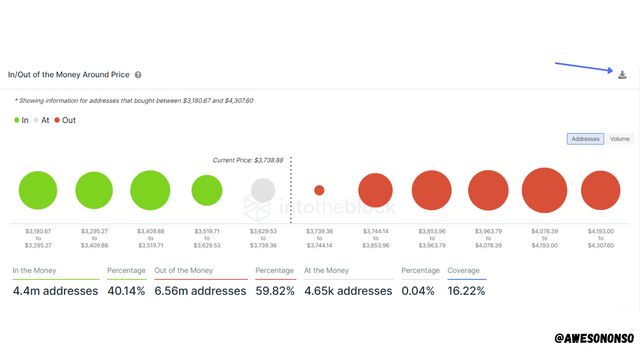
From the image above, the ITM has a percentage of 40.14% while the OTM has a percentage of 59.82%. This shows that Ether supports a Bearish bias in the short run.
Bullish or Bearish in the Long-run
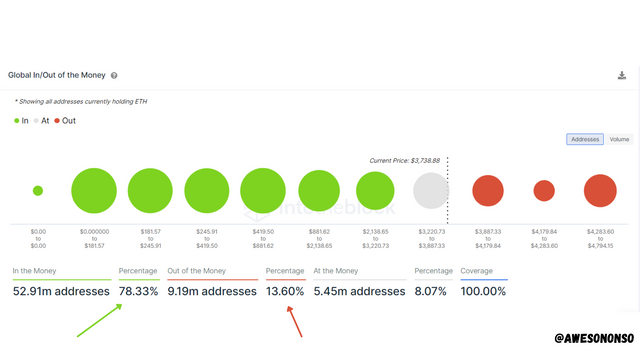
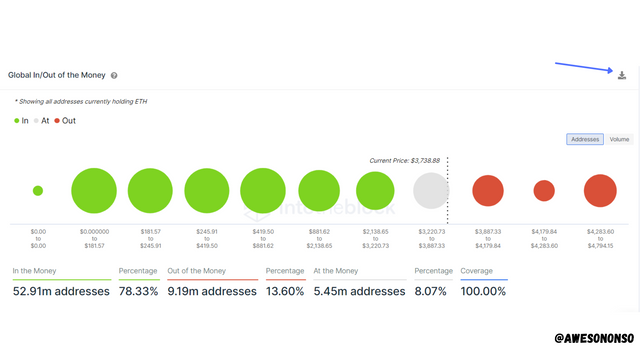
From the image above, the ITM has a percentage of 78.33% and the OTM has a percentage of 13.60%. This is a very clear indication that there is a Bullish bias in the Long-run.
Support and resistance levels in the short-run
I Downloaded the raw data as shown below.
Then I was able to view it with MS Excel.
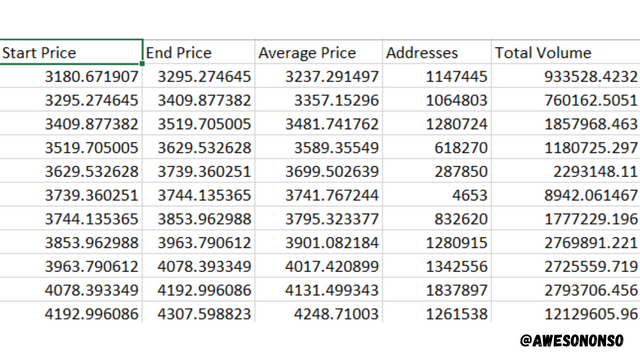
From this we can easily extract the support and resistance levels from the averages. Below I have given these levels:
Support and resistance in the long-run
I downloaded the raw data as shown below.
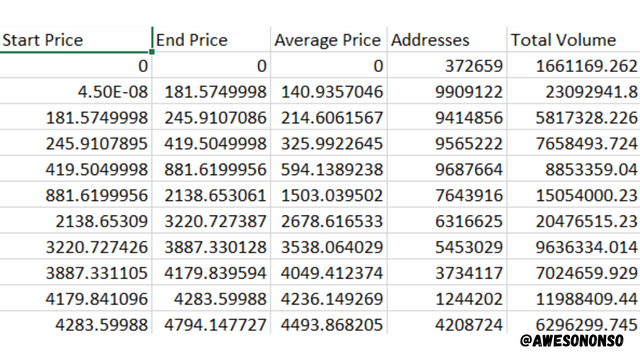
I was able to view the data with MS Excel.
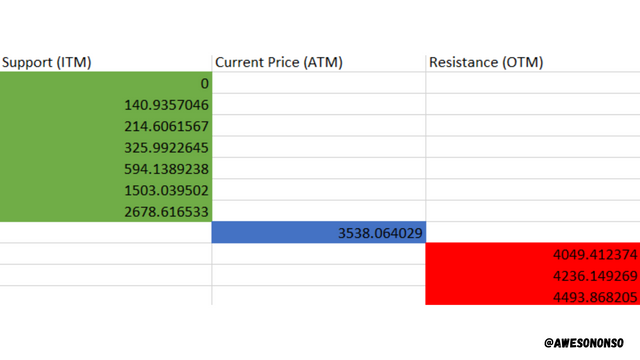
Finally we extract the support and resistance levels from the averages. I have given the levels below;
Momentum using GIOM
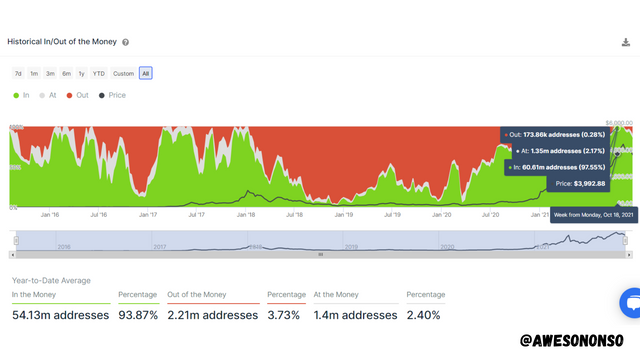
As stated by the professor, to determine the momentum the price range has to be equal. Keeping that in mind, I have used a price range of $3,900 to $4,000.
For October 18th, 2021, we have;
Price of ETH - $3,992.88
ITM - 60.61m addresses (97.55%)
OTM - 173.86k addresses (0.28%)
For December 13th, 2021, we have;
Price of ETH - $3,900.22
ITM - 57.28m addresses (84.95%)
OTM - 7.41m addresses (10.99%)
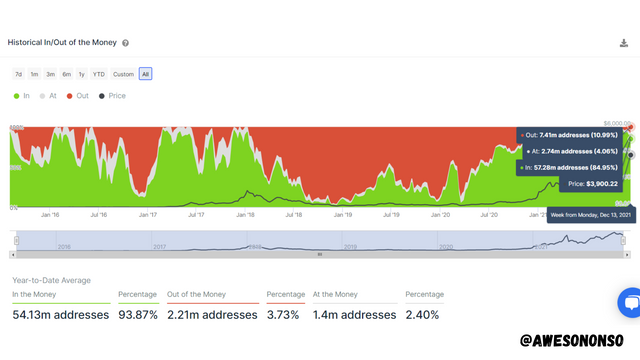
From October 18th to December 13th, there was a drop in the number of ITM addresses from 60.61 million addresses (97.55%) to 57.28 million addresses (84.95%). However, for OTM, there has been quite a significant rise from 173.86 thousand addresses (0.28%) to 7.41 million addresses (10.99%). This means there is a downside momentum for Ether.
Analyzing Ether with Adjusted Large Transaction Volume
Note: I noticed that BTC alone has the option of working with either Total or Adjusted volume while the other coins do not. However, I will work with what I'm given.
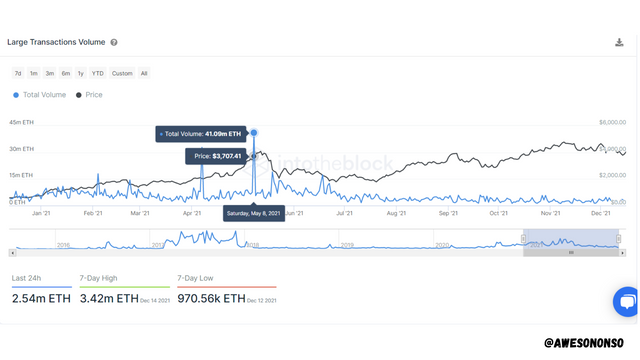
As we can see in the image above, the last time there was a significant spike in the Large Transaction volume was on the 8th of May, 2021 which recorded at 41.09 million ETH. The previous 7-day high is 3.42 million ETH which is a 91.68% drop. The last 24 hour record is 2.54 million ETH which is a massive 93.81% drop in the Large transaction volume. This means that whales and large institutions have greatly lost interest in Ether for now.

Conclusion

On-Chain metrics can be quite useful if we know how the operate. The GIOM has proven to be very useful in estimating resistance and support levels which technical analysts depend on a lot. The tool is also a good momentum indicator as we have learnt today.
The Large Transaction Volume indicator is also an important metric indicator. Volume is a major part of the markets and the activities of whales command these volumes. Luckily, the Large Transaction Volume Indicator can help us know when these volume levels spike.