Hello steemians! How is everyone? I'm good and hope so you all are also good. This homework will given by sir @shemul21. I am very pleased to participate in this task. It would help me to understand about support and resistance.
Q.no 1. What is the Support & Resistance zone?
Support and Resistance Zone is important for marketing knowledge. Cryptocurrency are bought and sold based on the required prices on chart.
This is based on technical analysis. This is described in both, as a zone or as a line.
The area of support is horizontal in the price chart. There are markets active for making higher prices. In the zone the price breaks for a certain time and at that time price stays. And when price disrupt in those areas then prices are in higher levels. Traders have good opportunity for trading.
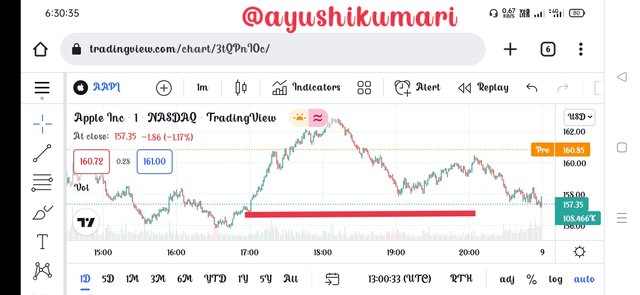
When the market are in demand zone, the prices will automatically upward line. Demand zone is known as support zone from one side.
Accordingly, the resistance area has also a horizontal price chart. The markets are getting lower prices. The traders always put full efforts to downward price. The markets automatically go in downward part.
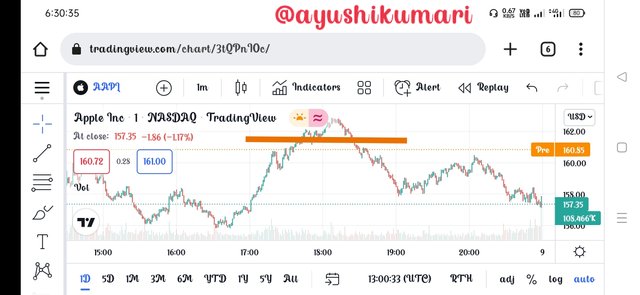
When price effectual supply zone move in lower price, then supply zone is also known as resistance zone.
Q.no 2. Explain different types of Support & resistance with proper demonstration.
In the market level, there are three types of Support and Resistance :
i) Horizontal Support and Resistance
ii) Sloping levels of Support and Resistance
iii) Dynamic Support and Resistance
Now, I am going to describe those types line by line.
Horizontal Support and Resistance
Horizontal Support and Resistance is one of the easiest way to identify price chart. This is connecting all the wick and body by horizontal lines where we can identify support and resistance very easily.
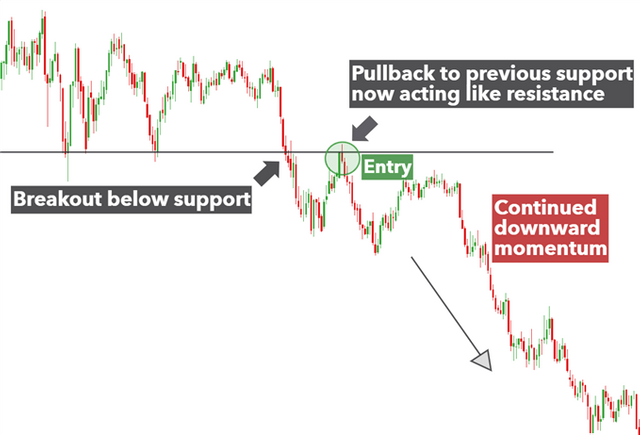
Sometimes, this is difficult for beginners in doing trading. Some beginners don't identify support and resistance line. Because the breaks of support area, it works as horizontal resistance. Similarly, breakout of resistance area, it works as horizontal Support.
Support and resistance is a easy way to do trade. When market break more and more time that zone, then that zone is so weaker.
Higher timeframe gets preference than smaller timeframe.
Sloping levels of Support and Resistance
Sloping level is that zone of support and resistance where you see cryptocurrency in trend lines. We can easily identify the markets levels. The weather of market is good or not.
That means, the weather is based in tradelines and the market is uptrend and downtrend sometimes. By this we know the markets levels very easily and the trading is also very good.
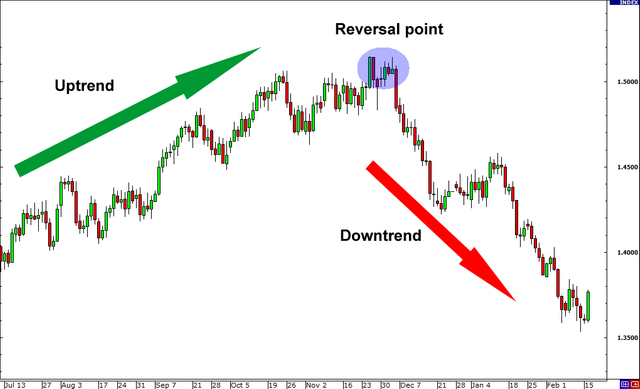
Whenever markets is in uptrend, no matters in market, how much the breaks have happened in the market, the market is going up after breaking also. We get market price highest always. At that time, one image show which is called uptrend support level.
The markets is in downtrend, the prices stayed in line but then market price isn't going up. It stays and when it beginning, the price is going downtrend. We get market price lower all the time after break also. That is called downtrend of market price. At that time, we can draw a image which is called downtrend resistance level.
Dynamic Support and Resistance
This is very hard to identify support and resistance. It is also very hard to identify with horizontal lines and trend lines.
Simple Moving Average is a way to find dynamic Support and Resistance. It is simple way to identify dynamic level. It depends on traders. Sometimes traders use another moving average, then there is some pullback situation.
All the traders use 20, 50, & 200 moving average. If market close to 20 moving average line that means Market is going healthy. If the market is close to 50 moving average line that means market is taking break and after that it starts for long run. When the market is close to 200 moving average that means market is in critical level. After that it show a trend reversal. These three moving average gave a different part of support and resistance level.
Q.no 3. Identify The False & Successful Breakouts. (demonstrate with screenshots)
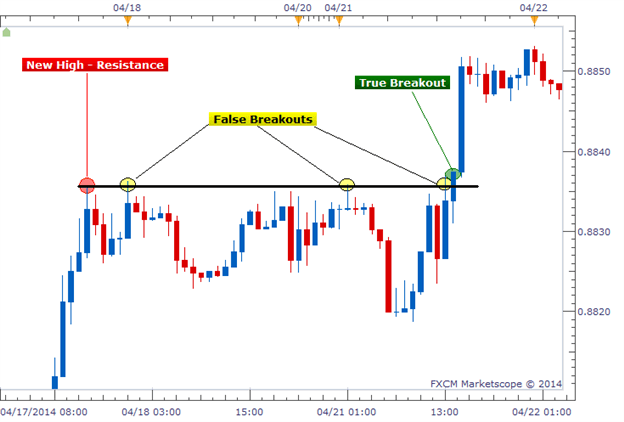
Sometimes market goes far from the support and resistance. This is called a breakout. Markets have many types of breakout. Sometimes, the breakout is good and sometimes breakout is bad. But this is so difficult for traders to identify good or bad breakout.
1. Successful Breakout
Successful Breakout has two parts:
i) Continuation Breakout and
ii) Reversal Breakout
Continuation Breakout
This type of breakout is if it breaks at one point. Market stays in same area after the break and again continues to trend zone. This process is called continuation breakout. The breaks of prices, in support and resistance line and prices move again in previous price.
Reversal Breakout
This type of breakout happens when price goes in same direction and after pump and dump, prices go in reversal direction. Wherever price breakout after starting of that zone, it goes opposite side in reversal Breakout.
2. False Breakout
When false breakout happen in upward line then the price level is in downward line. Market prices don't go in upward line. Similarly, when false breakout happens in downward line, then level of price is in upward line. Market price goes in downward line. These process happens in false breakout.
Q.no 4. Use Volume and RSI Indicator Combined with Breakouts & Identify the Entry Point. (demonstrate with screenshots).
Volume and RSI Indicator is very important to know the breakouts in market price. It easily identifies successful or false breakout. It is very helpful for trading.
Full form of RSI Indicator is Relative Strength Index. This is an indicator which helps us in movement. If the RSI Indicator goes greater than 70 that means it is position of over bought. If the RSI Indicator goes less than 30 then that means its position of oversold. When the RSI Indicator don't show anything in upper band and lower band also, then the middle band of RSI Indicator is by default 50.
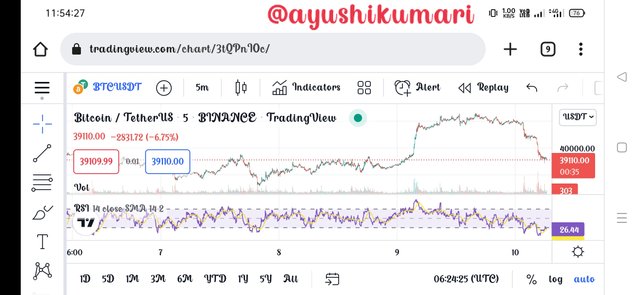
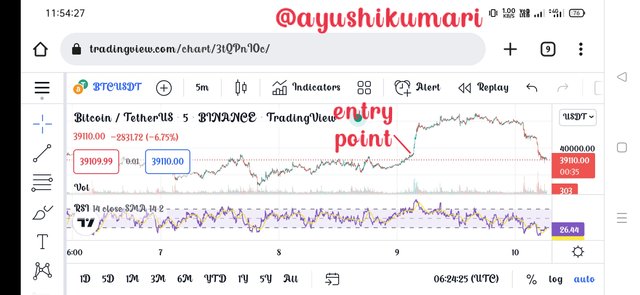
This image show entry point.
Q.no 5. Take a Real Trade(crypto pair) on Your Account After a Successful Breakout. (transaction screenshot required).
I trade with BTC/USD. I observed these crypto pair. They are good for trading. It is going in upward direction. Resistance breakout shows a good market level. That's why I think to trade here.
In this image, RSI Indicator is showing above 50... that means trading is overbought situation. Volumes are looking quite good. So, I did entry. I think my trade will go in profit.
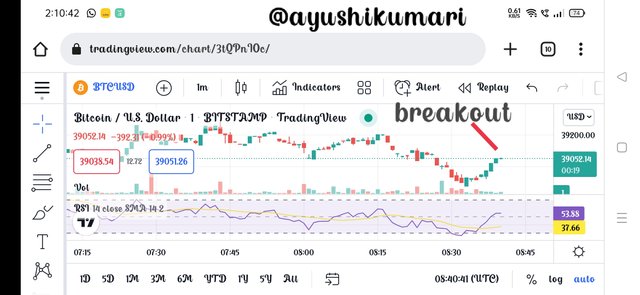
I don't share my order details there. Because I have some Technical problem in my account. Because of that, I was not able to trade.
Q.no 6. Explain the Limitations of Support & Resistance (false breakout).
The Support and Resistance gives a good information of price level. It also gives past information of market level of prices.
In false breakout, finding false breakout is not easy. For getting information of market level, it is vital to identify the false breakout. If you didn't identify, then trading goes wrong and you will lose profits.
When the markets go in Support Breakout, they are not in downward line. It is so strong to go to upward line. Similarly, in the case of Resistance Breakout market, it will not go to upward line because of its weakness. It is not going in upward line. This recognises false breakout.
That's why, check all the breakouts for doing trading. Traders don't trade without checking all breakouts. After confirmation of breakout trade, it will be awesome.
Q.no 7. Conclusion.
By this lesson, professor @shemul21 gave so much knowledge of support and resistance zone. For trading, it is important to identify support and resistance zone and also inspires us about the breakout. This chapter was too good for trading. This helps us to do trade. I am pleasure to complete your homework given by you.
Thankyou!
