QUESTION
(1a) Explain the Japanese candlestick chart? (Original screenshot required).
(b) In your own words, explain why the Japanese Candlestick chart is the most used in the financial market.
(c) Describe a bullish and bearish candle. Also, explain its anatomy. (Original screenshot required).

(1a) Explain the Japanese candlestick chart? (Original screenshot required).
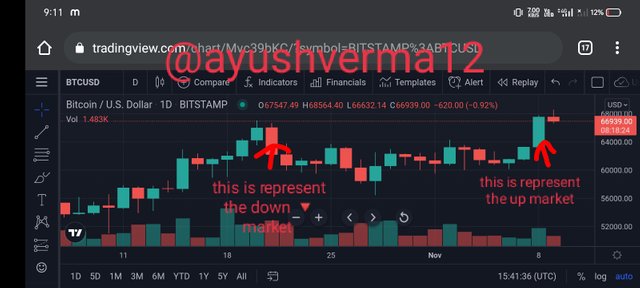
The candle stick is a very simple wick.Basicali is of Green and Red Color.
Candle stick and reinvest it. Market will be up to the market today or the market will be down today.
Candlestick with red represents that the market has gone very low today.And the green candlestick represents that the market has gone up a lot today.
If you see Extreme Green, then it means that the market is very high.
If you see extreme green it means that the market has gone down a lot today.
Like friends, if you live in any country, the total is as much as it is, as if someone has bought or sent it, then the total calculation which is the total, which is the representation, it should be through candlestick goes.
the top of the candlestick body and the high for a particular trading period which depends on chart time it can be 15 minutes chart, 1-hour chart, a daily chart, etc.
when the demands are low, it forms a bearish candlestick which shows that the asset price is depreciating. And the high for a particular trading period which depends on chart time it can be 15 minutes chart, 1-hour chart, a daily chart, etc.

(b) In your own words, explain why the Japanese Candlestick chart is the most used in the financial market.
• The Japanese candlestick always help to show the various point in price all over the market chart.
• mostly all are use the Japanese candlestick because it always helps all traders on market to simply get to know the new energy on market chart.
• And this is are also helps to know the trend direction. and The self explanatory nature or easily comprehensive nature of the Japanese Candlestick chart has made it quite easy for traders
• It is very easy to understanding, when's given it a look, you will understanding what the markets tells and very easy to makes use of.
• Japanese candlestick like i said earlier, gives traders detailed information about price and movement of market.

(c) Describe a bullish and bearish candle. Also, explain its anatomy. (Original screenshot required).
Bullish candle
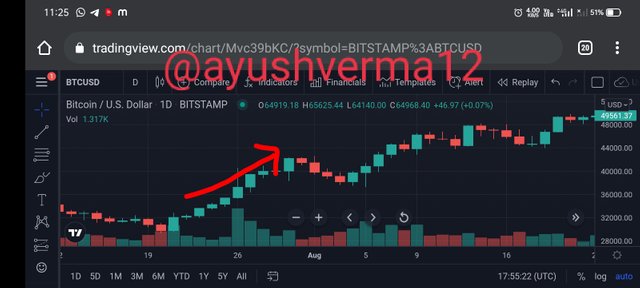
Bullish is Three line Strike. You all know what Bullish means, very fast moving sequence.
Three line Strike means The strike of three lines is called. The people of Japan have placed it on top of encircling three lines. For a bullish candle, the open price is constantly bellow the close price of the assets because a bullish candle is said to be rising Because after three lines, the one line which is the fourth line is surrounded by those three lines.
Anatomy Of A Bullish Candle.
The comprises of bullish candlestick are high and low , Open, and Close. I will clarify its purposes accordingly.
high
They show the period of the ultimately prices the assets has attained .
low
They show how price is low . the poorest prices the assets attained
open
It starts moving to estimate the price . upwards movement for a bullish candle .
close
it tells you how much is your price and whether the final price has arrived.
Bearish candle
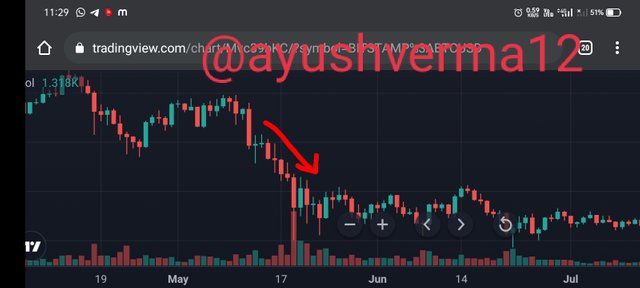
this type of trend, the closing price is lower than the open price of a respective asset for a given time period.
Also here the traders will buy assets and hold them as a future asset. This is the Japanese candlestick the red candlestick are show the price how are loss .
Anatomy Of A Bearish candle .
in this candles will show open , high prices at the top of the candle and the close, low prices at the bottom of the candle.
high
This price will shows the achived highest price of an asset in a bearish chart for a given time period.
low
It discloses the lowest price the asset attained in a provided period.
open
the trend will move in the bearish direction and also this is the start price of the bearish candlestick chart for a given time frame
close
It shows the finals prices of an assets in a given periods.


