1. Explain Wedge Pattern in your own word.
2. Explain both types of Wedges and How to identify them in detail. (Screenshots required)
3. Do the breakout of these Wedge Patterns produce False Signals sometimes? If yes, then Explain how to filter out these False signals.
4. Show full trade setup using this pattern for both types of Wedges.( Entry Point, Take Profit, Stop Loss, Breakout)
5. Conclusion

1. Explain Wedge Pattern in your own word
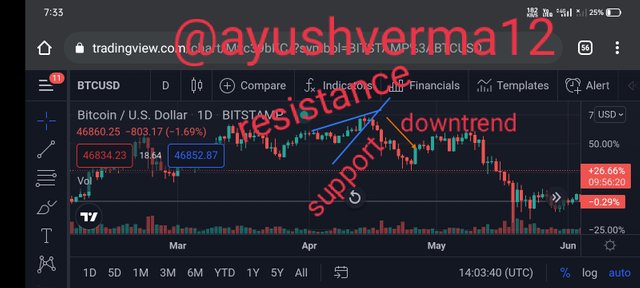
This wedge pattern, can br found at the top of thr chart and also at the buttom of thr chart. Now, the two types of wedge pattern can be considered or be seen at the top or buttom of the chart. Rising wedge pattern is normally seen at the top of the chart, i.e when this shows up, traders are being alerted that the market will bearish or reverse back in the other direction which is the bearish movement.
When the market is moving in a bullish trend, it reaches a point where the trend pauses signifying a small appearance of downtrend and calls for a trend continuation or reversal. This means that the angle between the two(2) trend lines of the wedge pattern decreases as the market trend reaches its end.
The emergence of a wedge pattern indicates a slight market pause. Such that, during the emergence of this pattern in an uptrend, traders are observed to exit the market since their bullish effect is not acknowledged because the price contracts with a slight downward trend. In a downtrend, on the other hand, the sellers are perceived as being in a break since their bear influence is not acknowledged since the value is shrinking with a slight upward trend.

2. Explain both types of Wedges and How to identify them in detail. (Screenshots required)
In wedge pattern trading, we have two types of wedge:
- Falling Wedge
- Rising Wedge
The Falling Wedge:
Falling Wedge
Rising Wedge
The Falling Wedge:
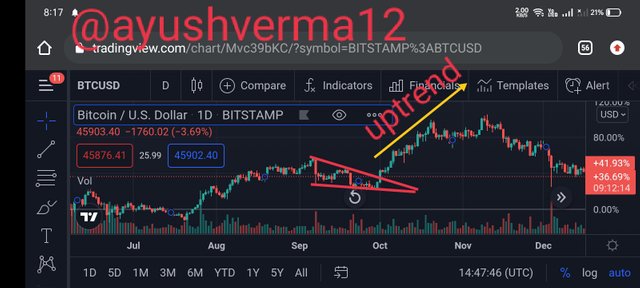
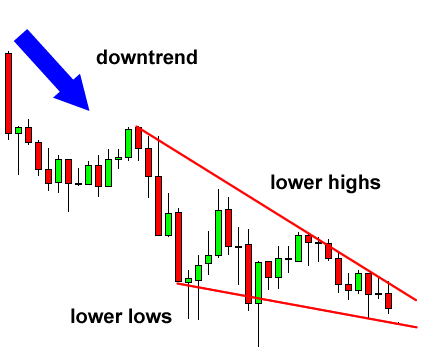
When I looked at it first time, it looks like a bearish trend, so I thought our lecturer made a mistake, but when I tried to understand it, I discovered it is very correct.The falling Wedge is a bullish trend of a wedge pattern.
In falling Wedges, when's the two converting trendline are drawn, the consolidations parts ends when the prices actions breaks through the resistances lines and there's will be a Breakout leading to uptrend.
when the falling wedge pattern is created, it signal traders that there will be a trend reversal after this pattern is formed, so now when this is formed or created, this is where traders gets ready to enter a buy order in the market.
This fall is supposed to be a pattern form, meaning that a trendline will be drawn at minimum 2 to 3 peaks to join the peaks together just as in the case above. We can see that in the analysis below.We can also say that a falling wedge is formed after the coming of a downtrend and after the continuation of trend, if the initial trend was seen to be a uptrend or if the initial trend was in a downtrend, a trend reversal will happen.
HOW TO INDENTIFY A FALLING WEDGE:
Formation of two intersecting lines:
Formation of two intersecting lines:
The line of resistance will be taken from a lower high and the line of support will be taken from lower low.
Checking the compatibility of the prices actions with two down-sloping converting Trendlines; we have to draw two (Resistances and Support) Trendlines that's will converge downwards together with the minors High and lower priced.
To identify falling wedge, you must ensure that the higher highs and lower lows touch the resistance and support lines as least 5 times.
It could be 3 higher highs touching the resistance line and 2 lower lows touching the support line or 2 higher highs touching the resistance line and 3 lower lows touching the support line.
When we talk about wedge pattern, so there must be at least 5 touches in the wedge formation. 3 on either and the 2 on another trendline.
RISING WEDGE:
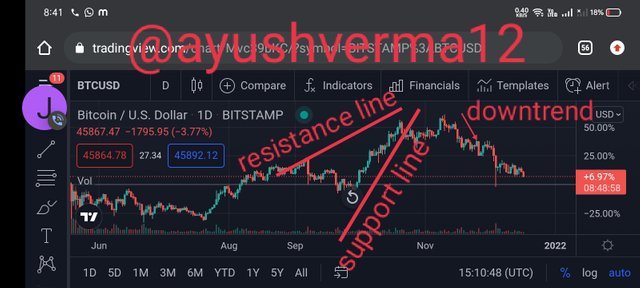
The meeting point of the the support and resistance lines creates a breakout point where there maybe a trend reversal or trend continuation. In the above image, it shows that after the wedge pattern, the price movement shifts to a downtrend and this signals for a bearish period.
We can also classify rising wedge as a bearish version of wedge pattern because after a price chart in the market rises in the direction of wedge there occurs a breakout that leads to a downward trend in the price chart.Rising Wedge patterns are Usually formed at the end of bullish trends, although they might sometimes take place in downtrends, Which leads to Trend continuations and a later downwards Breakout.
The meeting point of the the support and resistance lines creates a breakout point where there maybe a trend reversal or trend continuation. In the above image, it shows that after the wedge pattern, the price movement shifts to a downtrend and this signals for a bearish period.
it signal traders that there will be a trend reversal after this pattern is formed, so now when this is formed or created, this is where traders gets ready to enter a sell order in the market.The convergence of the upper Trendline called resistance and the lower Trendline called support are usually connected by two or more highs and lows. The market usually bounces off and back between these two Trendlines in an upward direction. And at the end of the bullish period, there is usually a trend reversal into a bearish trend where the market price moves in a downtrend.
HOW TO IDENTIFY A RISING WEDGE
The volume in the volume indicator should be falling meaning that it should be in a downtrend
Formation of two intersecting lines: We draw two obtuse lines in order to get the same wedge pattern. The line of resistance will be taken from a minor high and the line of support will be taken from minor low. The lines are taken to point of intersection of both.
Another characteristic of rising wedge is a decrease in the price action volume as the channel goes uptrend. This is because the buyers who have been controlling of the market is losing strength and sellers are getting ready to take over the market.
We have to draw two upward sliding trendlines. One of them is drawn to join the resistance points of the candles and the second one is drawn to join the support points of the candles.

3. Do the breakout of these Wedge Patterns produce False Signals sometimes? If yes, then Explain how to filter out these False signals.
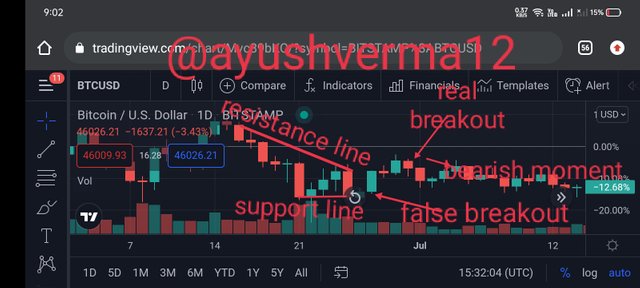
we use patterns to identify the next price movement. But it is a common issue that the identified pattern breakout may leads to give false signals. These false signals may urge you of entering and exiting to the market at a wrong time. So the traders may lead to huge losses sometimes.
we use patterns to identify the next price movement. But it is a common issue that the identified pattern breakout may leads to give false signals. These false signals may urge you of entering and exiting to the market at a wrong time. So the traders may lead to huge losses sometimes.we use patterns to identify the next price movement. But it is a common issue that the identified pattern breakout may leads to give false signals. These false signals may urge you of entering and exiting to the market at a wrong time. So the traders may lead to huge losses sometimes.To overcome this false signal given wedge patterns, I think using of momentum based indicators like MACD,RSI indicators will help to identify false signals.

4. Show full trade setup using this pattern for both types of Wedges.( Entry Point, Take Profit, Stop Loss, Breakout)
Rising Wedge Trading Setup .
 source
When the sellers took over the market and forced the price to break the support line, there was a breakout.In the chart, you can see the two converging trendlines are forming an upward slopping triangular shape and that the volume is trending downward in the formation of Rising Wedge.As you can see from the chart, we have our both trend lines, we have Mark our Breakout positions and our entry positions as we'll. This is because the movements before Breakout is usually in an upwards directions and the breakout created rooms for downwards movements or Bearish trend
TRADE SETUP USING FALLING WEDGE PATTERN
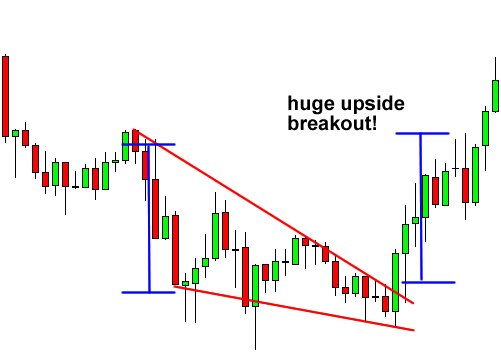
In the charts, you can sew that the two converting trendlines are drawn and the consolidations parts end's when's the price action Break through the Resistances line and there WAS a breakout leading to uptrend.This is also falling Wedge pattern which am using to performance this trade. As we discussed, that when a falling wedge patterns is formed, we have to get ready to enter a buy position.This is also falling wedge pattern which am using to perform this trade. As we discussed, that when a falling wedge pattern is formed, we have to get ready to enter a buy position.It is obvious that if we want to buy some assets at the right time, we should look for a Falling wedge which can occur during a bearish trend which may be at the bottom, so after it mostly trend reversal occurs and then the market goes Bullish that is why the falling wedge is also called Bullish version of the Wedge.

5. Conclusion
The Wedge pattern is a simple and traditional approach that can be easily passed on to fresher as it does not require much understanding, but it is not wise to get carried away with an investment based solely on a pattern.A rising wedge is formed when the market is in an uptrend and a falling wedge is formed when the market is in a downtrend. This pattern can be created by drawing 2 trendlines that combine at least 5 resistance and support points of which 3 on one trendline and 2 on another. Traders can place buy or sell orders at the right time when the price movement breaks one of the trendlines and the market breaks out. This can help traders to make profitable trades.To properly trade this pattern, make sure the various steps for trend identification for both Rising and Falling patterns are completed before you enter a trade. also use an indicator to filter out false signals.
