
I am glad to participate in the week of season 6. This is a very common and interesting lecture on the types of moving averages that is Triple Exponential moving average. It is the modified version of EMA. I have learned in this lecture how to trade with TEMA. Now we will see all the use-cases of Triple moving average.

What is your understanding of Triple Exponential Moving Average (TEMA)?
We cannot trade successfully with only depending on the price action and charts. This is why there are many technical indicator tools are designed that give us the trading signal and direction to trade. There are many indicators in the market. In this post, we will discuss the Triple Exponential Moving Average indicator.
Triple Exponential Moving Average is designed by Patrick Mulloy. It is also known as TEMA. It is initially designed for the stock market but later on, it is adopted by the crypto market as well. The purpose behind the creation of TEMA is to get clearer, lag-free, and noise-free results. Patrick Mulloy makes this indicator than other traditional Moving Average indicators.
It is a type of trend-based indicator that is used to get information about the current trend in the market. It tells us about the uptrend and downtrend market. It allows us to make trading decisions according to the current market scenario. It is basically designed after merging three Exponential Moving Average indicators.
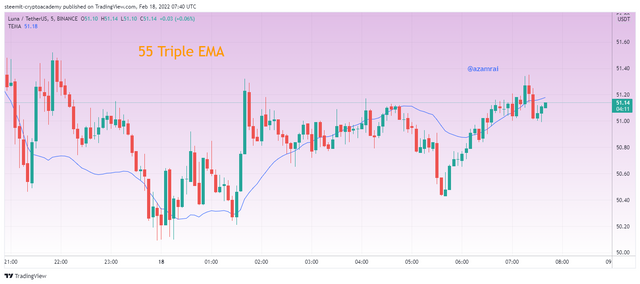
In the above figure, you can see that the TEMA is applied on the chart. The by default period length is 9. We can change the period length according to our trading strategy. We can easily identify the support and resistances using the TEMA. The Sell and Buy opportunity is also determined by using the Triple Exponential Moving Average indicator.

How is TEMA calculated? Add TEMA to the crypto chart and explain its settings. (Screenshots required).
As I mentioned earlier that the TEMA is derived after combining the result of three Exponential moving averages. That is why we call it Triple Exponential Moving Average. Now we will see the calculation process of TEMA.

The formula of Simple EMA is mentioned in the above figure. In this formula, we need a current price of an asset, Previous Period EMA, smoothening factor, and a number of periods. The calculation formula of EMA is mentioned in the above figure. We just need to put the required values into it and the current EMA is calculated.
EMA1 is simply an exponential moving average over a certain period length and the EMA2 is the EMA of EMA1 over the same period length that we applied to calculate the simple EMA. Next the EMA3 is the EMA of EMA2 over same period length that we applied to calculate the EMA1.
In the calculation process of TEMA, we have three EMAs. In the above figure, you can see the formula of TEMA. In this we have EMA1, EMA2 and EMA3. 3 is coefficient that is multiply with the EMA1 and EMA2. First, we add the EMA2 and EMA3 values and then subtract the from EMA1. After that, we get the final values of TEMA. In this way, the TEMA is calculated.

How to apply the TEAM Indicator on the chart?
We will see that, how we can apply the TEMA indicator on the chart. For this purpose, we need to open any charting platform. I use Tradingview.com for applying the chart on the chart. After opening the chart TRX/USDT, we apply the indicator on the chart.
- You need to click the Indicator fx button.
- Then enter the name Triple EMA.
- Next, select the TEMA indicator as shown in the figure.
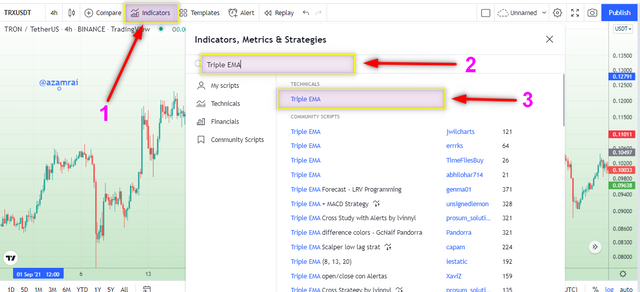
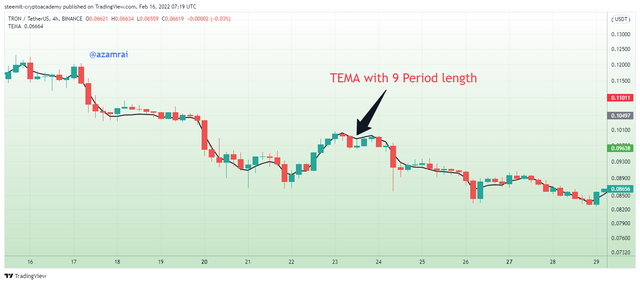
In the above, figure, you can see that the TEMA is applied on the chart. The by default length is 9. There are two main settings of this indicator that we can customize according to our trading strategy.

- Input Setting:
In this, we can change the period length. You can see the default length is 9 in the above section. Now, here I change the period length 55 from 9. In this way, we can easily change the period length.
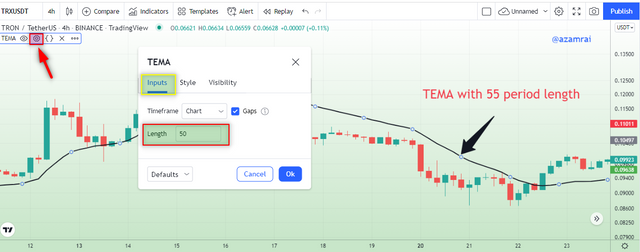
- Style Setting:
In this setting, we can customize the appearance of our indicator. we can change the color and thickness of the indicator line.

Question no 3
Compare TEMA with other Moving Averages. You can use one or two Moving Averages for in-depth comparison with TEMA.
I compare deeply two Moving Average Indicators with the Triple Exponential Moving Average. One is Simple Moving Average SMA and the second is the Weighted Moving Average WMA. Now we will see the difference between the results of these Moving averages used over the same period length.

Comparison TEAM with SMA
In the chart, I apply TEMA and SMA on the chart. I change the period length of both indicators to 50. Now both indicators working on a 50-period length. You can see that both moving average indicators produce different results even working on the same period length. Now we will that what the signals that were produced earlier and later from which indicator.
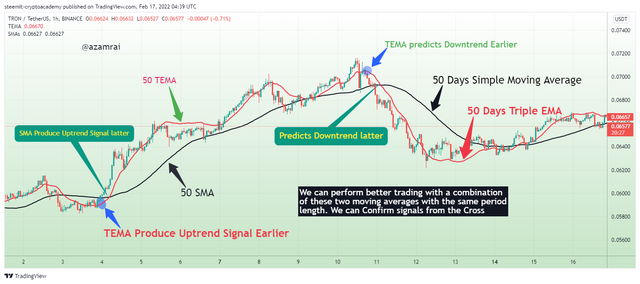
In the above figure, the TEMA is stickier with a price over the 50-period length and the 50 SMA is far away than TEMA. It means that the TEMA is more sensitive than SMA while working or same period length.
The TEMA produces the uptrend market or buys signal earlier than the SMA. You can see in the figure, that the TEMA crosses the price action first and place himself under the price action that indicates the uptrend earlier.
The TEMA produces the downtrend market or sells signal earlier than the SMA. You can see in the figure, that the TEMA crosses the price action first and place himself above the price action that indicates the downtrend earlier.
If we want to do trading with these two indicators after combining them, then it will be very beneficial for us. Because each indicator confirms its downtrend or uptrend signal by crossovers. We can use these crossovers for buying or selling opportunities.

Comparison TEAM with WMA
Now, I apply TEMA and WMA on the chart. I change the period length of both indicators to 55. Now both indicators working on a 55-period length. You can see that both moving average indicators produce different results even working on the same period length. Now we will that what the signals that were produced earlier and later from which indicator.
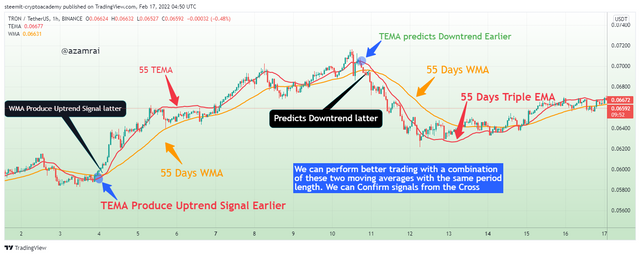
In the above figure, the TEMA is stickier with a price over the 55-period length and the 55 Weighted MA is far away than TEMA that indicating the TEMA is more sensitive than Weighted MA while working or same period length.
The TEMA produces the uptrend market or buys signal earlier than the Weighted MA. You can see in the figure, that the TEMA crosses the price action first and place himself under the price action that indicates the uptrend earlier.
The TEMA produces the downtrend market or sells signal earlier than the Weighted MA. You can see in the figure, that the TEMA crosses the price action first and place himself above the price action that indicates the downtrend earlier.
Both SMA and WMA produce the same result with the TEMA. The TEMA is producing a trading signal earlier than both moving average indicators. If we want to do trading with these two indicators after combining them, then it will be very beneficial for us. Because each indicator confirms its downtrend or uptrend signal by crossovers. We can use these crossovers for buying or selling opportunities.

Explain the Trend Identification/Confirmation in both bearish and bullish trends with TEMA (Use separate charts). Explain Support & Resistance with TEMA (On separate charts). (Screenshots required).
As we discussed in the above section, we can identify the current trend in the market and we can also easily determine the support and resistances using the TEMA indicator. Now we will see how it give us a signal of the trending market and identify the support and resistance.
Bullish Trend
When the market price lies above the Triple Exponential Moving Average indicator line, then it is indicating the bullish trend in the market. When the indicator line crosses the market price from top to bottom and places itself under the price action, then it indicates that the current bearish or sideways trend is about to end and the new bullish trend is about to start. We confirm the starting of the bullish trend when we found the TEMA line completely cross the price and market price trader above the indicator line.
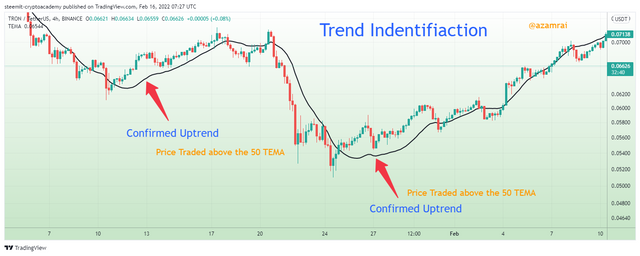
In the above, figure, you can see that the indicator line crosses the price and is placed under the price action. After this crossing, we can see that the market price is on an uptrend. In this way, we can easily identify and confirm the bullish trend in the market using the Triple Exponential Moving Average Indicator.

Bearish Trend
We also identify and confirm the bearish trend in the market by using the TEMA indicator. When the market price lies below the Triple Exponential Moving Average indicator line, then it is indicating the bullish trend in the market. When the indicator line crosses the market price from bottom to top and places itself above the price action, then it indicates that the current bullish or sideways trend is about to end and the new bearish trend is about to start. We confirm the starting of the bearish trend when we found the TEMA line completely cross the price and market price trader below the indicator line.
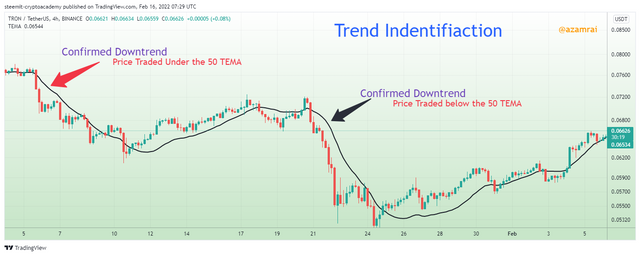
In the above, figure, you can see that the indicator line crosses the price and is placed above the price action. After this crossing, we can see that the market price is on a downtrend. In this way, we can easily identify and confirm the bearish trend in the market using the Triple Exponential Moving Average Indicator.
Determination of Support and Resistance using TEMA
As we discussed at the first, the TEMA is also used to identify the support and resistance level of a particular asset. We spot resistance and support levels by observing the price action and the indicator line movement.
When the market face rejection at the point of the TEMA line when the market is on an uptrend, then it serves as a resistance level of a particular asset. When the market is resisted by TEMA, it indicates that the current bullish trend is about to end and a new bearish trend is going to start. Traders identify the resistance levels for making the exit trading decisions.
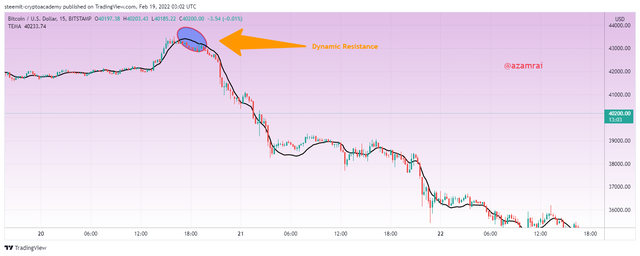
In the above figure, you can see that the price is resisted by the TEMA. After taking the resistance, the market is up downtrend. This resistance level allows making trading decisions regarding exit from the market.
On contrary, when the market fails to go further down and take support at the point of the TEMA line when the market is on a downtrend, then it serves as the support level of a particular asset. When the market is supported by TEMA, it indicates that the current bearish trend is about to end and a new bullish trend is going to start. Traders identify the resistance levels for making the entry trading decisions.
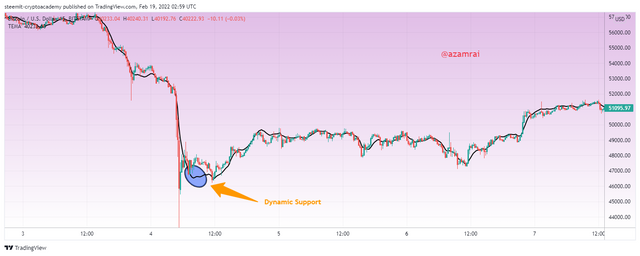
In the above figure, you can see that the price is resisted by the TEMA. After taking the resistance, the market is up downtrend. This resistance level allows making trading decisions regarding exit from the market.

Explain the combination of two TEMA’s at different periods and several signals that can be extracted from them. Note: Use another period combination other than the one used in the lecture, explain your choice of the period. (Screenshots required).
As we know, to perform trading using only with single indicator is not enough to get success in trading. We should use more than one indicator for performing technical analysis before making the trading decisions. So, we should do Confluence trading analysis in which several technical analysis tools are included.
So, to make the mature technical analysis of TEMA, we use two Triple Exponential Moving Average Indicators with different period lengths. In this way, we get several signals from the market using two indicators with different lengths. In this use large period length and time period.
I use a different period longer than a professor. I apply the TEMA on the chart twice and then change the color and period length. I open 1 Day chart of TRX/USDT pair and set the 200-period length of the first TEMA and change the color to black. Next, I change the second TEMA period to 55 and flip the color to red.
We get several signals from these two indicators when they make crosses. When the market is on an uptrend and 200 TEMA cross the 55 TEMA from bottom to upward direction then it indicates that the current bullish trend is about the end and a new bearish trend is going to start. The Market is still on a downtrend until both indicators hold a few distances between them. The higher the distance the strong the trend.
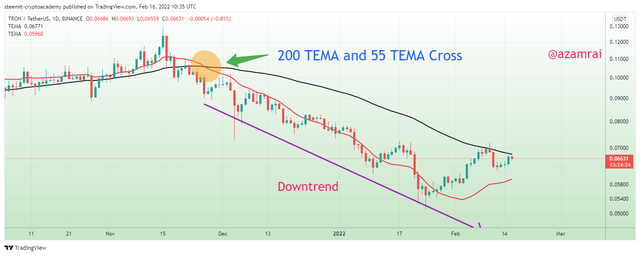
In the above figure, you can see that the cross is made by indicators. The higher TEMA crosses the lower TEAM from the bottom to the upward direction. After that cross, the market is on the way to a downtrend. We can use this bearish cross as an exit opportunity.
On contrary, when the market is on a downtrend and 200 TEMA cross the 55 TEMA from top to bottom direction then, it indicates that the current bearish trend is about the end and a new bullish trend is going to start. The Market is still on an uptrend until both indicators hold a few distances between them. The higher the distance the strong the bullish trend.
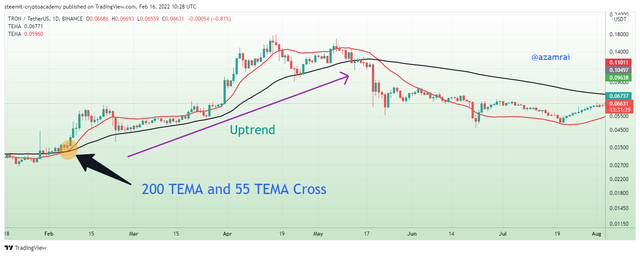
In the above figure, you can see that the cross is made by indicators. The higher TEMA (black Line) crosses the lower TEAM (red Line) from top to bottom direction. After that cross, the market is on the way to the uptrend. We can use this bullish cross for buy opportunities.

What is the Trade Entry and Exit criteria using TEMA? Explain with Charts. (Screenshots required).
As I mentioned above, we use two TEMA with different parameters to get an entry and exit signal from the market, for this purpose, I use different periods longer than a professor. I apply the TEMA on the chart twice and then change the color and period length. I open 1 Hour chart of the TRX/USDT pair and set the 55-period length of the first TEMA and change the color to red. Next, I change the second TEMA period to 21 and flip the color to black.
Buy Signal
When the market is on an uptrend and 21 TEMA cross the 55 TEMA from top to bottom direction then it indicates that the current bearish trend is about the end and a new bullish trend is going to start. We use this cross as buying opportunity. We need to wait for two more bullish candles after the cross. When two more bullish candles are formed, it is a confirmation signal of the uptrend. We need to place a buy order after two bullish candles.
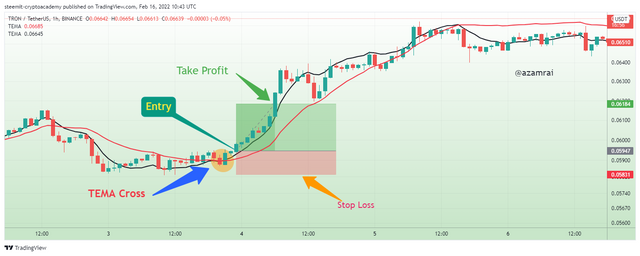
In the above figure, you can see that the cross is made by indicators. After the cross, we wait for two more bullish candles. After the formation of two bullish candles, I place a buy order with proper risk management. Stop Loss is set below the previous lows market and set the take profit level according to my risk-reward ratio. The Risk-Reward ratio is 1:2. You can see that market hit our take profit level.

Sell Signal
We can also get Sell signals by using these indicators. When the market is on a downtrend and 55 TEMA cross the 21 TEMA from top to bottom direction then it indicates that the current bullish trend is about the end and a new downtrend trend is going to start. We use this cross as a selling opportunity. We need to wait for two more bearish candles after the cross. When two more bearish candles are formed, it is a confirmation signal of a downtrend. We need to place a Sell order after two bearish candles.
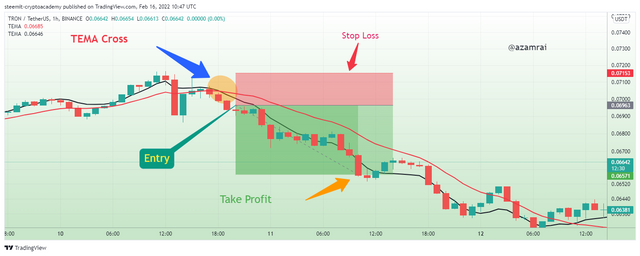
In the above figure, you can see that the bearish cross is made by indicators. After the cross, we wait for two more bearish candles. After the formation of two bearish candles, I place a sell order with proper risk management. Stop Loss is set above the previous high of the market and set the take profit level according to my risk-reward ratio. The Risk-Reward ratio is 1:2. You can see that market hit our take profit level.

Use an indicator of choice in addition to crossovers between two TEMA’s to place at least one demo trade and a real margin trade on an exchange (as little as $1 would do). Ideally, buy and sell positions (Apply proper trade management). Use only a 5 - 15 mins time frame. (Screenshots required).
Demo Trade
For placing the demo trade, I use the Paper Trading platform on tradingview.com. According to the requirement of the question, I use an additional indicator with two TEMAs with different parameters that are RSI. For Demo trade, I use to place buy orders after observing the buying opportunity that is made by two TEMAs.
I set the one TEMA period length to 50 and the second to 21. In this way, I get trading signals while the lines of indicators are made across. Now, I am looking at the cross on the chart in which 50 TEMA cross the 21 TEMA from top to bottom direction. After the cross, we need to wait for two consecutive bullish candles and the RSI should be under 50. When these candles are formed and RSI is below 50, then we need to place the buy entry at this stage.
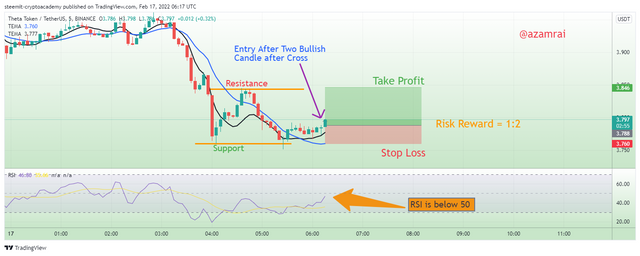
In the above figure, I found the same scenario on the THETA/USDT chart of 5 minutes. After the cross, the market makes two consecutive bullish candles. Now, at this stage, we can see that the RSI is below 50. After the confirmation, I place a buy order with proper risk management and identify support and resistances
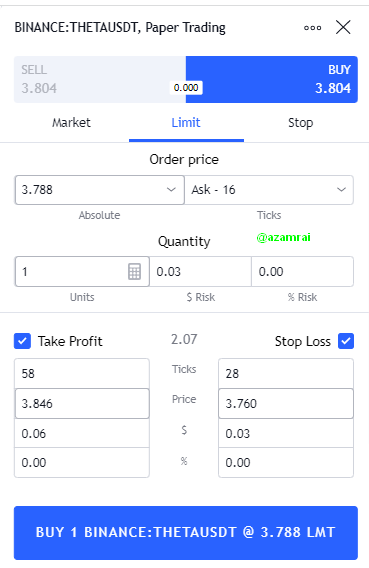
Entry Price= $3.788
Stop Loss = $3.760
Take Profit = $3.846
Risk Reward ratio= 1:2
In the following figure, you can see the trade details of buy entry and you can also notice that the order is placed on a paper trading platform.


Real Margin Trade
I chose Binance exchange to perform Margin trade. For this purpose, I am looking to the scenario that I required for placing the margin trade in which the Two TEMA made a bullish or bearish cross and confirm that signal with an additional indicator. Trade is placed after the formation of two bearish or bullish candles after the cross.
In this, I chose FTM/USDT pair for placing the Sell Margin trade. I found the same scenario on the chart. First, I set the chart time to 5 minutes and applied TEMAs twice with the parameters 21 and 50. I chose this period length because it is used for performing the short-term trading. I use Aroon Indicator as a confirmation tool with the period length of 14.
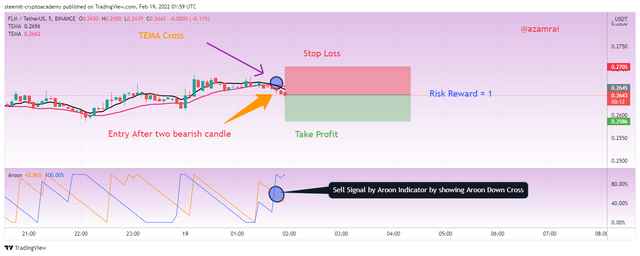
In the above chart, you can see that the TEMA made a bearish cross. We need to wait for two more bearish candles. You can see that; I place sell trade after the formation of two bearish candles after the cross. I use the Aroon as an additional indicator for confirming the signal. When Aroon Down crosses the Aroon Up line from bottom to upward direction then it indicates the sell signal.
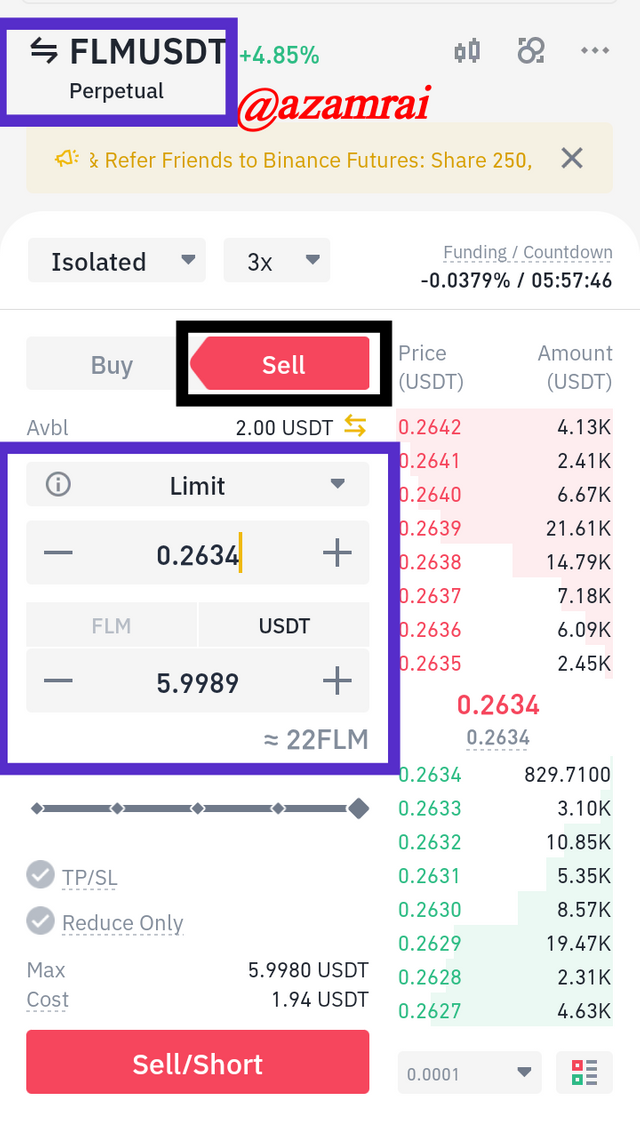
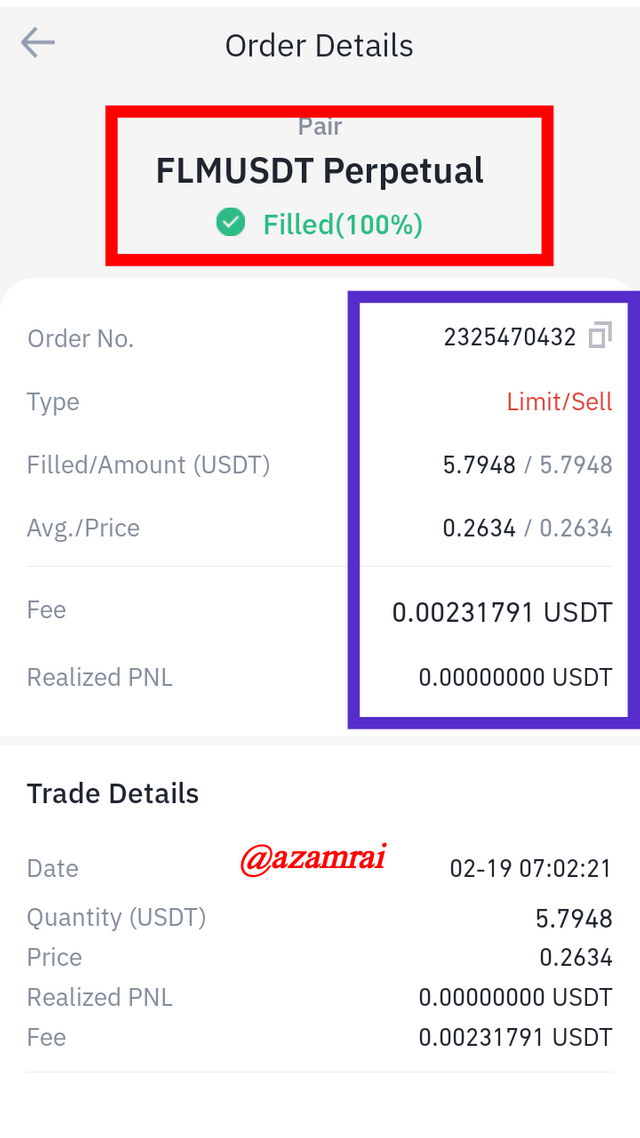
Entry Price= $0.2634
Stop Loss = $0.2694
Take Profit = $0.2575
Risk Reward ratio= 1
I transfer $2 dollar to margin wallet. I set the 3x leverage and perform isolate trade. In the above figures, you can see the sell order details. I place sell entry at $0.2634 and set the stop loss at $0.2694 and take profit at $0.2575. You can see the order execution details in the right figure.

What are the advantages and disadvantages of TEMA?
Advantages
- We easily get the current market trends by observing the placement of both price and the indicator line.
- It allows us to figure out the support and resistance level of a particular asset.
- It is produced results that are more accurate than other traditional moving average indicators.
- With the help of TEMA get to buy and sell signals using the TEMA crossovers.
- It is a combination of three EMAs which is why it produced better results than other moving averages.
Disadvantages
- It produced current results on the basis of previous data, which is why it produces sometimes false results.
- It produces late to buy or sell signals.
- We lose the best possible buying or selling positions when we perform trading using TEMA
- The period length is not defined for a particular trading style. Traders use different period lengths according to their trading style on the basis of their experience.
- When applying an extremely short period length, it produces false signals.

Triple Exponential Moving Average is a type of trend-based indicator that is used to get information about the current trend in the market. It tells us about the uptrend and downtrend market. It allows us to make trading decisions according to the current market scenario. It is basically designed after merging three Exponential Moving Average indicators.
When the indicator line crosses the market price from top to bottom and places itself under the price action, then it indicates that a new bullish trend is about to start and when the indicator line crosses the market price from bottom to top and place itself above the price action, then its new bearish trend is about to start.
When the market is resisted by TEMA, it indicates that the current bullish trend is about to end and a new bearish trend is going to start. When the market is supported by TEMA, it indicates that the current bearish trend is about to end and a new bullish trend is going to start.
