Very informative lecture in which I have learned about the basics of trading. Although these concepts are basic but very important. I try to answer all the questions in my own words. I hope it will help you to further understand the basics of trading.

What do you understand by trading? Explain your understanding in your own words.
It is a type of exchange in which we buy and sell assets from the market in order to make a profit. In trading, we buy at the low price and sell at the higher price and book profit by selling at high. This is actually meant by trading. There are several other elements involved in trading. It is not simple as it looks. There are many other complexities involved in it.
First of all, we need an exchange platform where we perform trading. There are many exchanges available in markets like Binance, Huobi, Bittrex, KuCoin, and Coinbase. We need to choose any one of them according to our choice. These exchanges provide liquidity for doing trading. Here we sell and purchase assets and start trading. We can buy and sell assets at any time on the exchanges. On every buys and sells orders, the exchange charge a few amounts of trading fees from our capital.
As I mentioned earlier, trading is not easy as it looks. There are several elements that drive the market. A person who wants to start a trader must know about these things. There are three types of analysis that traders do before going to invest. Fundamental analysis, Technical Analysis, and Sentimental Analysis. Majorly first two analyses are done by the traders.
Fundamental analysis is comprised of the information about supply and demand, System updates, burning, the financial and economic condition in a particular country. Traders take all these factors are taken into count before going to invest. Most fundamental analysis is done by long-term traders. They are actually investors who invest their money for a long time and huge profits.
Technical analysis is done on the basis of previous price movement of a particular asset. In this analysis, traders understand the psychology of small and large traders. The emotional factor is involved in it. In this analysis, traders predict the next move asset by observing the historical movement of price.
Traders make decisions after the identification of support and resistances through previous data. A number of tools available for doing technical analysis are candlestick charts, volumes, and a number of indicators. This analysis is mostly done by short-term traders.
So, this is all about trading. It is simple but for those who have knowledge of trading. Without analysis, its result only in the form of loss. Trading is a type of exchange of assets in which we sell and purchase after identification of suitable buy and sell positions.

What are the strong and weak hands in the market? Be graphic and provide a full explanation.
As we know that the crypto market is enough volatile. It is sometimes controlled by big whales. They manipulate the market by injecting a high volume of capital or taking an exit by executing huge selling. Due to this manipulation, the price of the particular asset goes up or down according to the scenario. So, this is a major problem for retail traders.
This unexpected manipulation hit their stop losses level and again price pull back at the same level. In this way, they generate artificial liquidity. This scenario indicates that there are two types of players that are involved in trading. One is a Strong Hand and another is a Weak Hand. We will discuss both of them.

Strong Hand In Market
In the crypto market, a Strong hand indicates the big whales or players who have a huge investment. They have a huge investment that is enough to manipulate the market. It may be one person, big financial institutions, and banks. When they entered the market, the price of a particular asset is affected.
When they perform buying in steps, then it hit the loss losses of retail traders to create the liquidity for their buying positions. When retail traders attract toward increasing in price then they perform buying at high. At this stage, big whales book profit by executing their sell positions. In this way, big whales earn profit by manipulating the market.
In the following figure, you can see the accumulation phase and distribution phase. In the accumulation phase, the big whales start buying. Due to high buy volume, the price of assets slows down. This attracts the small traders to take advantage of this situation. So, they execute their sell order without taking profit or facing loss.
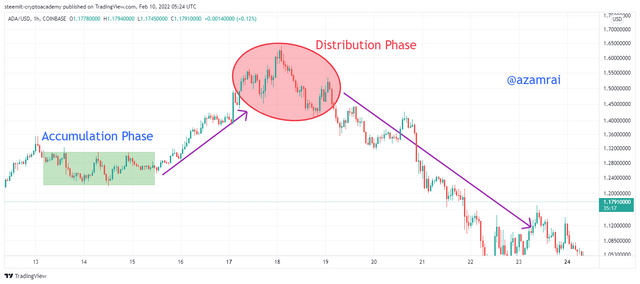
When small traders sell their assets, at the same time big whales acquire this liquidity that is created by small traders. So before entering the small traders into the market, the price of assets increased due to huge buying. When the market reaches its peak, they start selling. Selling with huge volume creates liquidity. It hit the stop loss level of retail traders. Retail traders come out of the market with a loss. In this way, big whales take advantage by manipulating the market.

Weak Hand In Market
This is the second category of crypto market players. The weak hand category is comprised of traders who have a small investment like me and you. Most of the time, weak hand players face loss in the crypto market due to market manipulation or investing due to uncontrolled emotions. When the price of assets is a little bit increased, the weak hand players attract and start buying.
In this situation, big whales start selling until the price hits the stop losses levels of weak hand traders. When prices hit most of the stop losses, it creates liquidity for the big players. So, again start buying and acquiring huge amounts of assets in the market. It caused to increase in price. When the price reaches up, they start selling and take profit from the market.

Which do you think is the better idea: think like the pack or like a pro?
Most of the traders invest their capital in particular assets after hearing the bullish news about assets. There are many social media platforms like YouTube and Twitter where the news of bullish and bearish runs of a particular asset are published. They thought that the people who predicted this bullish or bearish run are the most experienced traders.
Due to a lot of news about bullish and bearish, they start taking a position in the market due to their emotions. They invest without doing analysis. When traders invest due to their uncontrolled emotions, most of the time they face loss. So, investment under emotions is not a good sign.
When we hear about the bullish news of a particular asset, traders start thinking that the bullish run is about to start. But it is equally possible that the strategy behind the news is totally opposite. They give an indicator of the bullish run but at the same time, they plan to sell their asset when the price asset will increase due to those traders who invest their money with uncontrolled emotions.
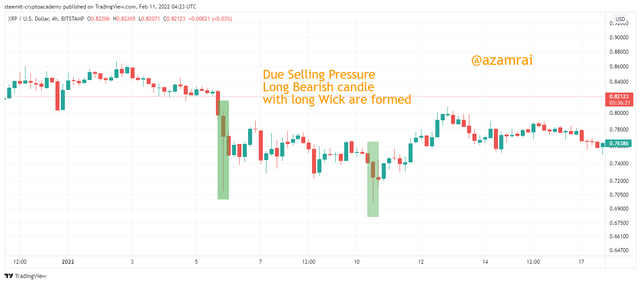
In the above figure, you can see the bearish candles with a long bearish wick. It indicates the selling pressure by big players. It might be possible that the crypto influencers or big whales published bullish run indicators before the price goes up. But when the price goes up, they start selling. That’s why the long candle with a long bearish wick is formed.
So, according to my perception, it is a better idea to think like a Pro. Because trading with emotions will lead you to loss. Think like Pro is the best way to get rid of losses due to emotional trading. Professional first identify the support and resistance levels and buy at low and sell at the high point.

Demonstrate your understanding of trend trading. (Use cryptocurrency chart screenshots.)
It is a well-known proverb in trading that “Trend is your Friend”. Because trading in trend is more profitable. First, it is necessary to identify the trend for taking the positions. It depends on the type of trend that is currently formed. For instance, if the trend is bullish, then they look at buying and if the trend is bearish then they look for selling positions.
There are many ways, tools, and techniques available that help us to identify the types of trends and the nature of the trend. We can identify the trend with technical indicators, Price actions, Identification of patterns, and structure formations. We try to identify the trend with Elliot Wave theory which is also used to identify of trend.
Elliot wave is a structure or pattern that is used to identify the trend in the market. It is comprised of patterns made by price action. The pattern of the Elliot wave is formed due to the psychology of the traders. It is comprised of two waves. The first wave is the impulse wave and the second wave is the correction wave.
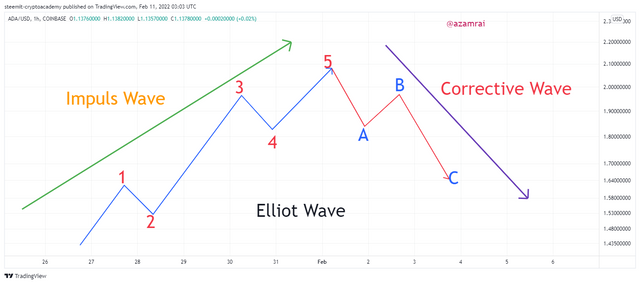
Traders identify this wave for taking the position in the market. If the price action formed a bullish wave, then it indicates the bullish trend. Trader seeks to find out the buy position. On contrary, if the wave is bearish, it indicates the bearish trend. Trader seeks to find out the sell position.
An impulsive wave is a combination of 5 waves. And the corrective wave is comprised of 3 waves. An impulsive wave is a trend wave and the corrective wave is indicating the trend reversal. Now will see how this wave formed and what are the rules for the formation of the Elliot Wave.
In the impulse wave, there is a total of 5 waves. Three of them are bullish waves and two of them are retracement waves. The correction is comprised of 3 waves. A B and C. Wave A and B are trend reversal waves and B is retracement waves. There are a few rules behind the formation of this whole wave.
- Wave 2 low should be higher than the wave 1 low and wave 4 low must be higher than the low of the previous wave 2.
- Wave 5 high is higher than the previous wave 3 high and wave 3 should be higher than the previous 1st wave.
- Wave number 3 should be the longest wave among all waves.
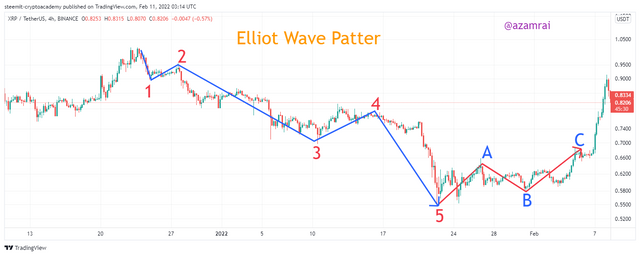
If we talk about the correction wave, it is formed after the formation of the impulse wave. When the price of an asset fails to further move up then the corrective wave is formed. In this wave, there are three waves. One is retracement named B and two are reversal wave names A and C.
Wave A shows the reversal after the formation of the 5th wave of an impulsive wave. Wave B shows a little pump and again it goes down and formed wave C.
In this way, the Elliot wave is helpful to find out the trend. Traders do trend trading with help of Elliot Wave.

Show how to identify the first and last impulse waves in a trend, plus explain the importance of this. (Use cryptocurrency chart screenshots)
Identification of First Impulse Wave
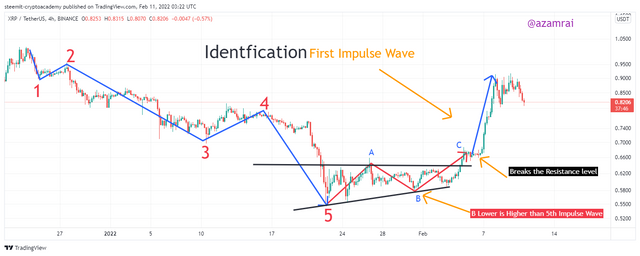
First impulse wave is identified after the formation of a corrective wave of Elliot wave structure. In case of a downtrend, the corrective wave works as a bullish run. For clear identification of First Impulse, we observe the formation of B and C waves of corrective wave. When the Low of B wave is higher than the low of A wave and the high of C wave is higher than the high of A wave then it, we can say that the wave after the C wave is the First Impulse wave. When this condition is satisfied, it indicates the new trend is going to start.

Identification of Last Impulse Wave
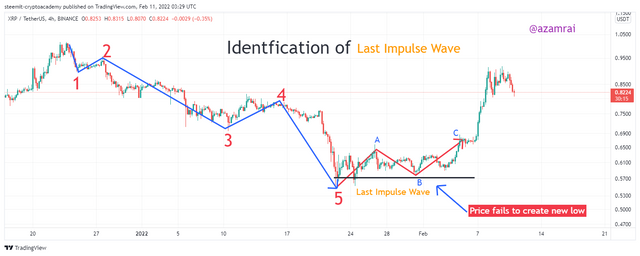
Last impulse wave is identified after the formation of all 5 impulse waves. After the 5th wave, if the market fails to create a new high or low in both uptrend and downtrend scenarios then it is considered as the last impulse wave of the Elliot wave concept. In other words, if the Low of waves A, B and C is higher than the wave 5th impulse wave then it is considered as the last impulse wave.

Importance of these Waves.
The first impulse wave is very important. Because this wave allows traders to pick the asset on time at a low price. Traders also avoid selling assets when price makes other impulse waves. The first impulse wave does not allow the trader to sell when reversal impulse waves are made. On the other hand, the last is to help the trader to get the best sell opportunity in order to make a good profit after the formation of the last impulse wave. In this way, both first, and last impulse wave has great importance in trading.

Show how to identify a good point to set a buy and sell order. (Use cryptocurrency chart screenshots)
Buy Order
As we discussed the first impulse wave in the previous section, this is the best time for a buy position. When we identify the first impulse wave after the formation of corrective waves then we place a buy order after the end of C last wave of corrective wave. Because it indicates the new bullish trend is about to start.
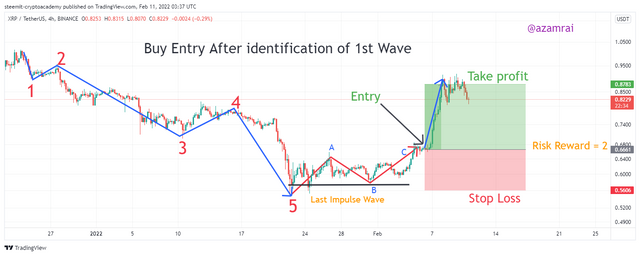
So, I place a buy order at the start of a new trend after the end of the last corrective wave. I set the stop loss under the low wave B. In this way, my stop loss is not easily hit by little market manipulation. And take profit is set near the resistance level that is high of the Impulse wave 4. In the above figure, you can see buy order and risk management.

Sell Order
As we discussed the Last impulse wave in the previous section, this is the best time for the Sell position. We identify the Last impulse wave when corrective waves fail to create a new high then we place a Sell order when last wave C breaks the Low of the 4th impulse wave and B corrective wave. It also works as a break the structure. It indicates the bearish trend is about to start.
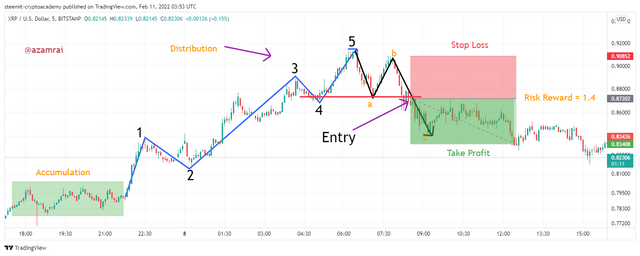
So, I place a sell order at the breaking structure point. I set the stop loss above the high of wave A. In this way, my stop loss is not easily hit by little market manipulation. And take profit is set near the resistance level that is high of the Impulse wave 2. In the above figure, you can see Sell order and risk management.

Explain the relationship of Elliott Wave Theory with the explained method. Be graphic when explaining.
In the above section, we have learned about the strong and weak hands that are playing in the market. We also learned how strong hands drive and manipulate the market. In the next section, we have learned about the accumulation and distribution phases of Elliot Wave. Now we will understand the relationship between them.
If we first look at the Elliot wave in the above section, we clearly see the accumulation and distribution phases are mentioned. Before the formation of the Elliot Wave, we can see the accumulation phase. By observing the accumulation phase, traders easily notice the movement of professional traders and observe how they play in the market.
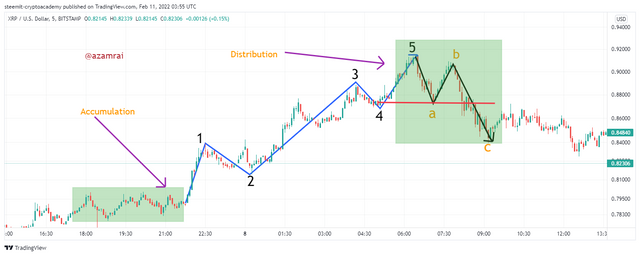
The accumulation phase gives the indication of a new trend is about to start. In this phase, big whales fill the buy positions that the new trend is about to start. On Contrary, the distribution phase is identified after the formation of the last impulse wave. You can see in the figure, after the formation of the 5th impulse wave, whales close their positions and the distribution phase is start. In this way, normal traders identified the distribution phase through the formation of the last impulse wave and place sell entry after the confirmation of distribution.

It is a type of exchange in which we buy and sell assets from the market in order to make a profit. There are three types of analysis that traders do before going to invest. Fundamental analysis, Technical Analysis, and Sentimental Analysis.
In the crypto market, a Strong hand indicates the big whales or players who have a huge investment. They have a huge investment that is enough to manipulate the market. The weak hand category is comprised of traders who have small investments like me and you.
According to my perception thinking like a Pro is the best way to get rid of losses due to emotional entries. By observing the accumulation phase, traders easily notice the movement of professional traders and observe how they play in the market. In this way, normal traders identified the distribution phase through the formation of the last impulse

@azamrai - do not use the #club100 tag - you do not qualify for it at all.
Downvoting a post can decrease pending rewards and make it less visible. Common reasons:
Submit
Ok, thank you.
Downvoting a post can decrease pending rewards and make it less visible. Common reasons:
Submit