
1.)What is Vortex Indicator and it is Calculated?
First of all, we need to know when the concept of Vortex Indicator was introduced and who introduced it. The concept of Vortex Indicator was introduced in 2010 by two scientists Etienne Botes and Douglas Seipman.
Basically, the concept is taken from another technology that was developed by a scientist "J. Wells Wilder". Its main purpose was to observe the behavior of the waves on the surface of the water. Updating the same concept, it was renamed Vortex Indicator.
Vortex Indicator is used to indicate the changing trend in the market. it is also used for confirmation of trend that presented at the current time. When these two lines Cross each other, the attitude of the market changes. Remember, the market trend goes upwards or downwards. Estimate the ups and downs.
Vortex Indicator consists of two lines that reflect the market trend. One line is called + ve line and the other line is called -ve. They have different colors. The blue line has started the positive and bullish trend while the red line shows the bearish trend.
When the blue line crosses the red line from bottom to top, it shows the bullish market. This means that the market is trending upwards, prices are rising. When the blue line crosses the red line from bottom to top, it tells us that we can buy a base.
On the other hand, if the negative line crosses the positive line from the bottom to the top, what it does to the bearish market means that prices are falling. And it gives us a signal that we must sell our assets. Because prices are falling.

Also, here are some things to know about Vortex Indicator.
- The strength of the market trend depends on the distance between the blue and red lines.
- In this concert we can only buy and sell assets when these lines cross each other.
- If the blue and red lines are close to each other and do not cross each other, they indicate market uncertainty.
How the Vortex Indicator is Calculated?
Now we will talk about how to calculate. Here are some steps you can take to begin the process of preparation for mediation.
- Trend Establishment: To measure Vortex Indicator, we first establish the trend. To this end, we calculate the distance between past and present period brothers and people. If the high parade comes after the low parade, the price movement will be positive.
Choose the Parameter Length: It is very important to set the parameter length to calculate the Vortex Indicator. According to scientist Wells Wilder, the length of a parameter is usually 14 minutes, 14 hours, 14 days, 14 months and so on. "If we also want to circulate Vortex Indicator well, we should calculate Vortex Indicator at the same interval," he said. - Range Calculate: Calculation of Vortex Indicator is possible only after calculating the range. Therefore, according to the scientist, we can calculate the correct range if we subtract the current from the current to the high. then should also subtract the current high from current low of previous close.
If we follow these steps, we can easily calculate Vortex Indicator.
2.)Is Vortex Indicator Reliable?
Like all other indicators, the Vortex indicator is not as reliable because if it is reliable, no trader will incur a loss. People who trade also face losses at some point. Vortex Indicator is to anticipate future prices. These indicators estimate future prices by looking at past price fluctuations and this may not be entirely accurate.
The Vortex Indicator cannot fully predict the total value of the bitcoin. Its only function is to estimate. But if the trader knows how to use it properly, it can be reliable.
This indicator can be trusted if a trader uses this indicator from his experience and analysis.
3.)How is the vortex indicator added to a chart and what are the recommended parameters? (Screenshot required)
To the vortex indicator in our chart we need to follow the following steps.
- First we click on the Indicator Button as shown in figure.

- Next text appear, Here enter the name of indicator that Vortex indicator. as shown in figure. Click on the Vortex indicator. After clicking the vortex indicator is added to our chart.

Here we can see our Vortex indicator chart is added successfully.

How to Configure our Chart
For this purpose we need to click on the our vortex char and tap is appear as shown in figure and click on the setting button.

Here is input tap here we can customize the length by adding the number in the text and as change the indicator time frame. After adding the number click ok.

Next Tab is style. here we can add the style of bullish line and bearish line. we can change the color of the line. after changing Click oK.

Next Tap is Visibility, this tab is remain as it. it not frequently used. we can change all the term that are presented in the figure.

In this way we can configure Vortex indicator.
4.)What is Vortex Indicator Divergence? explain with Examples.
Vortex Indicator Divergence indicate when the both chart and the indicator moves in the opposite sides. Basically, there are two types of divergence one is called bullish divergence and other bearish divergence. There are two lines in vortex divergence. One is blue positive line that indicates the positive trend in the market, and other is Red line that indicate the negative trend in the market. Blue line indicate the Bullish Divergence and Red Line indicates the Bearish Divergence.
- Bullish divergence is occurred when the chart price movement goes down or lower high and blue positive line is moving up. This is condition indicates the buy signal of the trader.

- On the other side Bearish divergence is opposite to Bullish divergence. It is occurred when chart price moves upward for short period of time and then do down, and the red line that is negative trend line moves toward lower high. This situation generates the sell signal toward trader.

5.)Use the signals of VI to buy and sell any two cryptocurrencies. (Screenshot required)
By the help of Vortex Indicator I bought two cryptocurrencies named as XRP Ripple and other TRX with the token pair of USDT. First of all we look at the XRP token, I open the chart on the coinmarketcap website and on the Vortex Indicator. Here you see blue line cross the red line from bottom in the figure here is the signal of buy the asset.
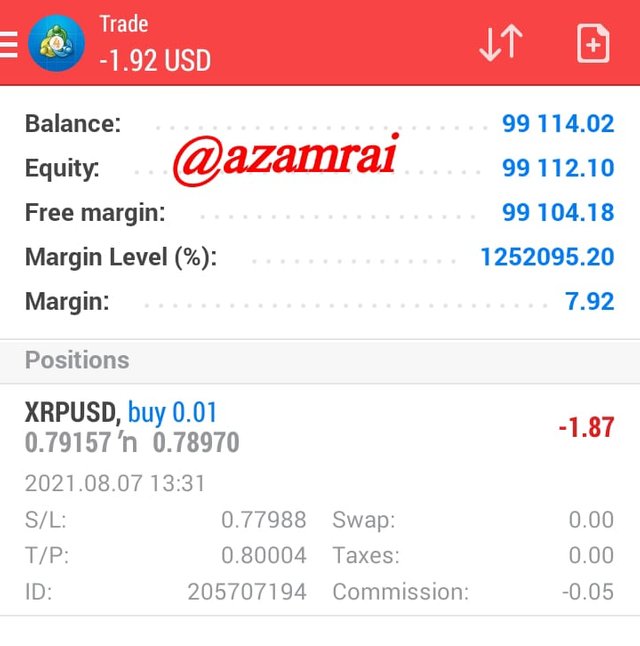
This is the Demo trading. I do this for the sake of understanding. Here I mention the the point where buy signal is blink. In the figure you see the buy signal mention. Here I bought XRP.
Buy XRP

Here is the my demo trading account on Metatrader 4. You can see I place the order of XRP.
Buy TRX
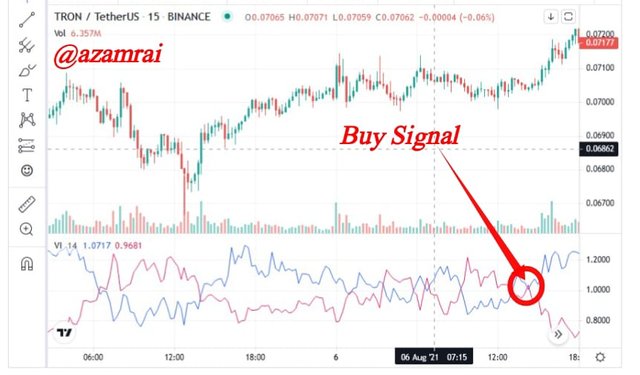
Here is second token that bought with the help of Vortex Indicator. Same process as ripple I mention the point where market of TRX is going to bullish. It indicates the buy signal. Here we should buy the TRX token. When blue line cross red line form bottom up then it is signal of buying. Here I bought TRX. Buy Signal is mentioned in figure.
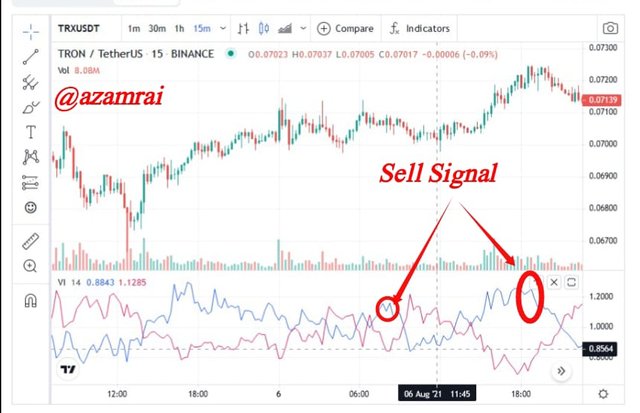
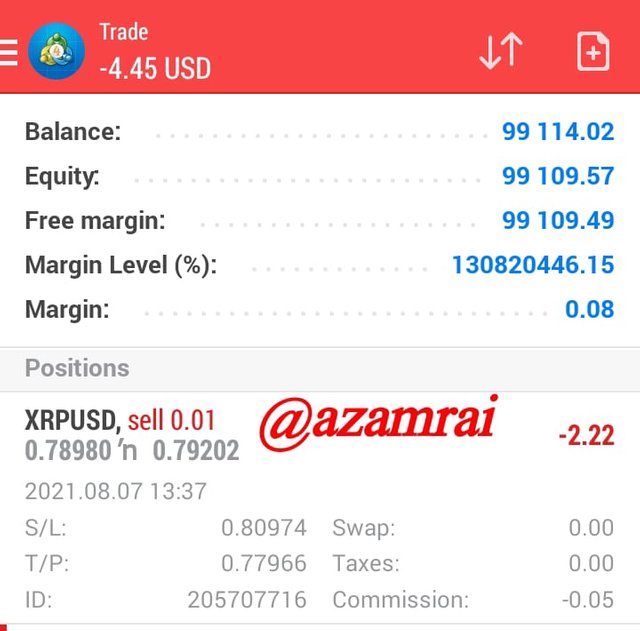
Next is to find the selling signal by the help of Vortex Indicator. Here I mention all the point where Vortex Indicator display selling signal to trader. On this point trader should sell their assets because market is going to bearish. Here two selling signals are mentioned in the figure.
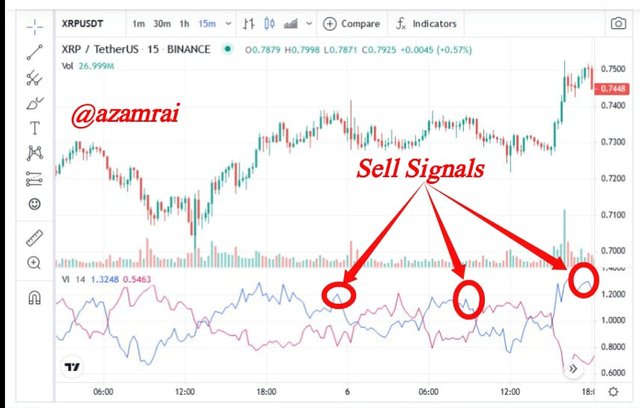
Next process is to wait for blink the sell signal, when market is going to bearish. When market is ready to bear then this indicator alert the trader to sell asset. In this way I figure out all the Selling signals that are presented in the figure where market is going to bearish.
Conclusion
If we want to detect the trend of market and confirm that trend the vortex indicator is used. It is not very accurate but, if apply this indicator with our previous trading experience then it will be profitable for us. In the presence of other indicator the use of this vortex indicator is a risky decision, but if we apply vortex indicator with MACD indicator then it will display positive result.
Hi @azamrai, thanks for performing the above task in the sixth week of Steemit Crypto Academy Season 3. The time and effort put into this work is appreciated. Hence, you have scored 6 out of 10. Here are the details:
Remarks
You displayed a good understanding of the topic. That said, we were hoping to see more depth and originality.
Downvoting a post can decrease pending rewards and make it less visible. Common reasons:
Submit
Thank you professor @asaj, I will try my best to work hard for further details next time.
Downvoting a post can decrease pending rewards and make it less visible. Common reasons:
Submit