
This is a very informative lecture on Double top, Double bottom, Rising, and Falling Wedge patterns that are used in trading. We can take benefit from these patterns. These patterns help users to identify the bullish and bearish reversal in the market. I try to answer all the questions about these patterns. I hope it will help you to understand the concept of these patterns.

Explain in your own words the concept of Double Top, Double Bottom, and Wedge. How to interpret each one?
As we know the market is enough volatile. The price of the market increases and decreases by making the different shapes and patterns on the chart. We note and identify patterns those pattern that gives reason to the market price to show bullish or bearish behavior.
After the formation of these patterns, Price is increased and decreased. So, Next time traders keep in mind that particular structure or pattern that is caused to bullish or bearish reversal last time.
There are several patterns and structures that are made by a price that is used to identify the possible reversal in the market. Double Top, Double bottom, rectangle, triangle, cup and handle, head and shoulder patterns are some of them. Now we will discuss the double top, Double bottom, Rising Wedge, and Falling Wedge.

What Double Top pattern?
It is the M shape pattern that is made by price on the chart. It is known as a bearish pattern. It is made by price when the market is on an uptrend. After the formation of this pattern, the market will be going down. Trader’s use identifies this pattern to take an exit from the market. After the formation of a double top, we can say that the trend is about to change. So, take safety measures before bearish reversal.

What Double bottom pattern?
It is the W shape pattern that is made by price on the chart. It is known as a bullish pattern. It is made by price when the market is on a downtrend. After the formation of this pattern, the market will go in an upward direction. Traders use this pattern to make an entry into the market. After the formation of double bottom, we can say that the trend is about to change. So, take safety measures before bullish reversal.

What is the Wedges Pattern?
Wedge patterns are also made due to the fluctuation of market prices on the chart. The wedge pattern is made to higher highs, higher lows, higher lows, and lower highs. In this, we use two trendlines to connect the higher highs and higher lows. Both trendlines are wide at the start of the wedge pattern and come close to narrow at the end of the Wedge pattern.
Now we will discuss two types of Wedge patterns. One is the Rising Wedge pattern and the Second is the Falling Wedge pattern. The rising wedge pattern is a bearish reversal pattern and the Falling wedge pattern is a bullish reversal pattern.

Main differences between the Double Top and the Double Bottom. Show screenshots.
How to Identify the Double top pattern?
As we discussed above, the double top pattern is close to the M shape. It is formed when the market is on an uptrend. First, the price increased and make it high similar to the First Peak of the M shape. After that, the price fell down and take support and make Middle support of M Shape and again increased to make the second peak of M shape. In this pattern, the market price faces resistance twice at the same top-level and the price pulls back.
In this way, the market price makes two peak highs at the same high level. After rejection, the price decreased enough and even the middle support level of the M shape is broken. After that the price retest the middle support level of M shape. When price retests the middle support M shape that is working as resistance then it is confirmation of Bearish reversal.
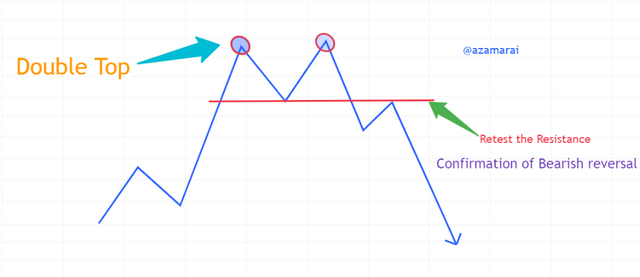
In the above figure, you can see the double top pattern is shown. It is a graphical representation. We will see the real example of a double top pattern in the next question. In this pattern, you can see that the price makes two peaks and faces rejection. After that, it goes down and retests the bottom resistance level of the M shape. It confirms the bearish reversal.

Double bottom pattern?
The Double bottom pattern is close to the W shape. It is formed after when marketing downtrend. First, the price decreased and make low similar to the first Peak low of W shape. After that, the price Increased and take resistance and makes the Middle resistance of W Shape and again decreased to make the second low peak of W shape. In this pattern, the market price takes support twice at the same peak bottom level and the price pulls back.
In this way, the market price makes two peak lows at the same low level. After taking support, the price increased enough and even the middle resistance level of the W shape is broken. After that the price retest the middle support level of the W shape. When price retest the middle support W shape that is working as support then it is confirmation of Bullish reversal.
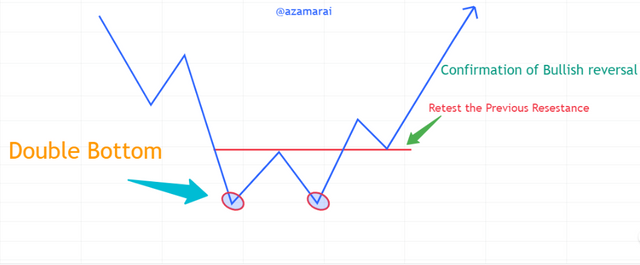
In the above figure, you can see the double top pattern is shown. It is a graphical representation. We will see the real example of a double top pattern in the next question. In this pattern, you can see that the price makes two peaks and faces rejection. After that, it goes down and retests the bottom resistance level of the M shape. It confirms the bearish reversal.

Explain and highlight the main differences between a bullish wedge and a bearish wedge. Show screenshots of each.
What is the Rising Wedge pattern?
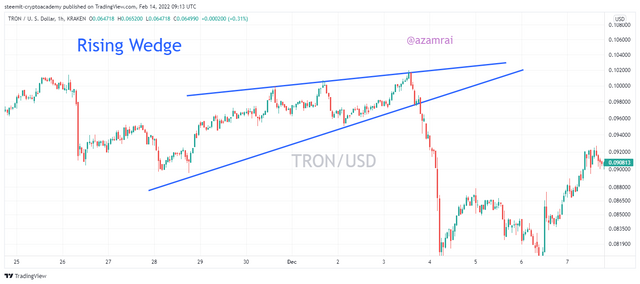
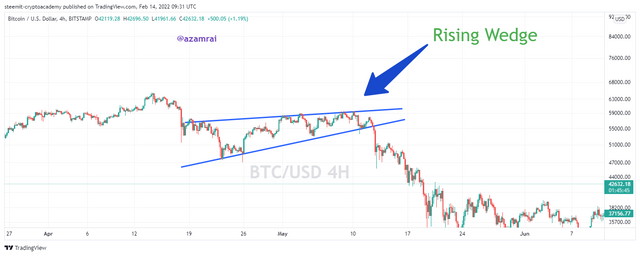
It is working as the bearish reversal pattern. The formation of the rising wedge is not bound to only after a downtrend. It can be made anywhere on the chart. In this pattern, the market price makes higher highs and higher lows. We connect all the higher highs with the Upper trendline and connect all the lower highs with the bottom trendline.
The bottom trendline is wide from each other at the beginning. But they come close to each other gradually due to small higher highs and higher lows at the end of the rising wedge pattern.
At the end of the rising wedge, the price breaks the bottom trendline and goes down. Again, price retest the bottom trend line. It is a confirmation signal of bearish reversal. This rising wedge is a bearish pattern in about 82% when it breaks the bottom trend line.
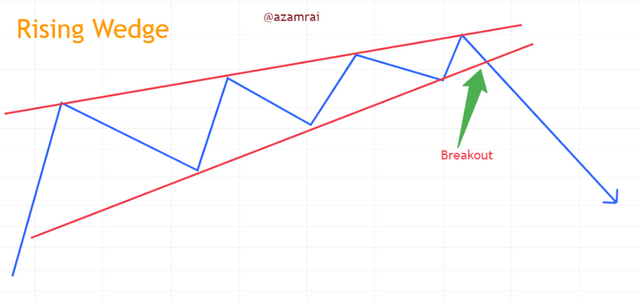
In the above figure, you can see the Falling Wedge pattern. In this, you can see that price makes higher highs and higher lows. The trendlines connect all the higher highs and higher lows. At the end of the pattern, it breakout the bottom trendline and the market goes down. In this way, we can identify the falling wedge pattern in order to take benefit from the market.

Falling Wedge pattern?
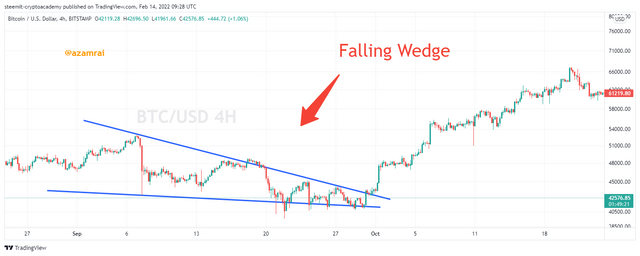
It is a bullish reversal pattern. The formation of the falling wedge is not bound to only after the uptrend. It can be made anywhere on the chart. In this pattern, the market price makes higher lows and lower highs. We connect all the higher lows with the Upper trendline and connect all the lower highs with the bottom trendline.
Both bottom and upper trendlines are wide from each other at the beginning. But they come close to each other gradually due to small higher lows and lower highs at the end of the falling wedge pattern.
At the end of a falling wedge, the price breaks the upper trendline and goes up. Again, price retest the upper trendline. It is a confirmation signal of bullish reversal. It is a successful bullish reversal. The success rate is about 82% when it breaks the upper trendline.
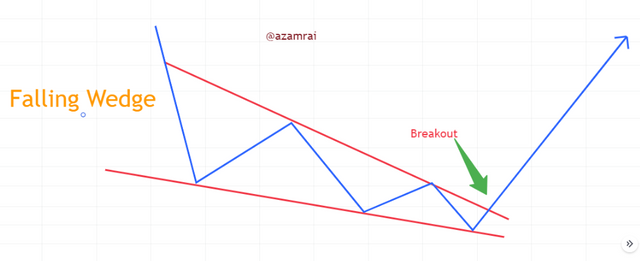
In the above figure, you can see the rising wedge pattern. In this, you can see that price makes higher lows and lower highs. The trendlines connect all the higher lows and lower highs. At the end of the pattern, it breaks the upper trendline and the market goes up. In this way, we can identify the rising wedge pattern in order to take benefit from the market.

Explain the volatility that usually exists with respect to the volume in the wedges. When is there usually more volume? What happens if a pullback breaks the support of a wedge?
When the wedge pattern is forming, the volume of assets is decreased as you can see in the figure. When we talk about the volatility that also exists while the formation process of the wedge pattern. At the start of the Wedge pattern formation, the volatility of asset particular asset is high but when the higher highs and higher lows of an asset come close to each other at the end of the Wedge pattern, then volatility is also decreased as volume is decreased.
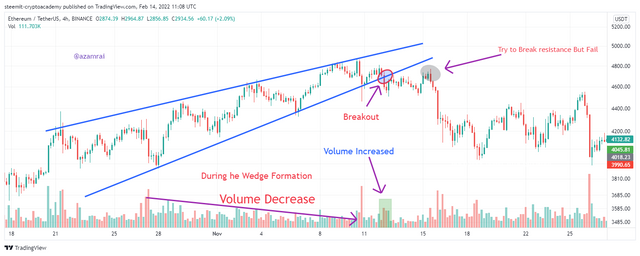
In the above figure, you can see that the volume of assets is decrease while the formation of a wedge pattern. When the volume is decreased, it affects the volatility of assets. The volatility of assets is also decreased. When the price breaks the support trendline, the volume is usually high. Sometimes price tries to break the resistance level but fails. It is the confirmation of trend reversal.
When the price pulls back breaks the resistance level after breakout then this particular wedge pattern is not real. Because it is not included in the formalities of wedge patterns. So, we need to avoid these wedge patterns.

Find and analyze the double top pattern on at least 2 charts. Show your own screenshots.
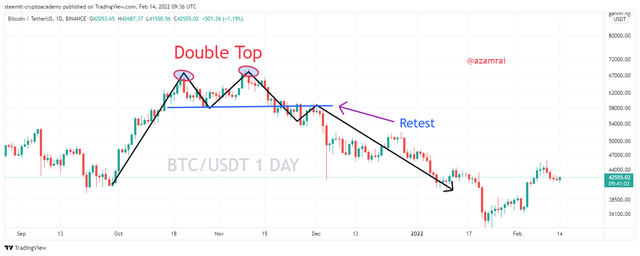
In this, I figure out two double top patterns on the chart. You will see the same condition in these patterns. All the formalities about the double top patterns are fulfilled in these patterns. The pattern is taken from applying the Pair BTC/USDT after applying 1 Day period length. In this double top pattern, you can see that price two highs at the same level. After that, the price makes a reversal and breaks the middle resistance. In this way, it is a double top pattern that is identified.
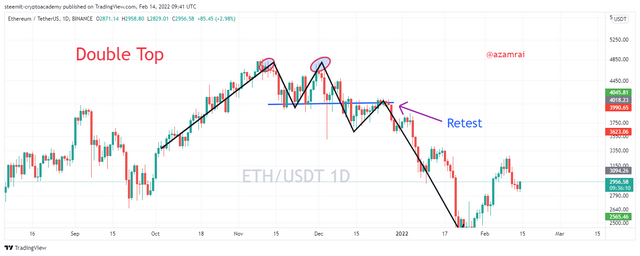
This is another double top pattern that is identified on pair ETH/USDT 1DAY chart of 1 day period length. In this double top pattern, you can see that price two highs at the same level. After that, the price makes a reversal and breaks the middle resistance. In this way, it is a double top pattern that is identified.

Find and analyse at least 2 rising wedges and 2 falling wedges on at least 2 charts. Show your own screenshots.
Falling Wedge Pattern
In this, I figure out two falling wedge patterns on the chart. You can see the same condition in these patterns. All the formalities about the falling wedge pattern are fulfilled in these patterns. The pattern is taken from applying the Pair BTC/USDT after applying 1 Day period length. In this falling wedge pattern, you can see that price makes higher lows and lower highs. You can see that after breaking the upper trendline the price follows the bullish run.
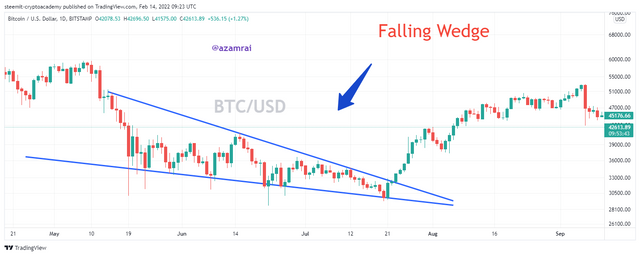
This is another falling wedge pattern that is identified on pair BTC/USDT 4H chart of 4 hours period length. In this falling wedge pattern, you can see that price makes higher lows and lower highs. You can see that after breaking the upper trendline the price follows the bullish run.

Rising Wedge Pattern
In this, I figure out two Rising wedge patterns on the chart. You can see the same condition in these patterns. All the formalities about rising wedge patterns are fulfilled in these patterns. The pattern is taken from applying the Pair TRON/USD after applying the 1H period length. In this rising wedge pattern, you can see that price makes higher highs and higher lows. You can see that after breaking the bottom trendline the price follows the bearish run.
This is another rising wedge pattern that is identified on pair BTC/USDT 4H chart of 4 hours period length. In this rising wedge pattern, you can see that price makes higher lows and lower highs. You can see that after breaking the lower trendline the price is on the way to a bearish run.

Importance of patterns in technical trading.
The pattern has great importance in the market. Patterns are made by the psychology and emotion of traders. The psychology of traders is behind the formation of all the patterns. They get huge benefits from the market after the identification of this pattern. As we discussed in the above section, that is how prices increased and decreased after the formation of these patterns.
Traders categorize the pattern into two types. One is bearish reversal patterns and the other is bullish reversal patterns. Traders use bullish reversal patterns for identification Buy positions and use bearish patterns for identification of Sell positions. In this way, we get more acquire buy and sell positions and get more benefit from the market.
They also set their stop loss and take profit level after the identification of these patterns. They use patterns for the identification of support and resistance levels after the breakout. Mostly they make entry and exit after the breakout or break down the patterns.

Do you find it effective to use these patterns in trading? Justify your answer.
New Pattern indicates that the market is going to behave as it behaves in the market in the last couple of times. I find myself profitable while trading with patterns. Because there is a higher chance of market to behave in the way as we expected. I have done trading using the pattern several times.
I have traded with triangle patterns. I have earned profit by taking an entry and exit from after identification of patterns. Some patterns are made by price are most often. Every time I found these patterns effective. Because after the breakout, the price behaves the same as we expected.

There are several patterns and structures that are made by a price that is used to identify the possible reversal in the market. Double Top, Double bottom, rectangle, triangle, cup and handle, head and shoulder patterns are some of them.
It is the M shape pattern that is made by price on the chart. It is known as a bearish pattern. Double bottom is the W shape pattern that is made by price on the chart. It is known as a bullish pattern. It is made by price when the market is on a downtrend.
It is formed when the market is on an uptrend. First, the price increased and make it high similar to the First Peak of the M shape We will see the real example of a double top pattern in the next question. In this pattern, you can see that the price makes two peaks and faces rejection

Gracias por participar en la Sexta Temporada de la Steemit Crypto Academy.
Espero seguir corrigiendo tus futuras asignaciones, un saludo.
Downvoting a post can decrease pending rewards and make it less visible. Common reasons:
Submit
Thank you professor @imagen, I will do my best in future.
Downvoting a post can decrease pending rewards and make it less visible. Common reasons:
Submit