
This is a very informative lecture on price action. I have learned, how to trade by just observing the price action of a particular. Asset. It is really helpful. We do not need depth knowledge of trading using the price action. Now try to answer the questions in my own words.

Explain your understanding of price action.
As we know that the price market price fluctuates on the basis of several things like different news, updates in the system, link with big organizations, listings on exchanges, and the psychology of traders. The market price is derived from these factors. All these factors are included in different analyses (like fundamental, sentimental, and technical analyses) that we do while trading.
One of the major analyses is technical analysis. In these analyses, we understand the current market situation by observing the price actions. The analysis through the price action totally depends on the previous price movement. It means that the market will behave the same in the current scenario as it behaves in the past. Price action is analyzed in technical analyses. Price is the major element of technical analyses. In the price action, the market is driven by the psychology of the traders.
Traders identify the support and resistance level by observing the market moves. This is the common scene of traders taking an entry at the support level and exit on the resistance level. This is why we noted that mostly the market pulls back after support and resistance level. They decided their entry and exit point after observing the support and resistance after observing the price actions.
We can get enough information about the market by observing the price action. We cannot able to get the information about the demand and supply of particular assets by doing the fundamental analyses but with the help of price action, we can determine the supply and demand.
We can identify the previous support and resistance level for the purpose of deciding the entry and exit points. We can identify different patterns by observing the price action. These patterns help us to predict the future move of the market.

What is the importance of price action? Will, you chose any other form of technical analysis apart from price action? Give reasons for your answer.
Price action has great importance in the analyses of a particular asset. Now we will see what are things that made the price action important.
Identification of Market Structure
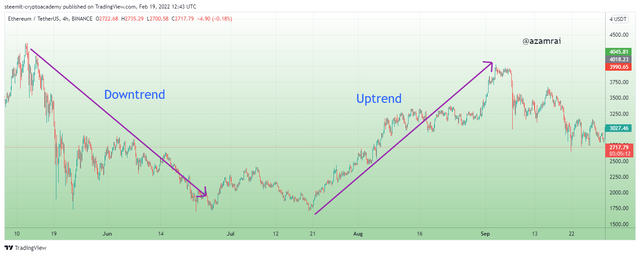
We can determine the current market trend with the help of price action. We need to just look at the price action, then we get the information about the trend that is presented in the market. We easily identify the current trend and trend reversal points. We also get information about the supply and demand of particular assets that help to predict the future move.

Determination of Traders Psychology
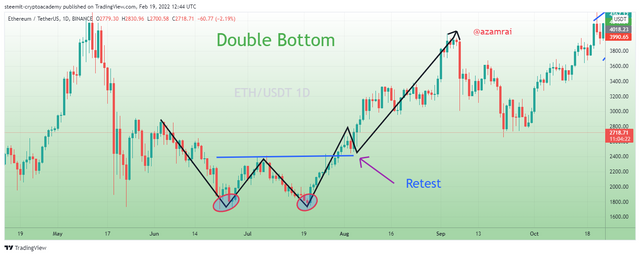
Few percentages of the market are derived from the psychology of traders. Traders get involved in the market when they have an idea about the previous market move in the past. They know in what way, the market is going to move. When the particular pattern is formed on the chart by price action, traders get serious and ready to take action according to the type of pattern that is formed. Because they know the psychology of traders. If the pattern is bullish, they place a buy trade and if the pattern is bearish then place the sell trade. In this way, we get information about the psychology of traders with the help of price actions.

Filter the Noise and False Signals
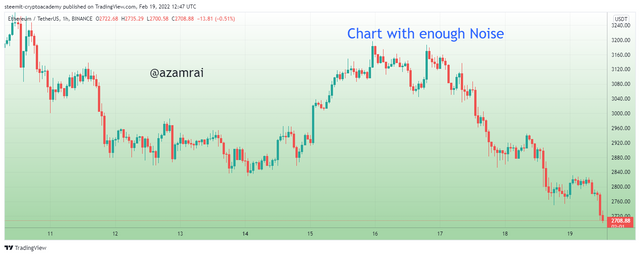
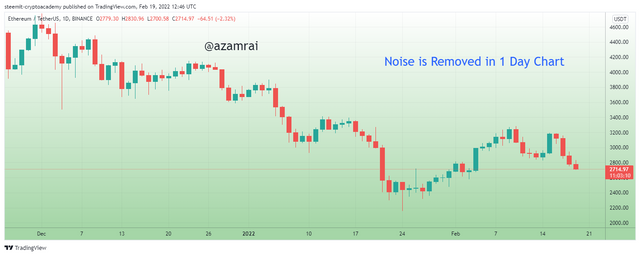
Price is used to filter the noise and false signals. For this purpose, we have different time frames on the chart. When we apply the short time frame on the chart like 30 Minutes or 1 Hour, we get enough noise on the chart. The price fluctuates up and down by making the bearish and bullish candles equal to the time frame length. We can reduce the noise by applying the large time frame of 4 hours or 1 Day chart.
We can also filter the false support and resistance and signals by using the price actions. When we identify the support and resistance level on the 30-minute chart. But when we apply a large time frame like 4 hours’ time frame, we cannot find any support and resistance level on the large time price. In this way, we can filter the false support and resistances.

Will, you chose any other form of technical analysis apart from price action?
I cannot do any other form of technical analysis for trading. Because I get enough information by doing the technical analysis using the price. If want to identify the support and resistance levels then, I look at the previous movement of price action.
If I want to determine the current market trend then I understand the price action. If we want to know what is the next move of the market, then I am looking for different patterns made price action on the chart. I decided to bullish and bearish the market on the basis of patterns. If I want to get information about entry and exit points after determining the type of pattern, support, and resistance.

Explain the Japanese candlestick chart and its importance in technical analysis. Would you prefer any other technical chart apart from the candlestick chart?
The chart is used to do the technical analyses of a particular asset. There are several types of charts that are used to do the technical analysis. Candlestick chart, line chart, Heikin Ashi, and Bar chart are the few types of chart. Among all the charts, the Candlestick chart is technical analyses tool that is widely used by traders.
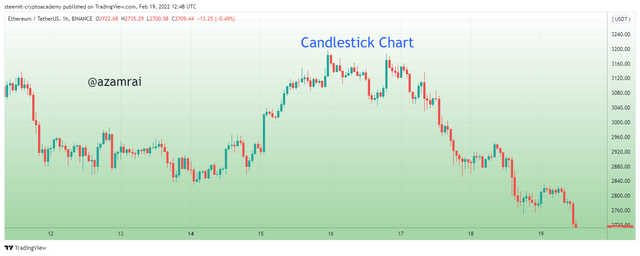
We can determine the supply and demand with help of the Candlestick chart. In the Candlestick chart, there are two types of candles that are formed on the chart. One is Bullish candle. It is a green candle that represents that the buyers are in control over a particular period. On contrary, the second candle is a Bearish candle which represents that the sellers are in control.
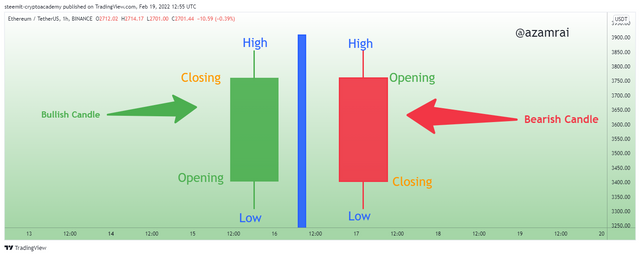
The candlestick has four attributes. One candlestick represents the opening, closing, high and low of assets over a certain time frame. When the closing of the candle is above the opening of the candle then it is known as a bullish candle. On contrary, when the closing of the candle is below the opening of the candle then it is known as a bearish candle.
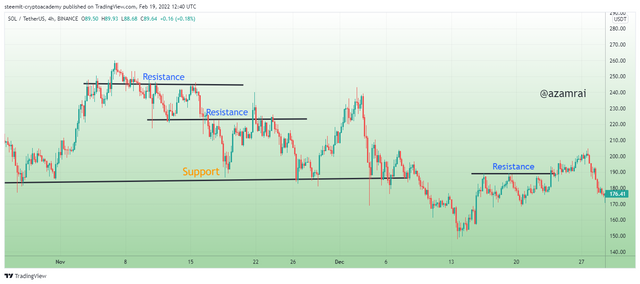
We can determine the current market trend, support, and resistance with help of the Candlestick chart. We can determine the buying and selling pressure with help of a candlestick chart. We can predict the future move with the help of candlesticks. There are several types of candle patterns formed on the chart. We use these candle patterns to predict the future move. Hammer, Inverted Hammer, Shooting Star, and Hanging Man are the candle patterns that are used to predict the future move.

Would you prefer any other technical chart apart from the candlestick chart?
I would like to prefer the Heikin Ashi chart to perform the technical analyses on the chart. The Heikin Ashi chart is a simple chart than a candlestick chart. In the Heikin Ashi chart, it reduces the noise of small bullish and bearish candles.
In the Heikin Ashi chart, the candle is formed by considering only opening, closing, and low. The next candle starts from the point derived after dividing the opening and closing by 2. In this way, the Heikin Ashi chart reduces the noise of fluctuation.
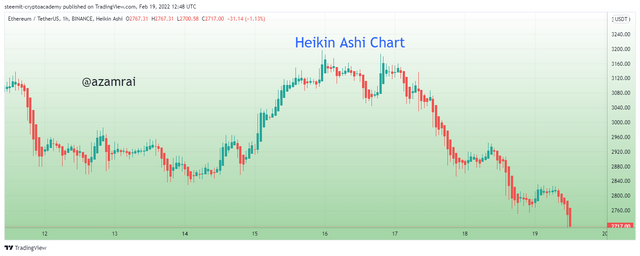
We can easily spot the bearish and bullish trends. It shows a clear bearish and bullish move than the candlestick chart. In the above figure, you can see the Heikin Ashi chart is applied on the chart.

What do you understand by multi-timeframe analysis? State the importance of multi-timeframe analysis.
Multi timeframe analysis is a type of analysis that is done by observing the same asset on different type timeframes. Traders use multi timeframes analyses to perform more precise and accurate analyses. Multi timeframes analysis is comprised of a long, medium, and short timeframe.

Long is time frame including 1 Week, 1 Day chart and 4 hours timeframe. Medium timeframes are included 4 hours, 3 courses, and 1 hour’s timeframe. Traders basically do multi-timeframe analyses to determine the current trend, support, resistance, entry, and exit points.
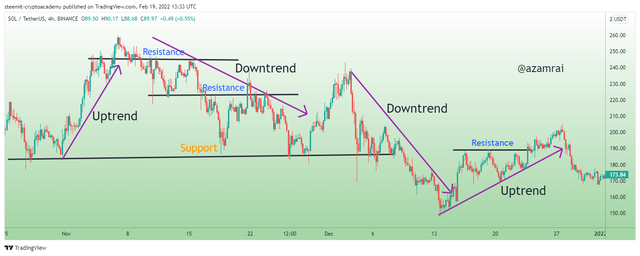
When traders use long timeframes, it means that the traders want to determine the trend in the market. If traders have medium timeframes, it means that the traders want to determine the support and resistance levels on the chart, and if traders use short timeframes, it means that the traders want to determine entry and exit points on the chart.
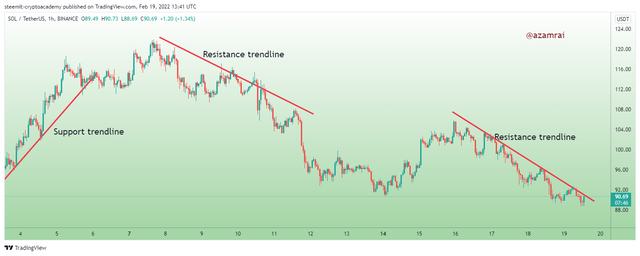
On contrary, if traders want to do long-term trading, then the trader performs analyses by opening the chart o 1 Day or 4 hours. When trader only wants short-term or medium-term trading, then they use 4 hours or 1-hour timeframe chart analyses.
State the importance of multi-timeframe analysis.
In the technical analyses, the multiple timeframes are a great feature. In multiple time frames, we have different timeframe charts to perform different types of trading. By using the different timeframes, we performed technical analyses asset. There are several timeframes available on the chart, but the timeframes that are mostly used by traders are 1 Day, 4 hours, 1 hour, 30 minutes, and 5 minutes.
The multi-timeframe is used to determine the current trend market. We can easily identify the support and resistance levels by applying the different timeframes chart. Sometimes we place traders using the 4 hours timeframe. We found resistance at a particular level. If we want to place sell trade at the resistance level, then we should see the price action at the higher timeframe which is 1 day.
If there is no serious resistance on the daily timeframe then we need to avoid selling. If there is a resistance at the daily chart then we should place sell trade this movement. The multi-timeframe is also used to avoid noise at is present at the lower timeframe. We reduce noise by applying the higher timeframe on the chart. The multi-timeframe also allows determining the better entry and exit positions.

With the aid of a crypto chart, explain how we can get a better entry position and tight stop loss using multi-timeframe analysis. You can use any timeframe of your choice.
Multi timeframe allows to place a trade at the better position with tight stop loss and take profit level. We analyze the particular asset at different timeframes to get a better idea about the entry and tight stop loss points. In this, we first analyze the chart of a particular asset over a large time frame. At the large timeframe set the stop loss and entry points after observing the support and resistance levels.
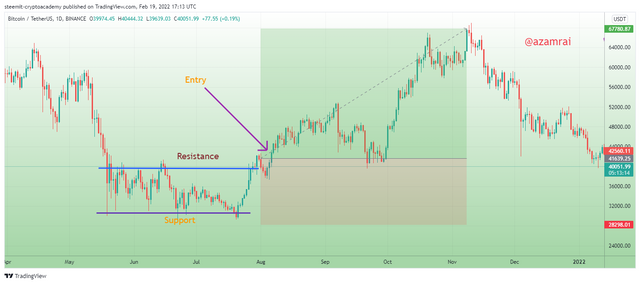
In the above figure, you can see that the large daily timeframe is applied on the chart. In this, we can see that the support is mentioned where the price bounce bank more than one times. Price moves upward direction and face resistance more than two times and bounces back. I place to buy entry when the price breaks the resistance level. As you can see that the price breaks the resistance and at the same timeframe, I place to buy entry. The stop is set just below the support level.
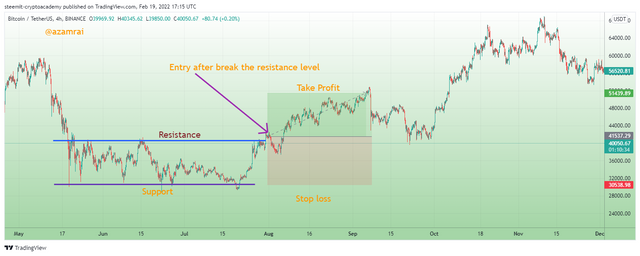
Now we will analyze the chat over 4 hours timeframe. In the above figure, you can see that the 4 hours timeframe is applied on the chart. You can see that the candles are increased in number. In this, I also looking for the support and resistance level. You can see the support and resistances are mentioned where the price bounces back more than one time. In this chart, we also need to identify the support and resistance level. You can see that after breaking the resistance level, I place to buy entry. The stop is set just below the support level.
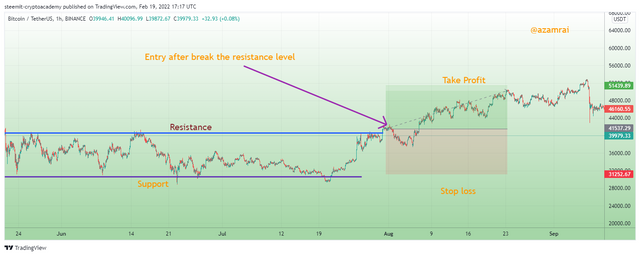
When I apply the 1-hour chart at the same asset, more candle is disclosed. The information about the chart is increased. The time frame is decreased, which will change our strategy and trading style. In this chart, we also look of support and resistance. We identify support and resistance trendlines and place entry after breakout and break the previous support and resistance.

Carry out a multi-timeframe analysis on any crypto pair identifying support and resistance levels. Execute a buy or sell order using any demo account. (Explain your entry and exit strategies. Also, show proof of transaction).
I chose to perform a demo trade. According to the current market situation, the sell trade is suitable. The market is going down, according to this scenario, we take benefit from the bearish market. I chose STEEM/USDT pair for performing the sell demo trade. I placed the demo trade, I chose the Paper Trading platform.
In the above figure, you can see that the STEEM/ USDT chart of 4 hours period length is opened. Here I mentioned the support and resistances on the chart. Because I want to place a trade on the basis of Support and resistances that are used in price action analyses.
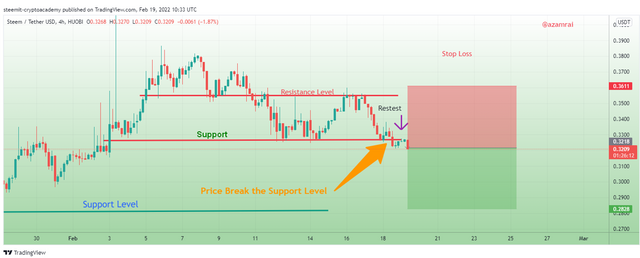
In the figure, you can see the market is just breaking the support level and going down. When the market breaks particular support or resistance, then the market move in the direction of the breakout. The current scenario is the same. So, we need to place the sell order here. So place the Sell order after identifying the support and resistance levels.
You can see that, I identify the support and resistance levels. These support and resistance levels help me to decide the stop loss and take profit level. The stop is applied at just above the resistance level take profit is decided by risk-reward ratio. My risk-reward ratio is 1.
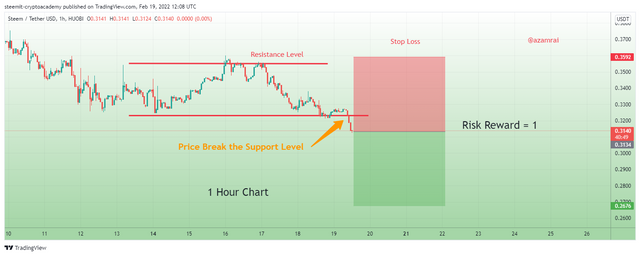
Now we analyze the chart on the 1-hour timeframe. The information about candles on the same chart is further disclosed. In the chart, I identify the support and resistance level in a short timeframe. In a short timeframe, we can also see that the market the support level on a 1-hour timeframe. Stop loss and take profit is applied on the chart.
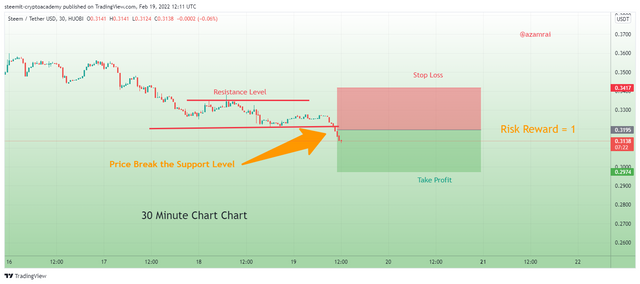
Now we analyze the chart in 30 minutes timeframe. The information about candles on the same chart is further disclosed. In the chart, I identify the support and resistance level on a further short timeframe. When reducing the timeframe, the size of support and resistances are also shrunk with the timeframe. We can see the support and resistance level at a 30-minute timeframe that is smaller than the previous chart.
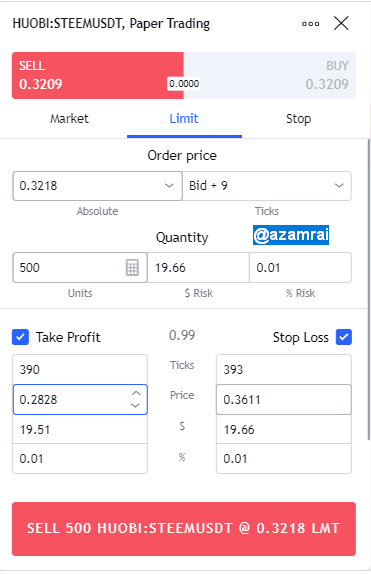
In the above figure, you can see the sell trade details. I apply the stop loss and resistance levels on the chart. Further details about the sell trade are shown in the figure.

In the above figure, the proof of sell trade is mentioned. I place the sell trade with 500 STEEM on the paper trading platform.

A price Action analysis is one of the major analyses is a technical analysis tool. In these analyses, we understand the current market situation by observing the price actions. The analysis through the price action totally depends on the previous price movement.
We can determine the current market trend with the help of price action. Price is used to filter the noise and false signals. For this purpose, we have different time frames on the chart.
There are several types of charts that are used to do the technical analysis. Candlestick chart, line chart, Heikin Ashi, and Bar chart are the few types of charts. Among all the charts, the Candlestick chart is technical analyses tool that is widely used by traders.
Multi timeframe analysis is a type of analysis that is done by observing the same asset on different type timeframes. Traders use multi timeframes analyses to perform more precise and accurate analyses.
