
This is a very informative and interesting lecture on the most important trend indicator. I have learned about the zig-zag indicator and also learn the working of and trading with the zigzag indicator. I try to explain the zig-zag indicators in my own world. I hope it will help you to further understand this topic.

Show your understanding of the Zig Zag as a trading indicator and how it is calculated?
As we know that it is important to determine the trend before starting treading. There are several trend-based indicators that we can use to determine the trend. We can use these indicators to determine the uptrend, sideways, and downtrend. The ZigZag Indicator is also one of them.
The ZigZag Indicator is a technical analyses tool that is used to determine the current trend in the market. The ZigZag Indicator produced results without filtering the noise. The ZigZag Indicator indicates the local highs and lows after filtering and ignoring the small price fluctuations.
It is used to determine the swing highs and swing lows on the chart. Traders made a trading strategy after seeing the swing highs and lows. After determining the swing highs and swing lows traders get an idea about the current trend.
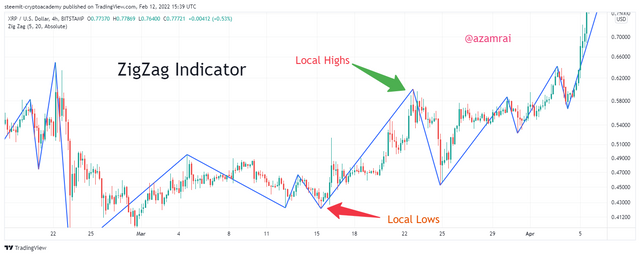
The ZigZag Indicator is not for predicting the future price. We cannot use ZigZag for determining the buy or sell positions. We can only use the ZigZag Indicator for determining the trading position after the confirmation of other technical analyses indicators.
The ZigZag Indicator is used to get the support and resistance levels on the chart. When The ZigZag Indicator swings are clear then we connect the swing with lines. In this way, we get support and resistance. We can also identify the trend reversal pattern after observing the swing highs and swing lows of The ZigZag Indicator.
How to Calculate the ZigZag Indicator
The ZigZag Indicator is working is based on the input in the form of Deviation and Depth. Depth is the number of candles that we want to consider to show the ZigZag Indicator line. And the Deviation is the percentage change in the price of the asset.
In this, if the percentage of deviation is not reaching its limit then it stays at its previous positions. If the deviation or change is greater than the limit then the ZigZag move toward the high or low of the current candle. In this process, the depth is also considered, if the change is made by price within the selected depth, then the line is moved to the related candle high or low according to the trend.
Simply we can say that if the price movement is percentage is equal or greater than the deviation or the depth then the ZigZag line move to the next candle where the condition is satisfied.
This process is continued and the ZigZag Indicator line is moving when the condition is satisfied. In this way, The ZigZag Indicator identifies the highs and lows on the chart.

What are the main parameters of the Zig Zag indicator and how to configure them and is it advisable to change its default settings? (Screenshot required)
There are two main parameters that are included in the ZigZag Indicator that is Deviation and Depth. We will understand both parameters in the following sections.
1. Depth
When the ZigZag indicator is plotting the line then it considers the depth factor. Depth is the number of candles that it considers to plot the line. When the system number of candles if it is equal to predefine settings then it plots the line to the current candle high or low. The default Depth setting is 10. It means that the ZigZag indicator considers a minimum of 10 candles to plot the line.
2. Deviation
It is the second major element that is used in the ZigZag indicator. Deviation basically the amount of change that we consider in the form of a percentage. When price fluctuation is equal to or greater than the predefined deviation then, it plots line toward the bottom or high of the candle where the percentage is reached.
The default setting of the ZigZag indicator is 5. It means that the indicator only plots when a price change is equal to 5%. The ZigZag indicator plotline only when both conditions of depth and deviation are satisfied.
how to configure them and is it advisable to change its default settings?
We can easily configure the ZigZag indicator according to our trading strategy. First, for all, we need to apply the ZigZag indicator on the chart. So, for this purpose, we need to visit any trading platform that has a chart. I open the chart on the TradingView.com platform.
Next, we need to apply the indicator on the chart. For this purpose, we need to click on the fx Indicator button at the top of the chart and then enter the name of the ZigZag and select the indicator as shown in the figure.
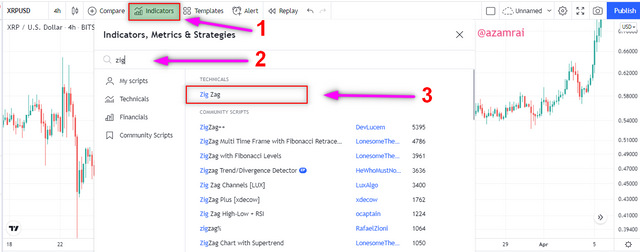
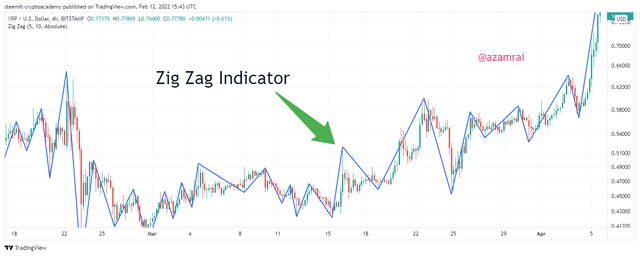
Next, we can configure the ZigZag indicator according to our trading strategy. For this purpose, we need to click on the Setting button of the indicator as shown in the figure. Next, we face two types of settings.
- Input Setting
In this setting, we can change the parameters of the indicator. Here we can change the deviation and depth according to our trading strategy. Depth 10 and Deviation 5 are the default settings of the ZigZag indicator.
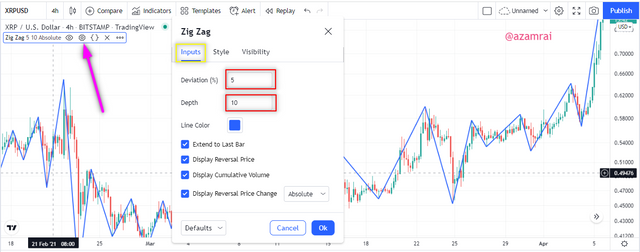
- Style Setting
In this setting, we can switch on and off Indicator lines and Label of the zigzag indicator. You can see the labels in the figure.
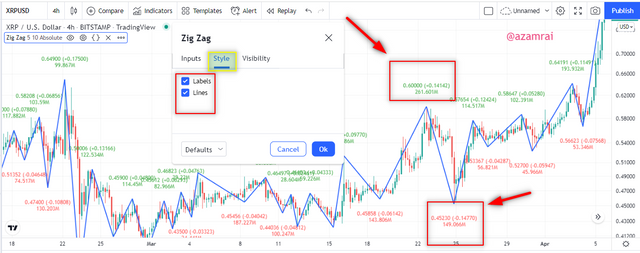
Is it advisable to change its default settings?
To change the default settings of the indicator is only allowed if the trader has completed technical knowledge of trading and about the indicator. We can customize the setting according to our trading strategy. If we do not have enough knowledge then it is not advisable to change the defaults settings of the zigzag indicator.

Based on the use of the Zig Zag indicator, how can one predict whether the trend will be bullish or bearish and determinate the buy/sell points (screenshot required)
The major feature of the ZigZag indicator is to determine the trend. We can easily determine the market trend by observing the swings of the indicator. We can determine the two types of trends using the ZigZag indicator. How we can determine the trend, is discussed in the following sections.
Bullish Trend
As we know that the market is enough volatile. It makes highs and lows over different time periods. To determine the bullish trend through the ZigZag indicator, first, we observe the swings of highs and swings lows. If the market makes higher highs and higher lows swing and moving upward direction then we can say that the current trend is bullish.
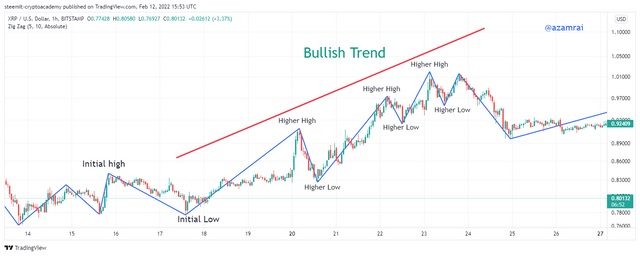
We connect all higher high with a diagonal trendline. In the above figure, you can see that the market is on an uptrend. It makes higher highs and higher lows and moves upward direction. It is an indicator of an uptrend or bullish trend.
Bearish Trend
We can also determine the bearish trend using a zigzag indicator. The market makes highs and lows over different time periods. To determine the bearish trend through the ZigZag indicator, first, we also observe the swings highs and swing lows. If the market makes higher lows and lower highs swings and moves downward direction then we can say that the current trend is bearish.
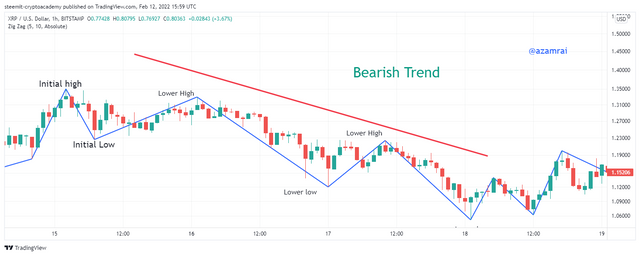
We connect all lower highs with the trendline. In the above figure, you can see that the market is a downtrend. It makes higher lows and lower highs and moves downward direction. It is indicating that the current trend is bearish.
Determinate the Buy and Sell signals from Swings.
Although the ZigZag indicator is not for predicting the trend reversal and trading positions we can determine the buy and sell positions with the help swings. We can easily get the buy and sell signals with the help of using the ZigZag indicator after observing the current swing.
Buy Position
For determining the buy signal with the help of the ZigZag indicator, we need to observe the current swing low. We should also observe the previous swing in order to find out any bullish. When the current swing low is formed, then we need to wait for two bullish candles. After the formation of two bullish candles, we need to place a buy entry. Because we can use this position as a buy position.
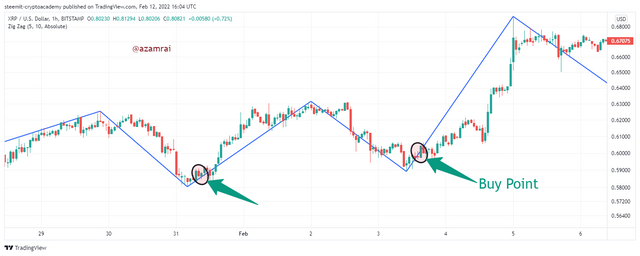
In the above figure, you can see that the current swing is low. After the swing low, we wait for two bullish candles, after that, we place a buy order and set the stop loss under the swing low point, and take profit depending on our risk-reward ratio. I set the take profit according to the risk-reward ratio of 1/2.
Sell Position
For determining the sell signal with the help of the ZigZag indicator, we need to observe the current swing high. We should also observe the previous swing in order to find out any bearish pattern. When the current swing high is formed, then we need to wait for two bearish candles. After the formation of two bearish candles, we need to place sell entries. Because we can use this position as sell position.
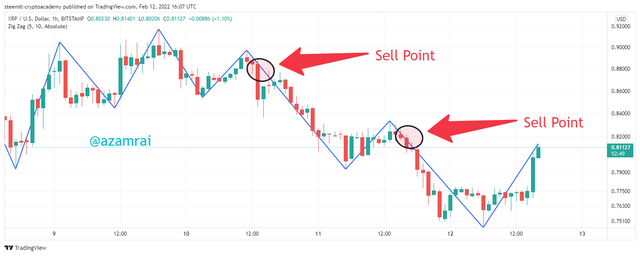
In the above figure, you can see that the current swing is high. After the swing high, we wait for two bearish candles, after that we place a sell order and set the stop loss above the swing high point, and take profit is dependent on our risk-reward ratio. I set the take profit according to the risk-reward ratio of 1/2.

Explain how the Zig Zag indicator is also used to understand support/resistance levels, by analysing its different movements.
The ZigZag indicator is identifying the market highs and lows after avoiding or filtering enough noise. In this way, the ZigZag indicator clearly identifies the highs and lows. We can use these swings as support and resistance level.
Identification of Support level using the ZigZag indicator
As we know that the market price fluctuates and makes highs and lows. At that time, we need to figure out the swing’s lows where the price asset faces rejection several times in order to make a new low at the same level. We consider all the swing lows that indicate the rejection point at the same level. We connect all the swing low rejection points with horizontal lines. This line indicates the support level of the market.
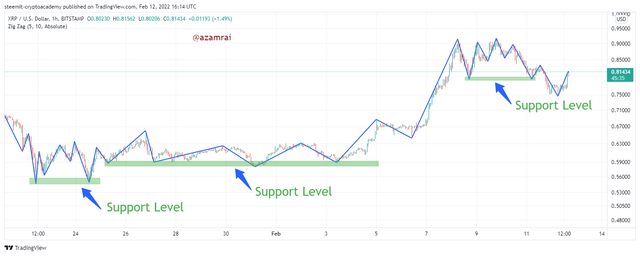
In the above figure, you can see all the swing lows that reject the price to make a new low. All the swing's lows are placed at the same horizontal level. I connect all the swing's lows and now this is working as a support level. In this way, we can figure out the support level using the ZigZag indicator.
Identification of Resistance level using the ZigZag indicator
We can also identify the resistance level using the ZigZag indicator. As we know that the market price fluctuates and makes highs and lows. At that time, we need to figure out the swing’s highs where the price asset faces rejection several times in order to make a new high.
The condition is that all the swing highs are placed at the same horizontal level. We consider all the swing highs that indicate the rejection point at the same level. We connect all the swing high rejection points with horizontal lines. This line indicates the resistance level of the market.
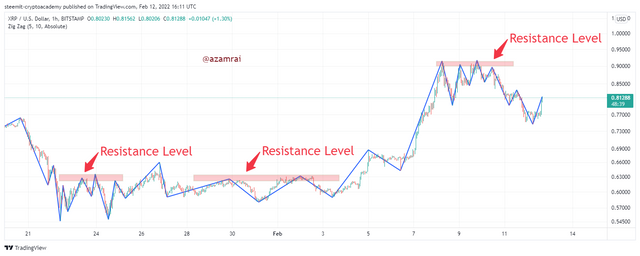
In the above figure, you can see all the swing high that reject the price to make a new high. All the swings highs are placed at the same horizontal level. I connect all the swings highs and now this is working as a resistance level. In this way, we can figure out the resistance level using the ZigZag indicator.

How can we determine different points using Zig Zag and CCI indicators in Intraday Trading Strategy? Explain this based on a clear example.
As we discussed in the above section the zigzag indicator alone is not used to predict the future trend or give any signals. We use additional technical tools with the ZigZag indicator to get the signals. In this section, we will learn how the CCI indicator is helpful in intraday trading using the ZigZag indicator.
The CCI indicator stands for Commodity Chanel index. In short, CCI is used to determine the mindset of traders in the current market situation. We can easily understand the tension on the buyer or seller end using the CCI indicator. The CCI indicator is also used to determine the overbought and oversold of assets. If the oscillating line lies above the +100, then the asset is in the overbought zone and if the oscillating line lies below the -100, then the asset is in the oversold zone.
We use the ZigZag indicator with the CCI indicator to get buy and sell signals using the previous support and resistance that are made swing highs and swing lows. Now will see how we can get buy and sell signals.
Buy Signal
We draw resistance levels after joining the swing highs that are made by the ZigZag indicator. When the price breaks this resistance level then we need to see the CCI indicator. If the CCI lies above the +100, then it is a buying opportunity. We need to place a buy order after breaking the resistance level.
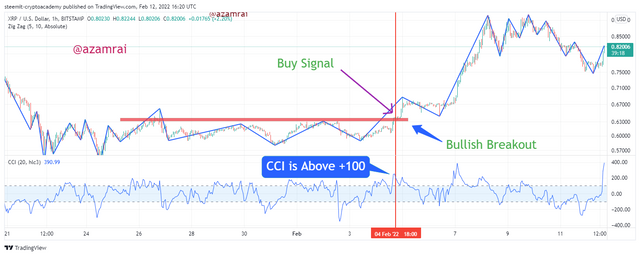
In the above figure, you can see that the price breaks the resistance level and at the same time the CCI lies above +100. It is good to buy signal for us. We can see that after the breakout the price is increased.
Sell Signal
We draw support levels after joining the swing lows that are made by the ZigZag indicator. When price breaks this support level then we need to see the CCI indicator. If the CCI lies below the -100, then it is a selling opportunity. We need to place a sell order after breaking the support level.
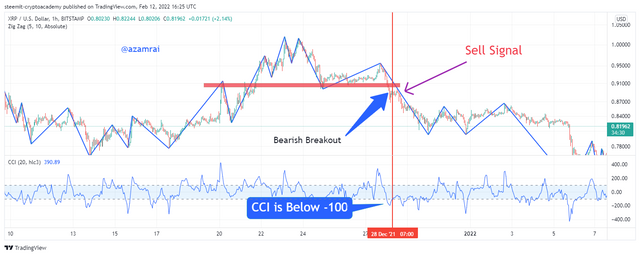
In the above figure, you can see that the price breaks the support level and at the same time the CCI lies below -100. It is a good cell signal for us. We can see that after the breakout the price is decreased.

Is there a need to pair another indicator to make this indicator work better as a filter and help get rid of false signals? Give more than one example (indicator) to support your answer.
The ZigZag indicator is only used to get information about the current trends. We can also figure out the support and resistance levels after joining the swing highs and swing lows. It is not more than that. We need additional technical tools or indicators to perform trading. we can buy and sell signals through the ZigZag indicator if we use additional indicators. For this purpose, I use two indicators according to the requirement. One is Moving Average and Another one is Stochastic Indicator.
Trading with Simple Moving Average and ZigZag Indicator.
Simple Moving Average is also a trend-based indicator that is mostly used by traders to get the buy and sell signal. We are two Moving Averages with different parameters. In the first Simple Moving Average, we use 55 Period length and in the second, we set 20-period length. We get a trading signal on the cross of both Simple Moving Averages.
First, we observe the chart and find any pattern, support, and resistance on the chart that is made by price swings. And if we perform trading with help of the breakout concept then we can confirm the buy or sell signal with the SMA. Here we will only discuss the Sell scenario.
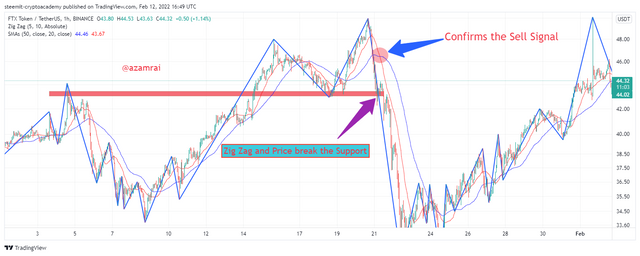
In this situation, we need Simple Moving Averages to confirm and filter the signals. In the above figure, you can see that the price breakout the little support level. We place a sell order after the breakout. We confirm the sell signal by SMA crossover. If SMA is not made cross then it is the wrong sell signal. We need to place a sell order when the price breakout the support level and SMA made across. It is a write time place sell entry. In this way, we confirm the sell signal with the SMA.
Trading with Stochastic and ZigZag Indicator.
The stochastic indicator is another indicator that we use with the ZigZag indicator to confirm the trading signals. This is an oscillator like RSI. It is also used to get the oversold and overbought regions. It oscillates between 0-100. When line above the 80, it indicates the overbought of the asset. When the line is below 20, it indicates the oversold of assets.
First, we observe the chart and find any pattern, support, and resistance on the chart that is made by price swings. And if we perform trading with help of the breakout concept then we can confirm the buy or sell signal with a stochastic Indicator. Here we will only discuss the buy scenario.
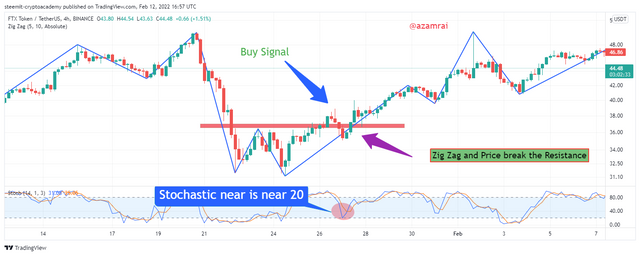
In the above figure, you can see that the price of the asset breaks the previous resistance. It indicates the buy signal. We confirm the buy signal by Stochastic indicator. If the Stochastic is moving upward direction or above the 20 then, it confirms the buy signal.

List the advantages and disadvantages of the Zig Zag indicator:
When we use The ZigZag Indicator then we have a few advantages and disadvantages at the same time. Now, we will discuss both advantages and disadvantages of The ZigZag Indicator.
Advantages of The ZigZag Indicator
- We can easily determine the current trend in the market with the help of The ZigZag Indicator.
- It better results when we do swing trading with the ZigZag Indicator.
- It is used in conjunction with other technical indicators to confirm the current trend.
- We produced can customize The ZigZag Indicator according to our trading strategy.
- When we use The ZigZag Indicator as a confluence tool with Elliot Wave and Fibonacci retracement, it produced satisfying results.
- Although it is not a tool to predict the future price we can identify different patterns, support, and resistance levels.
Disadvantages of The ZigZag Indicator
Now we discuss the disadvantages of The ZigZag Indicator. It is not a lagging indicator that why it is a major disadvantage.
- We can use The ZigZag Indicator as a standalone tool for making the investment. Because it is not used previous data of price action that help him to predict the future price.
- The ZigZag Indicator is a repainting indicator that is also a disadvantage because, if the deviation limit is not reached then it can be repainted and the price changes its direction due to not reaching the limit.
- When performing trading with other related indicator tools and using The ZigZag Indicator as a confirmation tool then it is only suitable for short-term or swing trading. It is not suitable for long-term trading.

Conclusion
The ZigZag Indicator is a technical analyses tool that is used to determine the current trend in the market. The ZigZag Indicator produced results without filtering the noise. The ZigZag Indicator is used to get the support and resistance levels on the chart.
Depth is the number of candles that it considers to plot the line. Deviation basically the amount of change that we consider in the form of a percentage. If we do not have enough knowledge then it is not advisable to change the defaults settings of the zigzag indicator.
If the market makes higher highs and higher lows swing and moving upward direction then we can say that the current trend is bullish. If the market makes higher lows and lower highs swings and moves downward direction then we can say that the current trend is bearish.
