

1. What is your understanding of the TRIMA indicator?

TRIMA stands for Triangular Moving Average, and Moving averages are specialized in detecting price trend movements of an asset in the trading market. This is made possible by means of taking records periodically on an average of all mini points that have historical price records closed as the price signal moves and fluctuates.
SMA moves behind the fluctuating price signals as it moves throughout periods, and the SMA (Simple Moving Average) line readily response to price signal changes along this movements, hereby picking up noise and insignificant/fake signals as well that can lead to wrong information from chart readings.
The creation of the TRIMA indicator which was done in the form of an upgraded SMA that has more properties so as to help sieve out the noise and fake signal readings as much as possible. This is possible since the TRIMA indicator consist of a double smoothed SMA which results to twice the average, forcing the TRIMA indicator to greatly reduce the presence of noise and fake signals from the market. As such, better readings can be obtained.
The TRIMA indicator is very vital when crypto trading is concerned, due to the constant fluctuation in the market that results in the presence of noise and fake signals that leads traders astray. With TRIMA indicators are the most effective when reduction of noise and fake signals in the market is needed.

2. Setup a crypto chart with TRIMA. How is the calculation of TRIMA done? Give an illustration. (Screenshots required).

To successfully setup the TRIMA indicator, simply follow the steps below (carried out on the Tradingview App).
Once you are on a crypto pair chart just like the one shown below (SHIB/USDT crypto pair), click on Indicator option at the top.
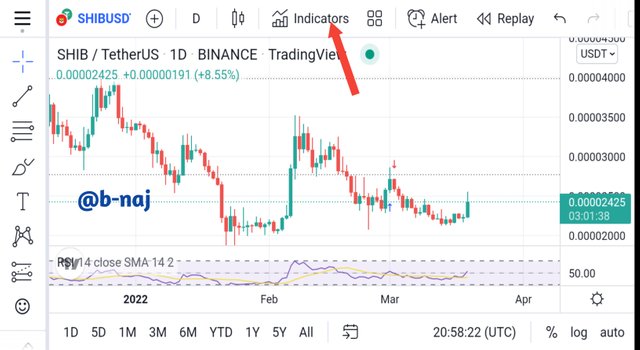
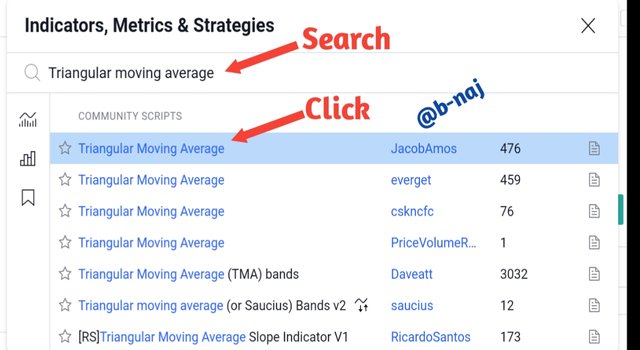
Screenshot gotten from Tradingview App Once you get there, search for Triangular Moving Average (full meaning of TRIMA) and click on it to add to the chart.
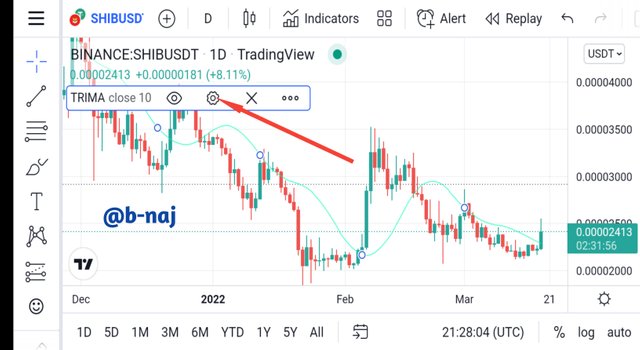
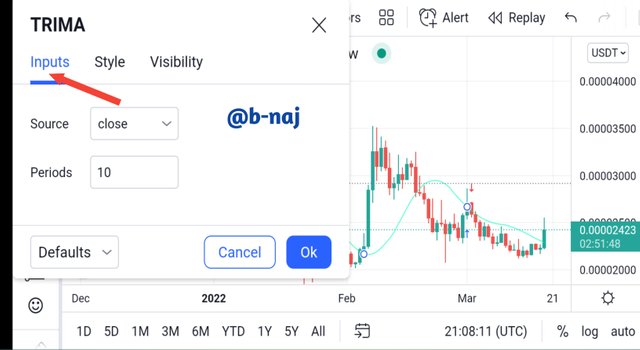
Screenshot gotten from Tradingview App Now, you can click on the setting icon and edit the default settings on inputs, Style, and Visibility to best suit your taste as you trade.
It is important to fill in correct values under inputs that can help smoothen the signals to give better readings.
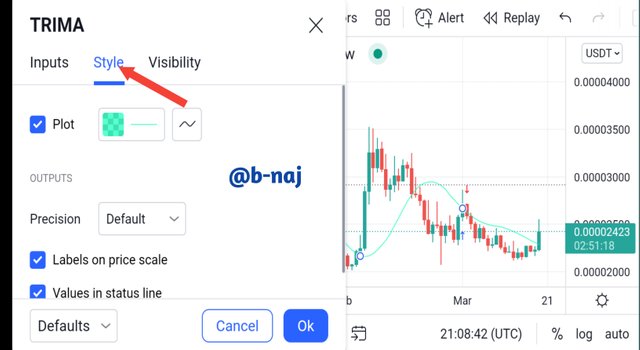

How To Calculate TRIMA Indicator
As said in some part of question 1 explanations, the TRIMA indicator's calculations depends on the results of the SMAs at every historic price data point recorded.
Since two SMAs are involved, the doubled-smoothed average results from these SMAs along a specified time frame is established so as to get the value of TRIMA indicator. Below is the formula for calculations;

Where;
- P1-5 = Price of asset within the first 5 periods respectively
- Pn = Final price of asset (price at the end of calculated periods)
- n = Total number if periods.
From the formula above, the values for SMA can be gotten and fitted in the TRIMA formula below.
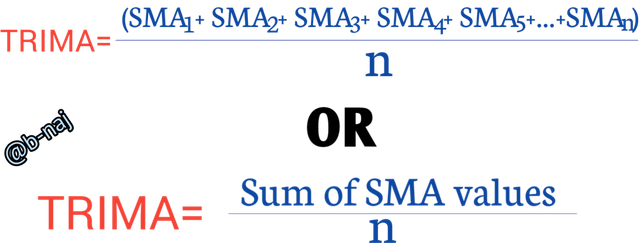

3. Identify uptrend and downtrend market conditions using TRIMA on separate charts.

TRIMA indicator is a trend-based indicator which is quite effective in locating trend movements, since it closely lags behind the price signal. It is expected for traders to adjust the periods (short or long) found in the TRIMA indicator, that works best for them and their trading strategies at the time.

Uptrends

For uptrends, price signals move above the TRIMA indicator line as the price signals observe a bullish trend, creating new higher lows and higher high points.
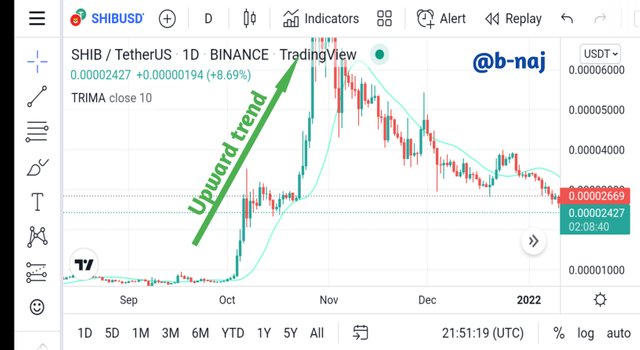
The SHIB/USDT cypto pair chart above shows price signals moving above the TRIMA indicator due to a bullish trend reversal (from bearish to bullish trends), forcing the TRIMA line to act as a dynamic support line at the time.

Downtrends

For downward trends, price signals move below the TRIMA indicator line as the price signals observe a bearish trend, creating new lower highs and lower low points.
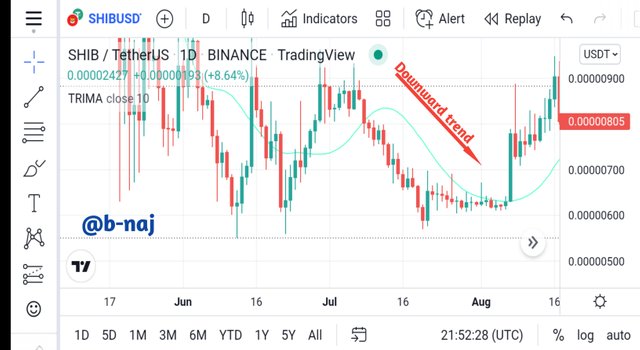
The SHIB/USDT crypto pair chart above shows price signals moving below the TRIMA indicator indicating a bearish trend reversal (from bullish to bearish trends), forcing the TRIMA line to act as a dynamic resistance line at the time.

4. With your knowledge of dynamic support and resistance, show TRIMA acting like one. And show TRIMA movement in a consolidating market. (Screenshots required).

The resistance and support levels are very essential in trend signal charts as they help investors/traders to effectively pinpoint an entry and exit point during trading. When compared to the resistance and support levels ruled on by traders to evenly connect higher highs (resistance levels) and lower lows (support levels), dynamic resistance and support levels are more efficient since they are readily established with change in price signal movements
Dynamic resistance and support levels can be readily established on a TRIMA indicator line.
Dynamic Resistance Level:
This is made possible when price signals make a retest during a bearish (downward) trend, and the TRIMA line acts as a dynamic resistance line that resist the upward move, forcing the price signals to observe a continuity in previous trend (bearish trend continuity). This dynamic resistance line can be used as a sell entry point.
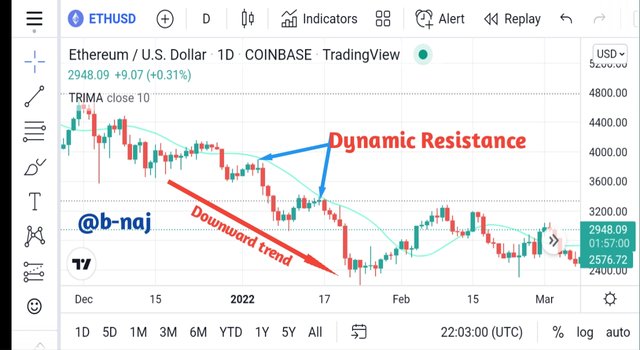
The chart above shows the TRIMA line acting as a dynamic resistance line for a bearish trend in price of said asset in the market. The price is supported from falling below the TRIMA line.
Dynamic Support Level:
This is made possible when price signals make a retest during a bullish (upward) trend, causing the TRIMA line to act as a dynamic support line that supports the falling price, forcing it to observe a continuity in previous trend (bullish trend continuity). This dynamic support line can be used as a buy entry point.
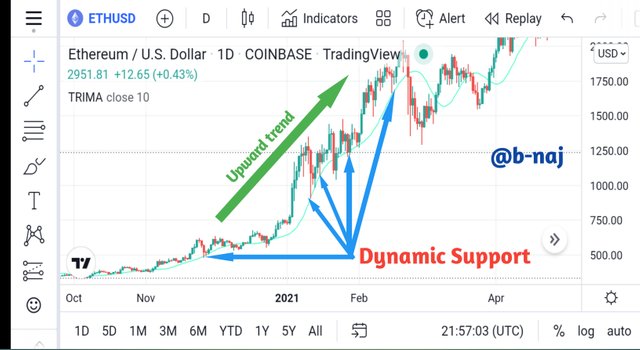
The chart above shows the TRIMA line acting as a dynamic support line for a bullish trend in price of said asset in the market. The price is resisted each time it tries to move above the TRIMA line.
TRIMA Movement In A Consolidating Market
Consolidating markets can also be referred to as a Ranging market. Here, the price signals are seen to repeatedly touch the resistance and support levels, without cutting through and in no specified trend direction. This implies that buyers match sellers in the market and circulation of asset in the market at the time is low. At such an instant, the TRIMA line is seen to run through the middle of the price signals, with no dynamic resistance or support level role.
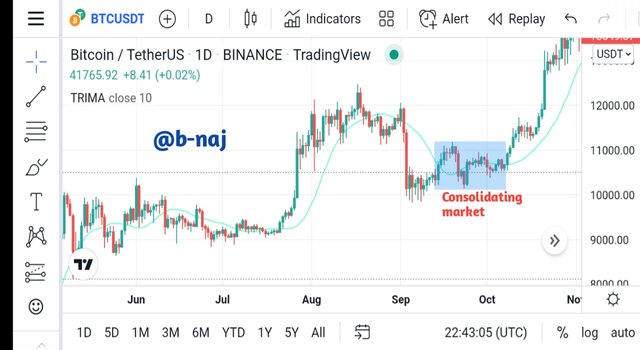
The above BTC/USDT crypto pair chart clearly illustrates the movement of a TRIMA inrucator line in a consolidating market wherein the TRIMA line is seen to move within the fluctuating price signals as they move. A consolidating market is brought to a sudden stop once the TRIMA line is seen completely above or below the price signal line, indicating the start of a trend.

5. Combine two TRIMAs and indicate how to identify buy/sell positions through crossovers. Note: Use another period combination other than the one used in the lecture, explain your choice of the period. (Screenshots required).

The TRIMA indicator sieves out noise and fake signals, and it is double smoothed so as to avoid fake signal readings as it lags behind the price signal line. This greatly helps traders in the reduction misleading information due to late and wrong signal readings that may cause the trader to place a late stop loss zone or open a wrong entry position which would definitely result to loss of asset.
As such, a combination of 2 TRIMA on trading chart would greatly reduce defects that result from lagging. So a long and short period TRIMA line is introduced on same chart that helps eliminate noise as much as possible, and accurately reacts to present price signals.
I shall be working with 9 period TRIMA line (short period) and 30 period TRIMA line (long period).
Crossover between these TRIMA lines would indicate a buy or sell signal.
Crossover Of TRIMA lines (Sell Signal)
A sell signal is detected once the short period line (9 period TRIMA line) crosses the long period line (30 period TRIMA line) and moves beneath, indicating the start of a possible bearish trend reversal (bullish to bearish trend). This is the best suited point to make a sell entry.
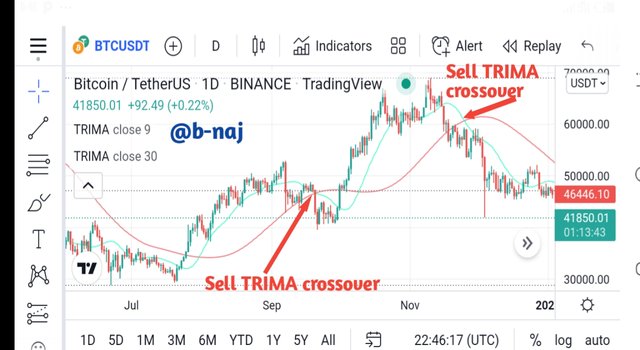
The above BTC/USDT crypto pair chart shows the presence of a sell signal crossover as the short period (9 period) TRIMA line crosses and moves beneath the long period (30 period) TRIMA line. Once the crossover was established, a sudden bearish move was seen.
Crossover Of TRIMA lines (Buy Signal)
For a buy signal crossover, the short period line (9 period TRIMA line) crosses the long period line (30 period TRIMA line) and moves above, indicating the start of a possible bullish trend reversal (bearish to bullish trend). This is the perfect point to make a buy entry.
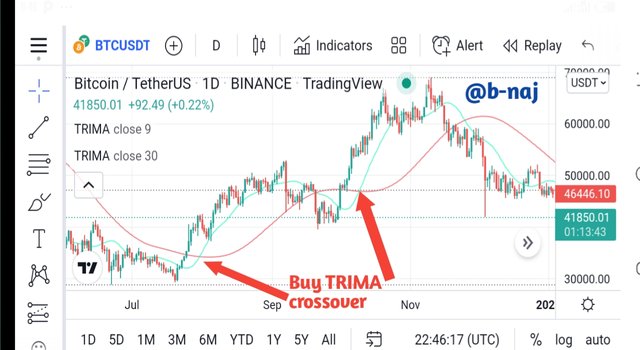
The above BTC/USDT crypto pair chart shows the presence of a buy signal crossover as the short period (9 period) TRIMA line crosses and moves above the long period (30 period) TRIMA line. Once the crossover occurred, a sudden bullish trend started.
In the event of a consolidating market, both TRIMA lines (short and long period lines) repeatedly crosses one another, in no specified trend direction. In such a case, it is better to wait until a trend direction starts either way before you can decisively open an entry position.
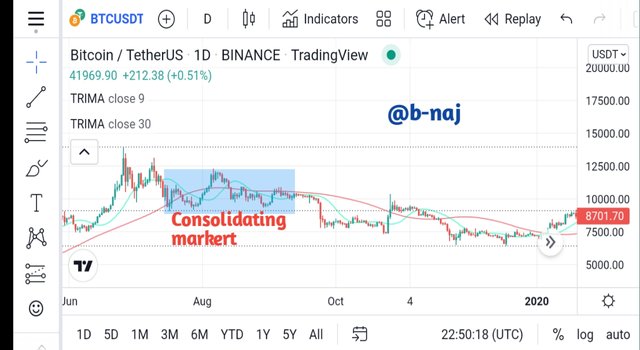
The chart above is an illustration of a consolidating market.

6. What are the conditions that must be satisfied to trade reversals using TRIMA combining RSI? Show the chart analysis. What other momentum indicators can be used to confirm TRIMA crossovers? Show examples on the chart. (Screenshots required).

Conditions for Trading Bullish Reversal using TRIMA
- Add 2 TRIMA indicators (long and short periods).
- Add an RSI indicator also and wait for it to get to the oversold zone (below 30).
- The short period TRIMA line must move above the long period TRIMA line to indicate a bullish trend reversal.
- It is safe to take stoploss and takeprofit ratio 1:1
Conditions for Trading Bearish Reversal using TRIMA
- Add 2 TRIMA indicators (long and short periods).
- Add an RSI indicator also and wait for it to get to the oversold zone (below 30).
- The short period TRIMA line must move beneath the long period TRIMA line to indicate a bearish trend reversal.
- It is safe to take stoploss and takeprofit ratio 1:1

7. Place a Demo and Real trade using the TRIMA reversal trading strategy (combine RSI). Ideally, bullish and bearish reversals. Utilize lower time frames with proper risk management. (Screenshots required).


8. What are the advantages and disadvantages of TRIMA Indicator?

Advantages Of A TRIMA Indicator
A much more accurate reading can b obtained by traders which can greatly help in identifying fake signals that misleads.
Trend reversals can be spotted easily when signals are amplified with combination of 2 TRIMAs (long and short periods). This is seen when the TRIMA lines crossover each other.
The presence of a double smoothed average greatly helps in the elimination/reduction of noise and fake signals
Movement of the price signals over and under the TRIMA indicator line can easily help traders to spot trends (bearish and bullish) wen observing the charts.
Disadvantages Of A TRIMA Indicator
The TRIMA indicator works best when combined with other trading tools/strategies.
The TRIMA indicator line always trails behind the price signal line, as such, later responses could be given especially when the signal on the price line was swift in fluctuation and have changed already.

Much thanks goes to Professor @fredquantum for a well taught lesson.

