
I am delighted to actively partake in this week 2 homework for Beginners, resulting from the beautiful lesson ( Link ) conveyed to us by professor @sachin08. Haven said that, i'll get straight to work.


QUESTION 1.
What is your understanding about Triangles in Trading. Explain all forms of triangles in your own words. (Screenshot required)
Triangle patterns during trading can be used to determine some possible outcomes, and a more decisive forecast can be realized from these details to determine when a breakout could occur. As such, for starters in the crypto trading world, Triangles in trading are without a doubt one of the simplest patterns to be observed, and they exist in three (3) different states. These three (3) different states are Symmetrical, Ascending, and Descending Triangles.
I will further talk on the three (3) different Triangle patterns that exist, so that you see what i meant by saying a more decisive forecast can be realized from these details to determine when a breakout could occur.
1) Symmetrical Triangle
This pattern is also known as the Neutral Version because its movement is not clear on whether it's in the Descending (bearish trend) or Ascending (bullish trend) direction, thus its movement is seen to possess a 50%/50% chance of a breakout towards either directions.
It is worth noting that a symmetrical triangle possesses no horizontal line, so it is advisable to take a start point by registering a spot for long, above the lowest upper price (resistance line), and a short, below the highest lower price (support line). A diagonal resistance line and a support line is obtained, which are both drawn to meet neutrally forming a Symmetrical triangular edge (no horizontal line present) as shown in the photo below.
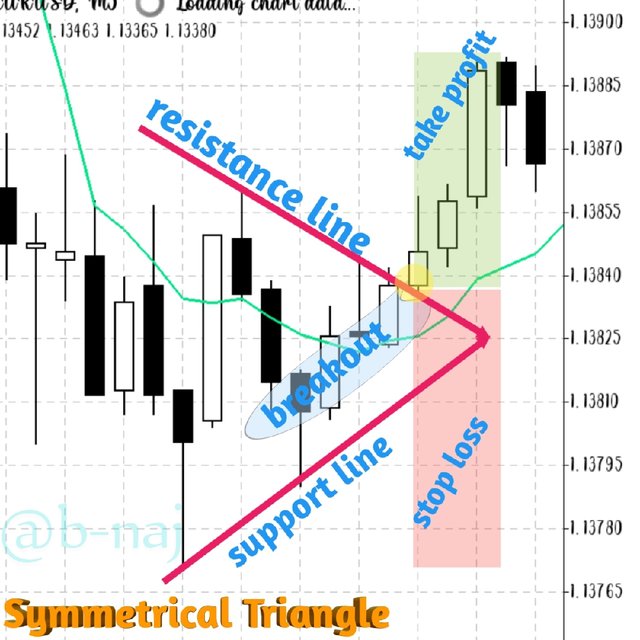
NB: It is advised that traders should always wait until a breakout occurs on either the support or resistance line, before an entry can be made.
So, from the photo above, it is safe for a trader to long at that point where the trend breaks the resistance line (yellow shaded circle), due to a bullish trend. But if the break was experienced on the support line, a bearish trend would have been seen, and traders should preferably short at the point of breakout.
2) Ascending Triangle
This pattern is also known as the Bullish Version because its movement is much like that of a bullish pattern. This is mainly because the price of the said asset tends to sprint off of the same upper price level, every single time it tries to drop. It never goes any inch closer to the lower edge than its previous price levels, and as such, it is safe to always look out for an upward breakout, since this triangular pattern (Ascending Trend) has in fact a bullish pattern movement.
A start/entry spot is obtained by picking out any point that is above the horizontal line (straight resistance line), and a trendline (support line) is drawn beneath in a diagonal manner, such that a triangular edge is formed as shown in the screenshot below.
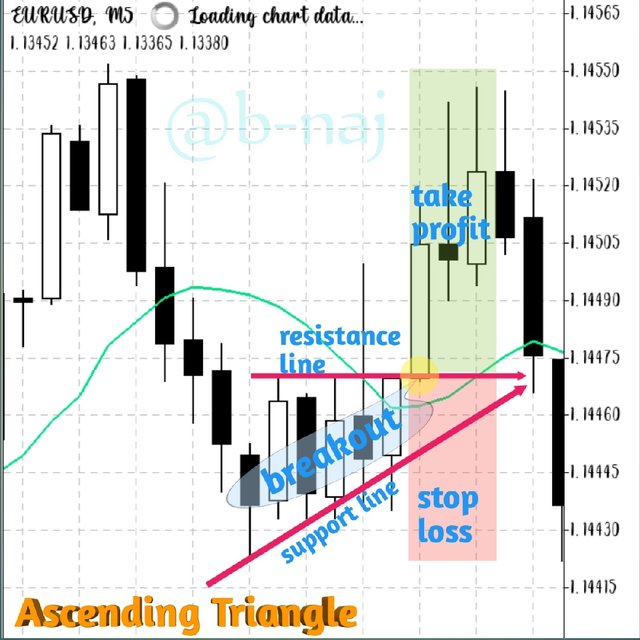
Just below the edge is seen to be the breakout moment wherein a sharp rise in price is seen when compared to previous prices. This is the perfect point to set a stop loss just below the that triangular edge, or/and take profit above.
3) Descending Triangle
This triangular pattern is also known as the Bearish Version because its movement is much like that of a bearish pattern. This is mainly because the price of the said asset tends to sprint off of the same lower price level, every single time it tries to drop. It never goes any inch closer to the upper edge than its previous price levels, and as such, it is safe to always look out for a downward breakout, since this triangular pattern (Descending Trend) has in fact a bearish pattern movement.
An entry spot is obtained by picking out any point that is below the horizontal line (support line), and a resistance line is drawn above, in a diagonal manner, such that a triangular edge is formed as shown in the screenshot below.
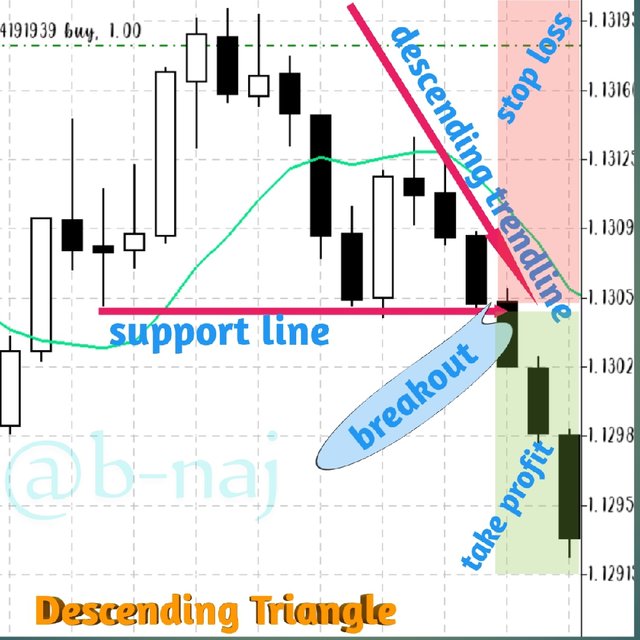
Once the trend breaks the support line, you can now take a short entry since this movement is a bearish (downward) trend.
All graphs for question 1, were gotten from the MetaTrader app
QUESTION 2.
Can we also use some Indicators along with it Triangle Patterns? Explain with Screenshots.
Yes we can. The most common indicator i can think of is the Moving Average Convergence Divergence (MACD) Indicator which co-functions with the triangle patterns to give a more detailed output during trading.
QUESTION 3.
Explain Flags in Trading in your own words and provide screenshots of both Bull Flag and Bear Flag.
Flag patterns appear mainly around the stop point of a sudden trend in price, and last just for a limited time frame before another trend is seen. A flag shape is seen just before a new trend emerges.
So, Flag patterns result from a sudden stop of a price trend, and the follow of another trend in price not long after, hereby combining with the Triangle pattern to form a Flag pattern
These patterns (Flags) result to decicive trades and a bigger profit too.
Two (2) types of Flags exist, Bull Flag and Bear Flag.
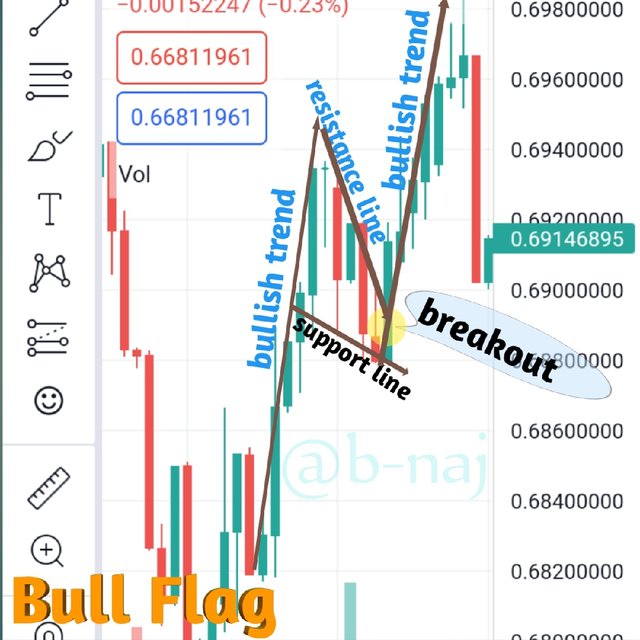
1) Bull Flag:
This is seen after a flag pattern emerges and points downwards, just after a significant bullish trend in price came to a sudden stop. With a bullish flag, an entry point is preferably that point where a new sharp trend in price breaks the Resistance line as demonstrated in the bull flag chart below.
2) Bear Flag:
This is seen after a flag pattern emerges and points upwards, just after a significant bearish trend in price came to a sudden stop. This sort of flag patterns can be seen every time there is a significant overall sellout. With a bearish flag, an entry point is preferably that point where a new sharp trend in price would break the Support line as demonstrated in the bear flag chart below.
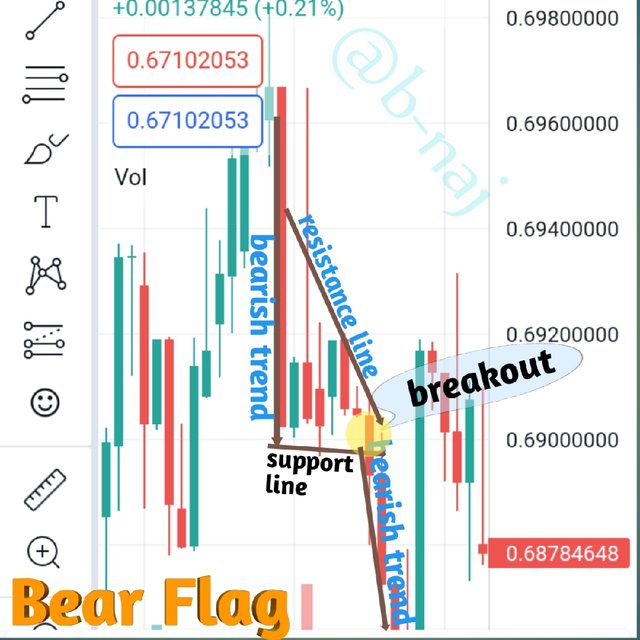
It is worth noting that the support and resistance lines that form the Triangle during a flag pattern, doesn't have to always come together to appear pointy. These lines (resistance and support) can as well be parallel, although, a much better accuracy in trade can be realized from a downward pointing flag (bullish).
All graphs for question 3, were gotten from the Tradingview site
QUESTION 4.
Show a full trade setup using these Patterns on any Cryptocurrency chart. (Ascending Triangle, Symmetrical Triangle, Bear Flag)
Ascending Triangle
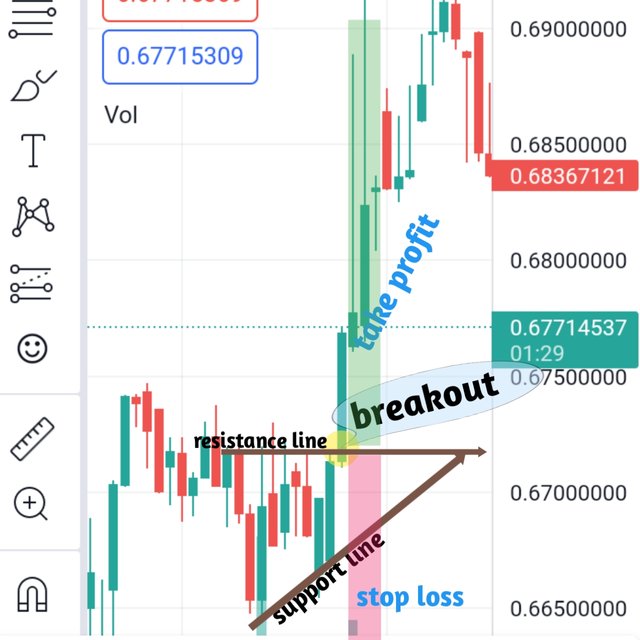
Here, a breakout trend was experienced on the resistance line, which prompted me to take a long entry.
If it swayed adverse to your previous entry, it is preferable to stop the loss. What i mean here is that, if your choice was in respect to a bearish trend, stop the loss, and do same if vice versa by taking the profit.
Descending Triangle
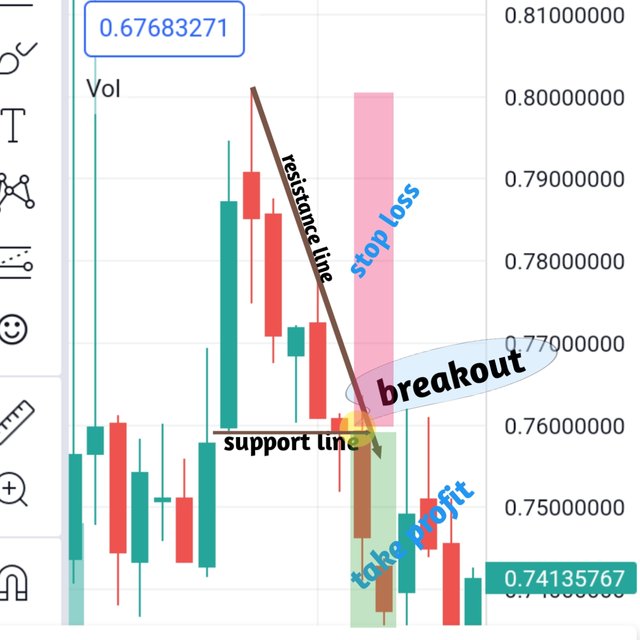
Here, a breakout trend was experienced on the support line, which prompted me to take a short entry.
If your previous entry favoured a bullish trend, it is advisable to stop the loss.
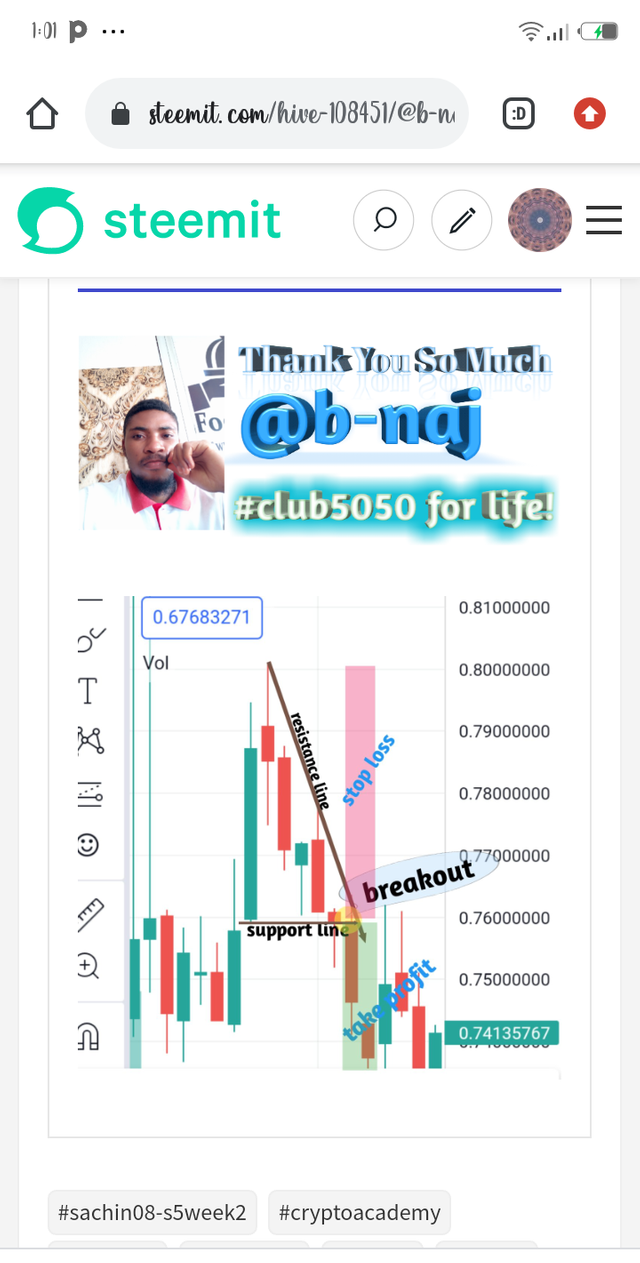
Symmetrical Triangle
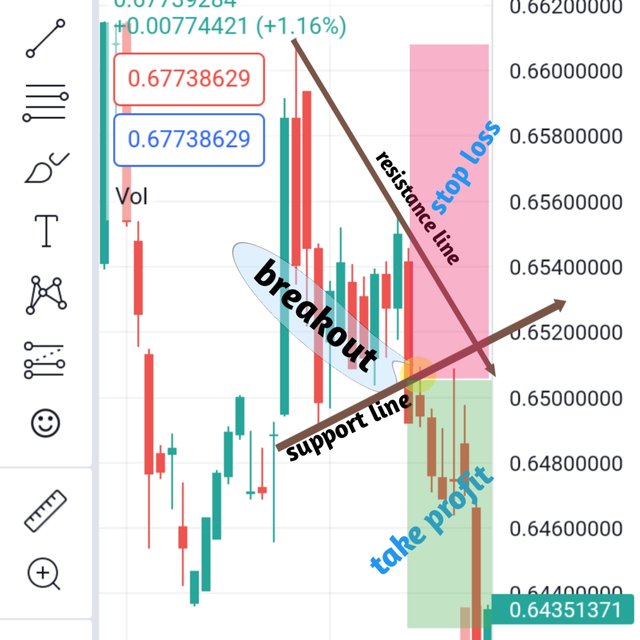
Here, a breakout trend was experienced on the support line, which prompted me to take a short entry. It is always advisable to wait until a breakout occurs before you make an entry for a symmetrical triangle pattern.
If it swayed adverse to your previous entry (your entry being a bullish trend), it is preferable to stop the loss.

CONCLUSION
Upon the completion of this homework, i have improved greatly my understanding on how to read and interpret Triangular patterns during trading, the different types of triangular patterns, and how to determine and interpret a bull and bear flag.
Special thanks to Professor @sachin08. I enjoyed your lesson, what a great manner to start.

Downvoting a post can decrease pending rewards and make it less visible. Common reasons:
Submit
Good day Professor @sachin08. I edited my work to remove the last graph i fitted in my work by mistake, which i just realised now.
As shown in the screenshot below
I have successfully removed it since it was uploaded twice by mistake. Thank you sir, i look forward to your remark.
Downvoting a post can decrease pending rewards and make it less visible. Common reasons:
Submit