
I am delighted to once more take part in this week 4 homework for Beginners Season 5. A big thank you to professor @sachin08, for the wonderful lesson (Link) this week.

QUESTION 1
Explain Rectangle Pattern in your own word.

Rectangle Patterns result from a series of zigzag movements of the price trend signals, in a horizontal manner as it occasionally touches the top and bottom trendlines, before it finally makes a breakout towards any direction of trend as shown below.
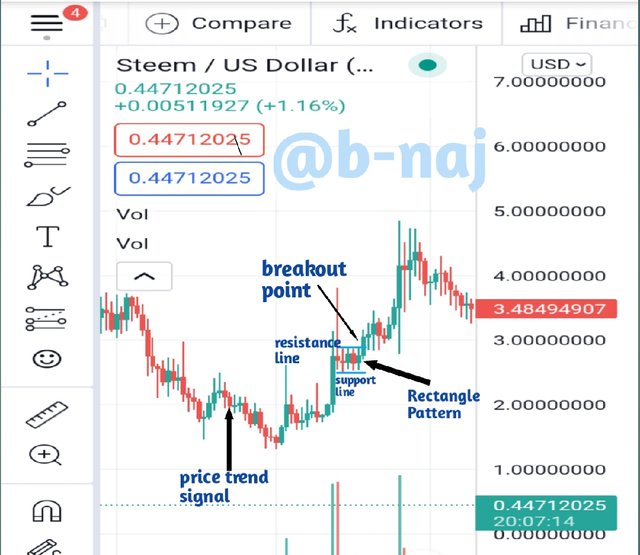
As you can see, the price signal is seen to make zigzag movements within the resistance line (top trendline) and the support line (bottom trendline), as it touches them occasionally without making a definite breakout towards a bullish or bearish trend. For Rectangle Patterns to be realized, the zigzag movements of price trend signals within the parallel trendlines (resistance and support lines), must occur multiple times within a said time frame, and must occasionally touch both trendlines several times (at least 2 to 3 times) as it moves. This portrays the the fact that neither buyers nor sellers are in control of the market during that time frame. As such, a Rectangle Pattern is neither termed as bullish or bearish.
It is worth noting that Rectangle Patterns can be seen (start points) after a recently observed trend movement, and just before a breakout point (stop points). As such, breakout points towards a specified trend (bullish or bearish), are often the perfect time to make an entry with respect to trend direction.
For an upward breakout to be seen, buyers must take back significant control over the market to realize a bullish trend (breakout occurs on the top trendline), while for a downward breakout to be seen, sellers must once more dominate the market to realize a bearish trend (breakout occurs on the bottom trendline).
Breakout in a specified trend direction doesn't always maintain the movement towards that direction. When the direction of trend switches moments after a breakout from the Rectangle Pattern, the action is called a failed break (breakout unsuccessful).


QUESTION 2
How to identify Rectangles. Explain with Screenshots.

When trying to accurately identify Rectangles, two (2) very important factors are taken into consideration; the Price Trend Signals and the Horizontal Trendlines. I will further elaborate on these factors below.
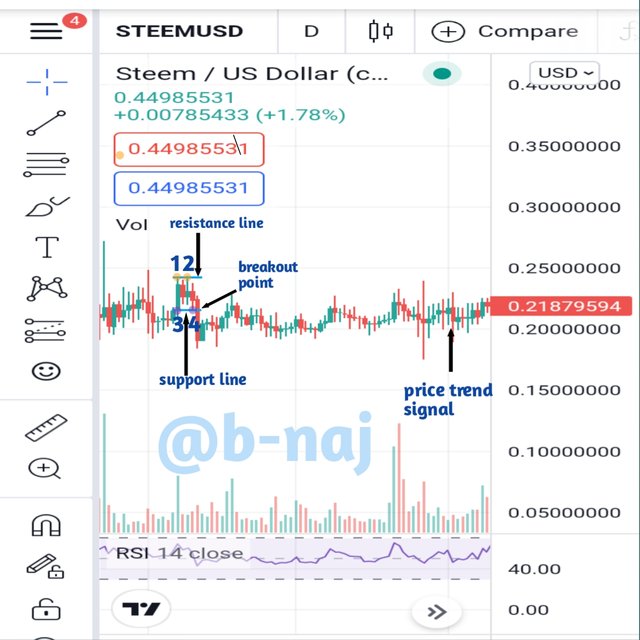
Remember that for a Rectangle to be created, price trend signals must move in a zigzag motion, touching (at least 2 to 3 times each) the two parallel trendlines inbounding it, within a specific time frame as shown above, numbered 1 - 2 for the top trendline (resistance line), and 3 - 4 for the bottom trendline (support line).
As such, locating a Rectangle Pattern becomes easier if a trader is on the lookout for a point wherein the price trend signals seemingly have no decisive trend direction (neither bullish nor bearish), and moves in a horizontally zigzag manner, with the higher high and lower low points relatively bouncing off the straight horizontal trendlines (resistance line and support line) as shown above.
A straight resistance line (top horizontal trendline) is drawn to touch all the higher high price trend signals, while a straight support line (bottom horizontal trendline) is drawn to touch all the lower low price trend signals. These higher high points (numbered 1 and 2 above) and lower low points (numbered 3 and 4 above) that touch the horizontal trendlines, must be evenly spread across the time frame of this supposed Rectangle Pattern, and must touch both horizontal trendlines at least 2 to 3 times each, before it can qualify to be termed a Rectangle Pattern.


QUESTION 3
Can we use indicators with this pattern to get accurate results? Explain with Screenshots.

Traders can use the Volume indicator alongside the Price Trend Signals, to better read and predict the possible outcome of the market in the nearest future.
Most times, the Volume indicator shows the possible trend direction that will commence after an ongoing Rectangle Pattern stops. This display is done by the volume indicator 1 to 2 days prior to a breakout point. It is displayed within the same time frame for which the Rectangle Pattern is being observed, as demonstrated in the chart below.
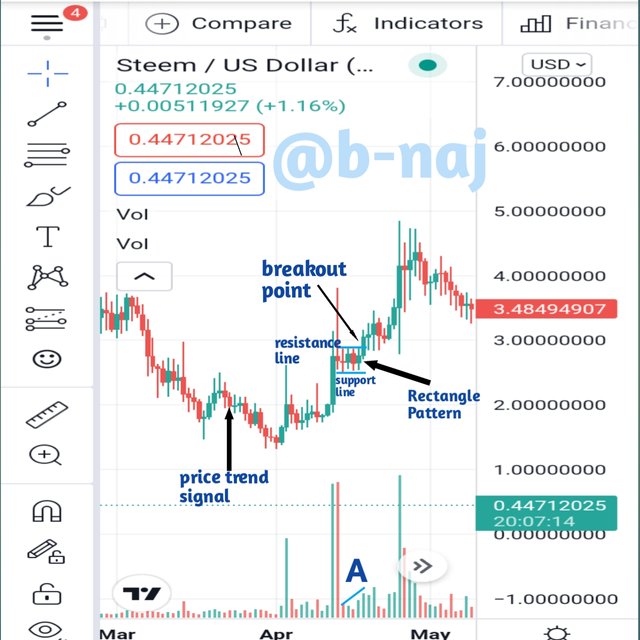
The chart above shows the Volume indicator displaying a rise (labeled as A on the chart) for the same time frame as that of the Rectangle Pattern, indicating a possible bullish trend to take place after a breakout. At such instant, the trader can readily make a long entry (Buy) of asset, as he perceives a rise in trend.


QUESTION 4
Explain Rectangle Tops and Rectangle Bottoms in your own words with Screenshots of both patterns.

The main observation for determining whether or not a Rectangle is Top or Bottom is to carefully check which horizontal trendline (top or bottom) observed a touch first from the price trend signal enters the corridor created by the parallel horizontal trendlines. For a Rectangle Bottom, the price trend signal will cut/touch the bottom horizontal trendline (support line) first, before bouncing off to the other; While for a Rectangle Top, the price trend signal will cut/touch the top horizontal trendline (resistance line) first, before bouncing off to the other.
Rectangle Top
On the chart below, you can see an example of a Rectangle Top pattern, with a bullish trend which seemingly looks like it cuts through the support line first, but that's not the case. The price trend signal actually cuts the top horizontal trendline (resistance line) first, hereby creating a Rectangle Top pattern.
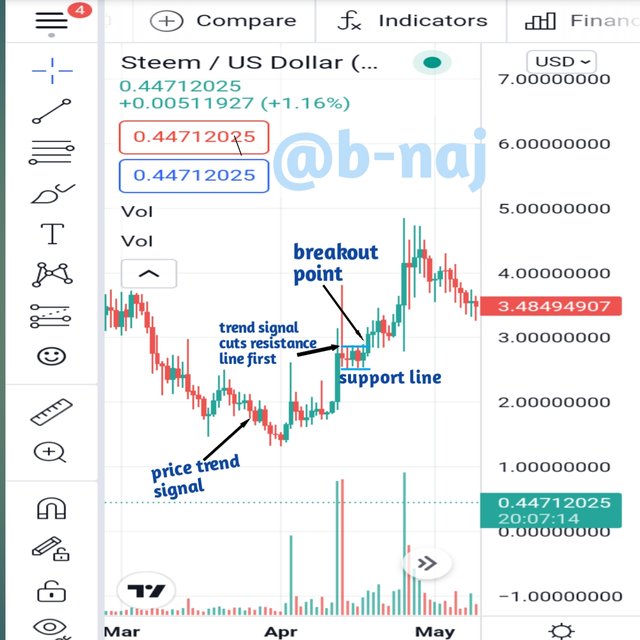
A Rectangle Top is seen when the incoming price trend signal cuts through or touches the resistance line first. Feel free to zoom in to get a clearer view.
Rectangle Bottom
On the other hand, the chart below shows an example of a Rectangle Bottom pattern, with a bullish trend as well which cuts through the support line first. The price trend signal cuts the bottom horizontal trendline (support line) first, hereby creating a Rectangle Bottom pattern.
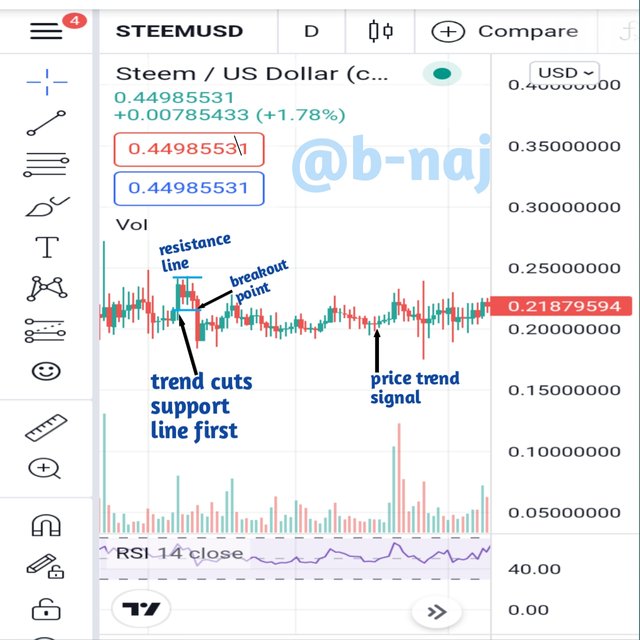
Rectangle Bottom is seen when the incoming price trend signal cuts through or touches first the Support line. Feel free to zoom in to get a clearer view.


QUESTION 5
Show full trade setup using this pattern for both trends. ( Entry Point, Take Profit, Stop Loss, Breakout)

The first thing is to observe a point along the price trend signals wherein buyers or sellers show relatively equal strength in the market. This is evidenced by the zigzag horizontal movement of the price trend signals, with no obvious direction in trend movement (sideways movement).
Once the Rectangle Pattern is seen, a pair of parallel horizontal trendlines (resistance line for top, and support line for bottom) are placed to barricade the price trend signals. They are drawn such that all higher high points bounce off the inside of the resistance line (top trendline), and all the lower low points bounce off the inside of the support line (bottom trendline). Now, we look out for the breakout point which would make as an entry point (either a short entry or long entry), depending on the direction of trend after the breakout.
For A Bullish Trend.
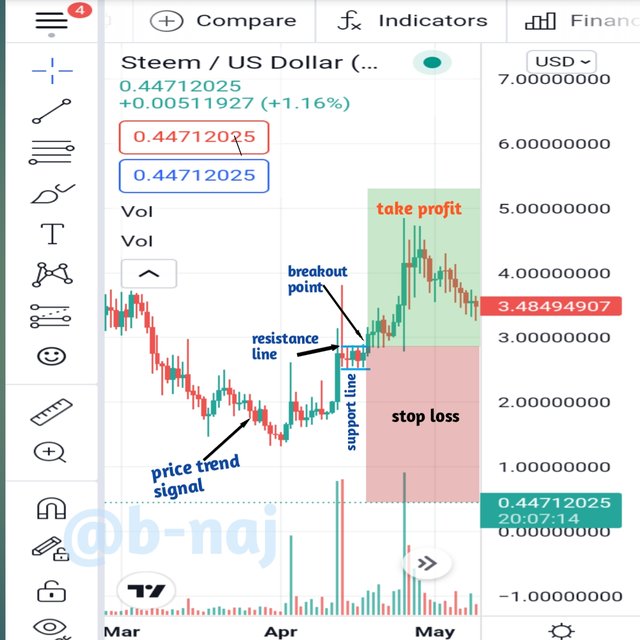
Here, the breakout point is seen to occur on the upper trendline (resistance line), and as such a long entry is made since the trend movement is upwards, signifying a bullish trend. My breakout point automatically marks out as my entry point, and as such, any point above that entry point becomes a Take Profit zone, and any point below that entry point becomes a Stop Loss zone.
For A Bearish Trend.
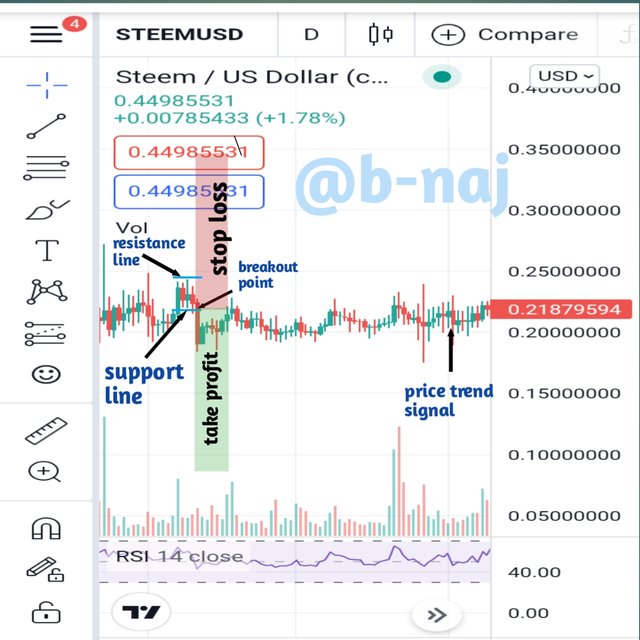
From the above chart, the breakout point occur on the lower trendline (suoport line), and as such a short entry is made since the trend movement is downwards, signifying a bearish trend. My breakout point automatically marks out as my entry point, and as such, any point below that entry point becomes a Take Profit zone, and any point above that entry point becomes a Stop Loss zone.

TRADINGVIEW.COM, UNLESS STATED OTHERWISE

CONCLUSION

After completing this homework, much added knowledge was gained on;
- What Rectangle Patterns are all about (how they are formed and the different types that exist).
- How to pair up the observation of a Rectangle Pattern with an Indicator, so as to get a much more accurate result.
- The needed steps on how to identify a Rectangle Pattern when monitoring the price trend signal of an asset in the market.


I would like to take this opportunity to thank and applaud professor @sachin08 for a perfectly taught lesson, and well simplified to the best of my understanding.
Thank you all so much for stopping by, have a fulfilling day.


Downvoting a post can decrease pending rewards and make it less visible. Common reasons:
Submit