Hello everyone, this is my homework post about Price forecasting. An outstanding lecture was delivered by Professor @stream4u for week 2 in Season 2.
What is Price Forecasting.
Price forecasting is a method used by traders to predict the future price of an asset. A trader assumes the price of any asset to go up or down in future based on different kind of analysis.
The asset can be any fiat currency pair, commodity or cryptocurrency. As we are related to cryptocurrency, so we will discuss about crypto asset. There are different methods available for price forecasting. Different traders use different methods as per their knowledge and type of investment.
Why Price Forecasting is needed.
Trading of crypto assets is not easy for everyone. Only the skilled people with proper knowledge of market can carry out trading. For this, traders use different methods of analysis like Technical analysis, Fundamental analysis and sentimental analysis. It is quite impossible for a trader to be successful without price forecasting.
Price forecasting can be termed a tool that helps the trader to get clear idea about the market. With the help of this tool, a trader can predict whether an asset will move up or move down. In this regard, he will enter or exit the market. So, it can be said that Price forecasting is an essential part of trading and it cannot be ignored. Before entering any trade, a trader must analyze the movement of the asset and then a trade should be carried out. A trader is blind without analysis like price forecasting and this can lead to a huge loss to the trader and he can lose all of his investment.
Methods of Price Forecasting.
1. Technical Analysis.
It is a very widely used method and huge number of traders uses this method to analyze the market. In this method, different technical tools are used. For example, Moving average, Support and Resistance, Trend changing indicators, price action strategy etc are used to analyze the market. There are too many tools available to help the traders for the sake of Price Forecasting. In this method, price chart and use of candlestick is often used to analyze the market. Opening and Closing of candlestick is very important factor. It can be carried out on the basis of any time period e.g. Daily timeframe, weekly, monthly, hourly. It depends on the trader which time frame he chooses.
2. Fundamental Analysis.
Traders who uses Fundamental analysis does not look at chart patterns. Some external factors are taken into consideration by the trader that can affect the future value of underlying asset. Financial statements that are given on monthly basis, are taken by the traders into consideration and on its basis, the trader predicts the future value of the asset. Management involved can also be the factor to influence the future price of the asset.
For example, if any reputed member of crypto family announces to join a particular crypto project, then it can be assumed that the price of that asset will rise in near future. A trader can buy any asset on the basis of such news.
3. Sentimental Analysis.
These analyses are often used with combination of either Technical or Fundament analysis. In this method, a trader tries to evaluate the sentiment of the traders. There are tools available that show the sentiment of the traders. For example, broker’s software shows the average of bullish and bearish traders of an asset.
Moreover, new channels and discussion forums are also helpful in determining the move of an asset. A panic situation can happen on the basis of news, which can result in lot of volatility in the market, and such traders tries to cash it by entering the market.
Which one is better?
All the methods to analyze the market are very important but Fundament and Technical analysis are the methods that are used widely the traders. Sentimental analysis is used in addition to Technical or Fundamental analysis. I will choose Technical analysis for me to do Price forecasting as it gives very clear picture of the traders behavior on Chart pattern. Chart is very helpful in understanding the trend of the market and technical indicators are very helpful in entering and exiting the market.
How to do Price Forecasting?
In this section, I will try to explain how to forecast the future price of an asset. I will explain with the help of screenshots.
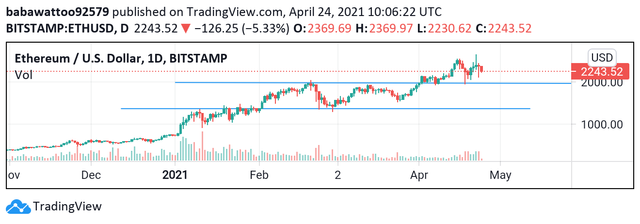
Below is the screenshot of Ethereum and it is in daily time frame. I have drawn Support level and a resistance level. Below line is Support line and the upper line is Resistance line. Market has remained in this range for quite some time and has given opportunity to traders to enter in the market.

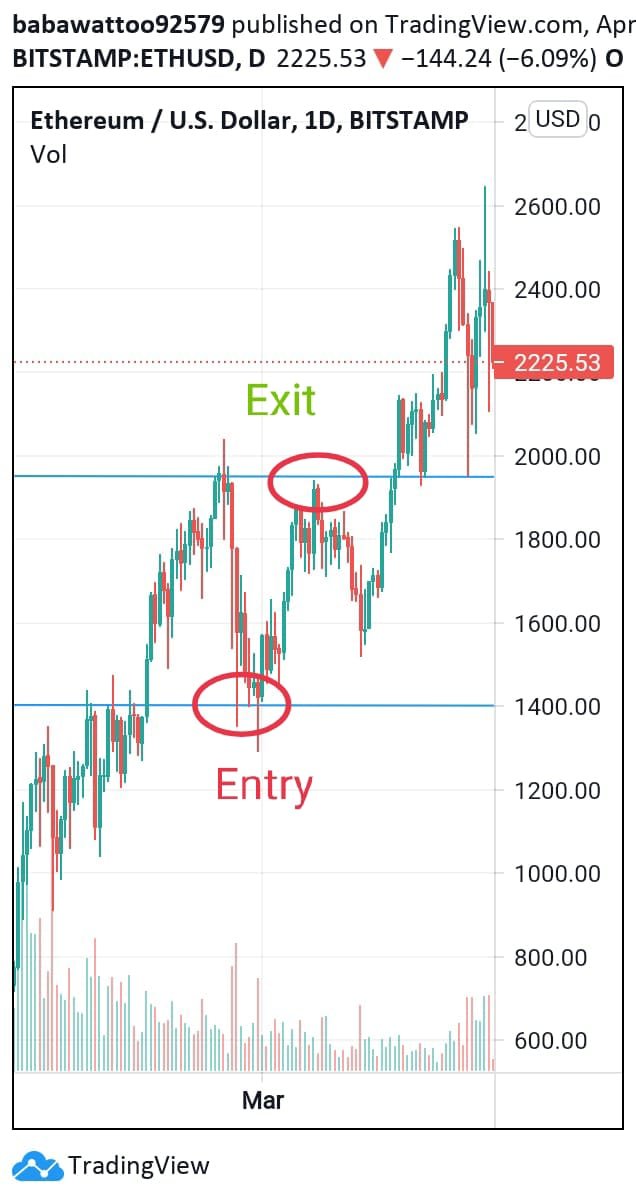
In the below screenshot, I have pointed out the entry point and exit point. After breakout of previous resistance, which is now acting as Support line, market has again went down to test the support level. It bounced back from the support and it is the entry point for traders to enter the market by buying Ethereum. New Resistance line is the target and the market again reached the resistance line before breakout. It is the exit point for the traders. In this way, a trader can make profit with the help of price forecasting.

Conclusion.
Price forecasting is essential for the trading whether it is forex trading or crypto trading. With sound knowledge of price forecasting, there is very less chance of loss and without price forecasting, it is a rare case that a trader makes profit. Trading is almost impossible with price forecasting.
Thanks and Regards,
Hi @babawattoo
Thank you for joining The Steemit Crypto Academy Courses and participated in the Week 10 Homework Task.
Your Week 10 Homework Task verification has been done by @Stream4u, hope you have enjoyed and learned something new.
Thank You.
@stream4u
Crypto Professors : Steemit Crypto Academy
Downvoting a post can decrease pending rewards and make it less visible. Common reasons:
Submit